 Email
Email Print
Print


Neuroblastoma Treatment Market - Forecast(2024 - 2030)
Neuroblastoma is the most common type of cancer found in infants. Neuroblastoma is caused as a result of embryonal malignancy of sympathetic nervous system which arises from the neuroblasts. This cancer develops in the nerve tissues of adrenal, chest or spinal cord. Neuroblastoma is classified as a “rare disease” in the U.S. by the National Institute of Health (NIH), and Orphanet in Europe. Neuroblastoma is a cancer which starts in primitive nerve cells. It rarely occurs after age around 10 years. According to America Cancer Society, neuroblastoma accounts for over 7% of the total cancer cases in age group of 0 to 14 years of age. Some of the most common symptoms of the neuroblastoma are firm mass in the abdomen, enlarged stomach, weight, anemia, crankiness, fever, bone pain, bulging eyes, dark circles around the eyes, weakness, and high blood pressure
North America held substantial revenue share of the overall oxygen therapy market The increasing number of product approvals and high R&D investments are the key growth drivers responsible for the largest share of the market in this region. It is followed by Europe in terms of revenue share owing to the presence of favorable government initiatives for improving respiratory care, such as European Committee for Hyperbaric Medicine (ECHM), involved in promoting awareness pertaining to the treatment.This report on global Neuroblastoma Treatmentis segmented on the basis of Neuroblastoma Treatment application, end-use industries using Neuroblastoma Treatment for wide range of end-use applications and market size in various geographical regions.
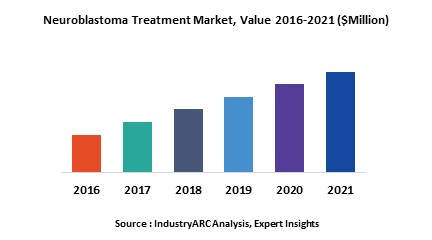
This report identifies the Neuroblastoma Treatment market size in for the year 2016-2021, and forecast of the same for year 2021. It also highlights the potential growth opportunities in the coming years, while also reviewing the market drivers, restraints, growth indicators, challenges, market dynamics, competitive landscape, and other key aspects with respect to Neuroblastoma Treatment market.
This report segments global neuroblastoma market on the basis of type, procedures, and regional market as follows:
This report identifies all the major companies operating in the global Neuroblastoma Treatment market. Some of the major companies’ profiles in detail are as follows:
North America held substantial revenue share of the overall oxygen therapy market The increasing number of product approvals and high R&D investments are the key growth drivers responsible for the largest share of the market in this region. It is followed by Europe in terms of revenue share owing to the presence of favorable government initiatives for improving respiratory care, such as European Committee for Hyperbaric Medicine (ECHM), involved in promoting awareness pertaining to the treatment.This report on global Neuroblastoma Treatmentis segmented on the basis of Neuroblastoma Treatment application, end-use industries using Neuroblastoma Treatment for wide range of end-use applications and market size in various geographical regions.
This report identifies the Neuroblastoma Treatment market size in for the year 2016-2021, and forecast of the same for year 2021. It also highlights the potential growth opportunities in the coming years, while also reviewing the market drivers, restraints, growth indicators, challenges, market dynamics, competitive landscape, and other key aspects with respect to Neuroblastoma Treatment market.
This report segments global neuroblastoma market on the basis of type, procedures, and regional market as follows:
- On the basis of treatment categories of Neuroblastoma Treatment, this report is segmented into five major treatment. Some of the major treatment covered in this report are as follows: Surgery, Chemotherapy, High-dose chemotherapy with stem cell support, Monoclonal antibody treatment, Radiotherapy and Others
- On the basis of drug categories of Neuroblastoma Treatment, this report is segmented into five major drugs. Some of the major drugs covered in this report are as follows: Xalkori (crizotinib), Adriamycin PFS (Doxorubicin Hydrochloride), Clafen (Cyclophosphamide), Vincasar PFS (Vincristine Sulfate) and Others
- This report has been further segmented into major regions, which includes detailed analysis of each region such as North America, Europe, Asia-Pacific (APAC) and Rest of the World (RoW) covering all the major country level markets for Neuroblastoma Treatment in each of the region.
This report identifies all the major companies operating in the global Neuroblastoma Treatment market. Some of the major companies’ profiles in detail are as follows:
- Seattle Children’s
- Cure Search
- Texas Children’s
- NANTGE Healthcare
- Others
1. Neuroblastoma Treatment Market - Overview
1.1. Definitions and Scope
2. Neuroblastoma Treatment Market - Executive summary
2.1. Market Revenue, Market Size and Key Trends by Company
2.2. Key Trends by type of Application
2.3. Key Trends segmented by Geography
3. Neuroblastoma Treatment Market
3.1. Comparative analysis
3.1.1. Product Benchmarking - Top 10 companies
3.1.2. Top 5 Financials Analysis
3.1.3. Market Value split by Top 10 companies
3.1.4. Patent Analysis - Top 10 companies
3.1.5. Pricing Analysis
4. Neuroblastoma Treatment Market – Startup companies Scenario Premium
4.1. Top 10 startup company Analysis by
4.1.1. Investment
4.1.2. Revenue
4.1.3. Market Shares
4.1.4. Market Size and Application Analysis
4.1.5. Venture Capital and Funding Scenario
5. Neuroblastoma Treatment Market – Industry Market Entry Scenario Premium
5.1. Regulatory Framework Overview
5.2. New Business and Ease of Doing business index
5.3. Case studies of successful ventures
5.4. Customer Analysis – Top 10 companies
6. Neuroblastoma Treatment Market Forces
6.1. Drivers
6.2. Constraints
6.3. Challenges
6.4. Porters five force model
6.4.1. Bargaining power of suppliers
6.4.2. Bargaining powers of customers
6.4.3. Threat of new entrants
6.4.4. Rivalry among existing players
6.4.5. Threat of substitutes
7. Neuroblastoma Treatment Market - Strategic analysis
7.1. Value chain analysis
7.2. Opportunities analysis
7.3. Product life cycle
7.4. Suppliers and distributors Market Share
8. Neuroblastoma Treatment Market – By Drug (Market Size -$Million / $Billion)
8.1. Market Size and Market Share Analysis
8.2. Application Revenue and Trend Research
8.3. Product Segment Analysis
8.3.1. Xalkori (crizotinib)
8.3.2. Adriamycin PFS (Doxorubicin Hydrochloride)
8.3.3. Clafen (Cyclophosphamide)
8.3.4. Vincasar PFS (Vincristine Sulfate)
8.3.5. Others
9. Neuroblastoma Treatment Market – By Treatment (Market Size -$Million / $Billion)
9.1. Surgery
9.2. Chemotherapy
9.3. High-dose chemotherapy with stem cell support
9.4. Monoclonal antibody treatment
9.5. Radiotherapy
9.6. Others
10. Neuroblastoma Treatment - By Geography (Market Size -$Million / $Billion)
10.1. Neuroblastoma Treatment Market - North America Segment Research
10.2. North America Market Research (Million / $Billion)
10.2.1. Segment type Size and Market Size Analysis
10.2.2. Revenue and Trends
10.2.3. Application Revenue and Trends by type of Application
10.2.4. Company Revenue and Product Analysis
10.2.5. North America Product type and Application Market Size
10.2.5.1. U.S.
10.2.5.2. Canada
10.2.5.3. Mexico
10.2.5.4. Rest of North America
10.3. Neuroblastoma Treatment - South America Segment Research
10.4. South America Market Research (Market Size -$Million / $Billion)
10.4.1. Segment type Size and Market Size Analysis
10.4.2. Revenue and Trends
10.4.3. Application Revenue and Trends by type of Application
10.4.4. Company Revenue and Product Analysis
10.4.5. South America Product type and Application Market Size
10.4.5.1. Brazil
10.4.5.2. Venezuela
10.4.5.3. Argentina
10.4.5.4. Ecuador
10.4.5.5. Peru
10.4.5.6. Colombia
10.4.5.7. Costa Rica
10.4.5.8. Rest of South America
10.5. Neuroblastoma Treatment - Europe Segment Research
10.6. Europe Market Research (Market Size -$Million / $Billion)
10.6.1. Segment type Size and Market Size Analysis
10.6.2. Revenue and Trends
10.6.3. Application Revenue and Trends by type of Application
10.6.4. Company Revenue and Product Analysis
10.6.5. Europe Segment Product type and Application Market Size
10.6.5.1. U.K
10.6.5.2. Germany
10.6.5.3. Italy
10.6.5.4. France
10.6.5.5. Netherlands
10.6.5.6. Belgium
10.6.5.7. Spain
10.6.5.8. Denmark
10.6.5.9. Rest of Europe
10.7. Neuroblastoma Treatment – APAC Segment Research
10.8. APAC Market Research (Market Size -$Million / $Billion)
10.8.1. Segment type Size and Market Size Analysis
10.8.2. Revenue and Trends
10.8.3. Application Revenue and Trends by type of Application
10.8.4. Company Revenue and Product Analysis
10.8.5. APAC Segment – Product type and Application Market Size
10.8.5.1. China
10.8.5.2. Australia
10.8.5.3. Japan
10.8.5.4. South Korea
10.8.5.5. India
10.8.5.6. Taiwan
10.8.5.7. Malaysia
11. Neuroblastoma Treatment Market - Entropy
11.1. New product launches
11.2. M&A's, collaborations, JVs and partnerships
12. Neuroblastoma Treatment Market – Industry / Segment Competition landscape Premium
12.1. Market Share Analysis
12.1.1. Market Share by Country- Top companies
12.1.2. Market Share by Region- Top 10 companies
12.1.3. Market Share by type of Application – Top 10 companies
12.1.4. Market Share by type of Product / Product category- Top 10 companies
12.1.5. Market Share at global level- Top 10 companies
12.1.6. Best Practices for companies
13. Neuroblastoma Treatment Market – Key Company List by Country Premium
14. Neuroblastoma Treatment Market Company Analysis
14.1. Market Share, Company Revenue, Products, M&A, Developments
14.2. Cure Search
14.3. Texas Children’s
14.4. NANTGE Healthcare
14.5. Pfizer Inc.
14.6. GL Pharm Tech Corporation
14.7. Hôpitaux de ParisOthers
14.8. Erasmus Medical Center
14.9. Assistance Publique - Hopitaux de Paris
14.10. Texas Neurofibromatosis Foundation
14.11. Company 10
14.12. Company 11
14.13. Company 12 and more
"*Financials would be provided on a best efforts basis for private companies"
15. Neuroblastoma Treatment Market - Appendix
15.1. Abbreviations
15.2. Sources
16. Neuroblastoma Treatment Market - Methodology
16.1. Research Methodology
16.1.1. Company Expert Interviews
16.1.2. Industry Databases
16.1.3. Associations
16.1.4. Company News
16.1.5. Company Annual Reports
16.1.6. Application Trends
16.1.7. New Products and Product database
16.1.8. Company Transcripts
16.1.9. R&D Trends
16.1.10. Key Opinion Leaders Interviews
16.1.11. Supply and Demand Trends
List of Tables:
Table 1: Neuroblastoma Treatment Market Overview 2021-2026
Table 2: Neuroblastoma Treatment Market Leader Analysis 2018-2019 (US$)
Table 3: Neuroblastoma Treatment Market Product Analysis 2018-2019 (US$)
Table 4: Neuroblastoma Treatment Market End User Analysis 2018-2019 (US$)
Table 5: Neuroblastoma Treatment Market Patent Analysis 2013-2018* (US$)
Table 6: Neuroblastoma Treatment Market Financial Analysis 2018-2019 (US$)
Table 7: Neuroblastoma Treatment Market Driver Analysis 2018-2019 (US$)
Table 8: Neuroblastoma Treatment Market Challenges Analysis 2018-2019 (US$)
Table 9: Neuroblastoma Treatment Market Constraint Analysis 2018-2019 (US$)
Table 10: Neuroblastoma Treatment Market Supplier Bargaining Power Analysis 2018-2019 (US$)
Table 11: Neuroblastoma Treatment Market Buyer Bargaining Power Analysis 2018-2019 (US$)
Table 12: Neuroblastoma Treatment Market Threat of Substitutes Analysis 2018-2019 (US$)
Table 13: Neuroblastoma Treatment Market Threat of New Entrants Analysis 2018-2019 (US$)
Table 14: Neuroblastoma Treatment Market Degree of Competition Analysis 2018-2019 (US$)
Table 15: Neuroblastoma Treatment Market Value Chain Analysis 2018-2019 (US$)
Table 16: Neuroblastoma Treatment Market Pricing Analysis 2021-2026 (US$)
Table 17: Neuroblastoma Treatment Market Opportunities Analysis 2021-2026 (US$)
Table 18: Neuroblastoma Treatment Market Product Life Cycle Analysis 2021-2026 (US$)
Table 19: Neuroblastoma Treatment Market Supplier Analysis 2018-2019 (US$)
Table 20: Neuroblastoma Treatment Market Distributor Analysis 2018-2019 (US$)
Table 21: Neuroblastoma Treatment Market Trend Analysis 2018-2019 (US$)
Table 22: Neuroblastoma Treatment Market Size 2018 (US$)
Table 23: Neuroblastoma Treatment Market Forecast Analysis 2021-2026 (US$)
Table 24: Neuroblastoma Treatment Market Sales Forecast Analysis 2021-2026 (Units)
Table 25: Neuroblastoma Treatment Market, Revenue & Volume, By Drug, 2021-2026 ($)
Table 26: Neuroblastoma Treatment Market By Drug, Revenue & Volume, By Xalkori, 2021-2026 ($)
Table 27: Neuroblastoma Treatment Market By Drug, Revenue & Volume, By Adriamycin PFS, 2021-2026 ($)
Table 28: Neuroblastoma Treatment Market By Drug, Revenue & Volume, By Clafen, 2021-2026 ($)
Table 29: Neuroblastoma Treatment Market By Drug, Revenue & Volume, By Vincasar PFS, 2021-2026 ($)
Table 30: Neuroblastoma Treatment Market, Revenue & Volume, By Technology, 2021-2026 ($)
Table 31: Neuroblastoma Treatment Market By Technology, Revenue & Volume, By Surgery, 2021-2026 ($)
Table 32: Neuroblastoma Treatment Market By Technology, Revenue & Volume, By Chemotherapy, 2021-2026 ($)
Table 33: Neuroblastoma Treatment Market By Technology, Revenue & Volume, By High-dose chemotherapy with stem cell support, 2021-2026 ($)
Table 34: Neuroblastoma Treatment Market By Technology, Revenue & Volume, By Monoclonal antibody treatment, 2021-2026 ($)
Table 35: " Neuroblastoma Treatment Market By Technology, Revenue & Volume, By Radiotherapy, 2021-2026 ($)"
Table 36: North America Neuroblastoma Treatment Market, Revenue & Volume, By Drug, 2021-2026 ($)
Table 37: North America Neuroblastoma Treatment Market, Revenue & Volume, By Technology, 2021-2026 ($)
Table 38: South america Neuroblastoma Treatment Market, Revenue & Volume, By Drug, 2021-2026 ($)
Table 39: South america Neuroblastoma Treatment Market, Revenue & Volume, By Technology, 2021-2026 ($)
Table 40: Europe Neuroblastoma Treatment Market, Revenue & Volume, By Drug, 2021-2026 ($)
Table 41: Europe Neuroblastoma Treatment Market, Revenue & Volume, By Technology, 2021-2026 ($)
Table 42: APAC Neuroblastoma Treatment Market, Revenue & Volume, By Drug, 2021-2026 ($)
Table 43: APAC Neuroblastoma Treatment Market, Revenue & Volume, By Technology, 2021-2026 ($)
Table 44: Middle East & Africa Neuroblastoma Treatment Market, Revenue & Volume, By Drug, 2021-2026 ($)
Table 45: Middle East & Africa Neuroblastoma Treatment Market, Revenue & Volume, By Technology, 2021-2026 ($)
Table 46: Russia Neuroblastoma Treatment Market, Revenue & Volume, By Drug, 2021-2026 ($)
Table 47: Russia Neuroblastoma Treatment Market, Revenue & Volume, By Technology, 2021-2026 ($)
Table 48: Israel Neuroblastoma Treatment Market, Revenue & Volume, By Drug, 2021-2026 ($)
Table 49: Israel Neuroblastoma Treatment Market, Revenue & Volume, By Technology, 2021-2026 ($)
Table 50: Top Companies 2018 (US$) Neuroblastoma Treatment Market, Revenue & Volume
Table 51: Product Launch 2018-2019 Neuroblastoma Treatment Market, Revenue & Volume
Table 52: Mergers & Acquistions 2018-2019 Neuroblastoma Treatment Market, Revenue & Volume
List of Figures:
Figure 1: Overview of Neuroblastoma Treatment Market 2021-2026
Figure 2: Market Share Analysis for Neuroblastoma Treatment Market 2018 (US$)
Figure 3: Product Comparison in Neuroblastoma Treatment Market 2018-2019 (US$)
Figure 4: End User Profile for Neuroblastoma Treatment Market 2018-2019 (US$)
Figure 5: Patent Application and Grant in Neuroblastoma Treatment Market 2013-2018* (US$)
Figure 6: Top 5 Companies Financial Analysis in Neuroblastoma Treatment Market 2018-2019 (US$)
Figure 7: Market Entry Strategy in Neuroblastoma Treatment Market 2018-2019
Figure 8: Ecosystem Analysis in Neuroblastoma Treatment Market 2018
Figure 9: Average Selling Price in Neuroblastoma Treatment Market 2021-2026
Figure 10: Top Opportunites in Neuroblastoma Treatment Market 2018-2019
Figure 11: Market Life Cycle Analysis in Neuroblastoma Treatment Market
Figure 12: GlobalBy DrugNeuroblastoma Treatment Market Revenue, 2021-2026 ($)
Figure 13: GlobalBy TechnologyNeuroblastoma Treatment Market Revenue, 2021-2026 ($)
Figure 14: Global Neuroblastoma Treatment Market - By Geography
Figure 15: Global Neuroblastoma Treatment Market Value & Volume, By Geography, 2021-2026 ($)
Figure 16: Global Neuroblastoma Treatment Market CAGR, By Geography, 2021-2026 (%)
Figure 17: North America Neuroblastoma Treatment Market Value & Volume, 2021-2026 ($)
Figure 18: US Neuroblastoma Treatment Market Value & Volume, 2021-2026 ($)
Figure 19: US GDP and Population, 2018-2019 ($)
Figure 20: US GDP – Composition of 2018, By Sector of Origin
Figure 21: US Export and Import Value & Volume, 2018-2019 ($)
Figure 22: Canada Neuroblastoma Treatment Market Value & Volume, 2021-2026 ($)
Figure 23: Canada GDP and Population, 2018-2019 ($)
Figure 24: Canada GDP – Composition of 2018, By Sector of Origin
Figure 25: Canada Export and Import Value & Volume, 2018-2019 ($)
Figure 26: Mexico Neuroblastoma Treatment Market Value & Volume, 2021-2026 ($)
Figure 27: Mexico GDP and Population, 2018-2019 ($)
Figure 28: Mexico GDP – Composition of 2018, By Sector of Origin
Figure 29: Mexico Export and Import Value & Volume, 2018-2019 ($)
Figure 30: South America Neuroblastoma Treatment Market Value & Volume, 2021-2026 ($)
Figure 31: Brazil Neuroblastoma Treatment Market Value & Volume, 2021-2026 ($)
Figure 32: Brazil GDP and Population, 2018-2019 ($)
Figure 33: Brazil GDP – Composition of 2018, By Sector of Origin
Figure 34: Brazil Export and Import Value & Volume, 2018-2019 ($)
Figure 35: Venezuela Neuroblastoma Treatment Market Value & Volume, 2021-2026 ($)
Figure 36: Venezuela GDP and Population, 2018-2019 ($)
Figure 37: Venezuela GDP – Composition of 2018, By Sector of Origin
Figure 38: Venezuela Export and Import Value & Volume, 2018-2019 ($)
Figure 39: Argentina Neuroblastoma Treatment Market Value & Volume, 2021-2026 ($)
Figure 40: Argentina GDP and Population, 2018-2019 ($)
Figure 41: Argentina GDP – Composition of 2018, By Sector of Origin
Figure 42: Argentina Export and Import Value & Volume, 2018-2019 ($)
Figure 43: Ecuador Neuroblastoma Treatment Market Value & Volume, 2021-2026 ($)
Figure 44: Ecuador GDP and Population, 2018-2019 ($)
Figure 45: Ecuador GDP – Composition of 2018, By Sector of Origin
Figure 46: Ecuador Export and Import Value & Volume, 2018-2019 ($)
Figure 47: Peru Neuroblastoma Treatment Market Value & Volume, 2021-2026 ($)
Figure 48: Peru GDP and Population, 2018-2019 ($)
Figure 49: Peru GDP – Composition of 2018, By Sector of Origin
Figure 50: Peru Export and Import Value & Volume, 2018-2019 ($)
Figure 51: Colombia Neuroblastoma Treatment Market Value & Volume, 2021-2026 ($)
Figure 52: Colombia GDP and Population, 2018-2019 ($)
Figure 53: Colombia GDP – Composition of 2018, By Sector of Origin
Figure 54: Colombia Export and Import Value & Volume, 2018-2019 ($)
Figure 55: Costa Rica Neuroblastoma Treatment Market Value & Volume, 2021-2026 ($)
Figure 56: Costa Rica GDP and Population, 2018-2019 ($)
Figure 57: Costa Rica GDP – Composition of 2018, By Sector of Origin
Figure 58: Costa Rica Export and Import Value & Volume, 2018-2019 ($)
Figure 59: Europe Neuroblastoma Treatment Market Value & Volume, 2021-2026 ($)
Figure 60: U.K Neuroblastoma Treatment Market Value & Volume, 2021-2026 ($)
Figure 61: U.K GDP and Population, 2018-2019 ($)
Figure 62: U.K GDP – Composition of 2018, By Sector of Origin
Figure 63: U.K Export and Import Value & Volume, 2018-2019 ($)
Figure 64: Germany Neuroblastoma Treatment Market Value & Volume, 2021-2026 ($)
Figure 65: Germany GDP and Population, 2018-2019 ($)
Figure 66: Germany GDP – Composition of 2018, By Sector of Origin
Figure 67: Germany Export and Import Value & Volume, 2018-2019 ($)
Figure 68: Italy Neuroblastoma Treatment Market Value & Volume, 2021-2026 ($)
Figure 69: Italy GDP and Population, 2018-2019 ($)
Figure 70: Italy GDP – Composition of 2018, By Sector of Origin
Figure 71: Italy Export and Import Value & Volume, 2018-2019 ($)
Figure 72: France Neuroblastoma Treatment Market Value & Volume, 2021-2026 ($)
Figure 73: France GDP and Population, 2018-2019 ($)
Figure 74: France GDP – Composition of 2018, By Sector of Origin
Figure 75: France Export and Import Value & Volume, 2018-2019 ($)
Figure 76: Netherlands Neuroblastoma Treatment Market Value & Volume, 2021-2026 ($)
Figure 77: Netherlands GDP and Population, 2018-2019 ($)
Figure 78: Netherlands GDP – Composition of 2018, By Sector of Origin
Figure 79: Netherlands Export and Import Value & Volume, 2018-2019 ($)
Figure 80: Belgium Neuroblastoma Treatment Market Value & Volume, 2021-2026 ($)
Figure 81: Belgium GDP and Population, 2018-2019 ($)
Figure 82: Belgium GDP – Composition of 2018, By Sector of Origin
Figure 83: Belgium Export and Import Value & Volume, 2018-2019 ($)
Figure 84: Spain Neuroblastoma Treatment Market Value & Volume, 2021-2026 ($)
Figure 85: Spain GDP and Population, 2018-2019 ($)
Figure 86: Spain GDP – Composition of 2018, By Sector of Origin
Figure 87: Spain Export and Import Value & Volume, 2018-2019 ($)
Figure 88: Denmark Neuroblastoma Treatment Market Value & Volume, 2021-2026 ($)
Figure 89: Denmark GDP and Population, 2018-2019 ($)
Figure 90: Denmark GDP – Composition of 2018, By Sector of Origin
Figure 91: Denmark Export and Import Value & Volume, 2018-2019 ($)
Figure 92: APAC Neuroblastoma Treatment Market Value & Volume, 2021-2026 ($)
Figure 93: China Neuroblastoma Treatment Market Value & Volume, 2021-2026
Figure 94: China GDP and Population, 2018-2019 ($)
Figure 95: China GDP – Composition of 2018, By Sector of Origin
Figure 96: China Export and Import Value & Volume, 2018-2019 ($)Neuroblastoma Treatment Market China Export and Import Value & Volume, 2018-2019 ($)
Figure 97: Australia Neuroblastoma Treatment Market Value & Volume, 2021-2026 ($)
Figure 98: Australia GDP and Population, 2018-2019 ($)
Figure 99: Australia GDP – Composition of 2018, By Sector of Origin
Figure 100: Australia Export and Import Value & Volume, 2018-2019 ($)
Figure 101: South Korea Neuroblastoma Treatment Market Value & Volume, 2021-2026 ($)
Figure 102: South Korea GDP and Population, 2018-2019 ($)
Figure 103: South Korea GDP – Composition of 2018, By Sector of Origin
Figure 104: South Korea Export and Import Value & Volume, 2018-2019 ($)
Figure 105: India Neuroblastoma Treatment Market Value & Volume, 2021-2026 ($)
Figure 106: India GDP and Population, 2018-2019 ($)
Figure 107: India GDP – Composition of 2018, By Sector of Origin
Figure 108: India Export and Import Value & Volume, 2018-2019 ($)
Figure 109: Taiwan Neuroblastoma Treatment Market Value & Volume, 2021-2026 ($)
Figure 110: Taiwan GDP and Population, 2018-2019 ($)
Figure 111: Taiwan GDP – Composition of 2018, By Sector of Origin
Figure 112: Taiwan Export and Import Value & Volume, 2018-2019 ($)
Figure 113: Malaysia Neuroblastoma Treatment Market Value & Volume, 2021-2026 ($)
Figure 114: Malaysia GDP and Population, 2018-2019 ($)
Figure 115: Malaysia GDP – Composition of 2018, By Sector of Origin
Figure 116: Malaysia Export and Import Value & Volume, 2018-2019 ($)
Figure 117: Hong Kong Neuroblastoma Treatment Market Value & Volume, 2021-2026 ($)
Figure 118: Hong Kong GDP and Population, 2018-2019 ($)
Figure 119: Hong Kong GDP – Composition of 2018, By Sector of Origin
Figure 120: Hong Kong Export and Import Value & Volume, 2018-2019 ($)
Figure 121: Middle East & Africa Neuroblastoma Treatment Market Middle East & Africa 3D Printing Market Value & Volume, 2021-2026 ($)
Figure 122: Russia Neuroblastoma Treatment Market Value & Volume, 2021-2026 ($)
Figure 123: Russia GDP and Population, 2018-2019 ($)
Figure 124: Russia GDP – Composition of 2018, By Sector of Origin
Figure 125: Russia Export and Import Value & Volume, 2018-2019 ($)
Figure 126: Israel Neuroblastoma Treatment Market Value & Volume, 2021-2026 ($)
Figure 127: Israel GDP and Population, 2018-2019 ($)
Figure 128: Israel GDP – Composition of 2018, By Sector of Origin
Figure 129: Israel Export and Import Value & Volume, 2018-2019 ($)
Figure 130: Entropy Share, By Strategies, 2018-2019* (%)Neuroblastoma Treatment Market
Figure 131: Developments, 2018-2019*Neuroblastoma Treatment Market
Figure 132: Company 1 Neuroblastoma Treatment Market Net Revenue, By Years, 2018-2019* ($)
Figure 133: Company 1 Neuroblastoma Treatment Market Net Revenue Share, By Business segments, 2018 (%)
Figure 134: Company 1 Neuroblastoma Treatment Market Net Sales Share, By Geography, 2018 (%)
Figure 135: Company 2 Neuroblastoma Treatment Market Net Revenue, By Years, 2018-2019* ($)
Figure 136: Company 2 Neuroblastoma Treatment Market Net Revenue Share, By Business segments, 2018 (%)
Figure 137: Company 2 Neuroblastoma Treatment Market Net Sales Share, By Geography, 2018 (%)
Figure 138: Company 3 Neuroblastoma Treatment Market Net Revenue, By Years, 2018-2019* ($)
Figure 139: Company 3 Neuroblastoma Treatment Market Net Revenue Share, By Business segments, 2018 (%)
Figure 140: Company 3 Neuroblastoma Treatment Market Net Sales Share, By Geography, 2018 (%)
Figure 141: Company 4 Neuroblastoma Treatment Market Net Revenue, By Years, 2018-2019* ($)
Figure 142: Company 4 Neuroblastoma Treatment Market Net Revenue Share, By Business segments, 2018 (%)
Figure 143: Company 4 Neuroblastoma Treatment Market Net Sales Share, By Geography, 2018 (%)
Figure 144: Company 5 Neuroblastoma Treatment Market Net Revenue, By Years, 2018-2019* ($)
Figure 145: Company 5 Neuroblastoma Treatment Market Net Revenue Share, By Business segments, 2018 (%)
Figure 146: Company 5 Neuroblastoma Treatment Market Net Sales Share, By Geography, 2018 (%)
Figure 147: Company 6 Neuroblastoma Treatment Market Net Revenue, By Years, 2018-2019* ($)
Figure 148: Company 6 Neuroblastoma Treatment Market Net Revenue Share, By Business segments, 2018 (%)
Figure 149: Company 6 Neuroblastoma Treatment Market Net Sales Share, By Geography, 2018 (%)
Figure 150: Company 7 Neuroblastoma Treatment Market Net Revenue, By Years, 2018-2019* ($)
Figure 151: Company 7 Neuroblastoma Treatment Market Net Revenue Share, By Business segments, 2018 (%)
Figure 152: Company 7 Neuroblastoma Treatment Market Net Sales Share, By Geography, 2018 (%)
Figure 153: Company 8 Neuroblastoma Treatment Market Net Revenue, By Years, 2018-2019* ($)
Figure 154: Company 8 Neuroblastoma Treatment Market Net Revenue Share, By Business segments, 2018 (%)
Figure 155: Company 8 Neuroblastoma Treatment Market Net Sales Share, By Geography, 2018 (%)
Figure 156: Company 9 Neuroblastoma Treatment Market Net Revenue, By Years, 2018-2019* ($)
Figure 157: Company 9 Neuroblastoma Treatment Market Net Revenue Share, By Business segments, 2018 (%)
Figure 158: Company 9 Neuroblastoma Treatment Market Net Sales Share, By Geography, 2018 (%)
Figure 159: Company 10 Neuroblastoma Treatment Market Net Revenue, By Years, 2018-2019* ($)
Figure 160: Company 10 Neuroblastoma Treatment Market Net Revenue Share, By Business segments, 2018 (%)
Figure 161: Company 10 Neuroblastoma Treatment Market Net Sales Share, By Geography, 2018 (%)
Figure 162: Company 11 Neuroblastoma Treatment Market Net Revenue, By Years, 2018-2019* ($)
Figure 163: Company 11 Neuroblastoma Treatment Market Net Revenue Share, By Business segments, 2018 (%)
Figure 164: Company 11 Neuroblastoma Treatment Market Net Sales Share, By Geography, 2018 (%)
Figure 165: Company 12 Neuroblastoma Treatment Market Net Revenue, By Years, 2018-2019* ($)
Figure 166: Company 12 Neuroblastoma Treatment Market Net Revenue Share, By Business segments, 2018 (%)
Figure 167: Company 12 Neuroblastoma Treatment Market Net Sales Share, By Geography, 2018 (%)
Figure 168: Company 13 Neuroblastoma Treatment Market Net Revenue, By Years, 2018-2019* ($)
Figure 169: Company 13 Neuroblastoma Treatment Market Net Revenue Share, By Business segments, 2018 (%)
Figure 170: Company 13 Neuroblastoma Treatment Market Net Sales Share, By Geography, 2018 (%)
Figure 171: Company 14 Neuroblastoma Treatment Market Net Revenue, By Years, 2018-2019* ($)
Figure 172: Company 14 Neuroblastoma Treatment Market Net Revenue Share, By Business segments, 2018 (%)
Figure 173: Company 14 Neuroblastoma Treatment Market Net Sales Share, By Geography, 2018 (%)
Figure 174: Company 15 Neuroblastoma Treatment Market Net Revenue, By Years, 2018-2019* ($)
Figure 175: Company 15 Neuroblastoma Treatment Market Net Revenue Share, By Business segments, 2018 (%)
Figure 176: Company 15 Neuroblastoma Treatment Market Net Sales Share, By Geography, 2018 (%)