 Email
Email Print
Print


Myocardial Infarction Treatment Market - Forecast(2024 - 2030)
Myocardial Infarction Treatment Market Overview:
Myocardial Infarction Treatment surgeries are done to address the root cause of blockage of one of the coronary arteries, remove the blockage of arteries, and others. They are part of the minimally invasive surgeries for restoring the flow of blood to the other part of the arteries where the blood clot prevented the flow of oxygenated blood. Globally, increasing incidence of coronary artery disease and changes in lifestyle, an increasing number of smokers, increasing incidence of obesity and lack of exercise are the prime growth drivers of the global Myocardial Infarction Treatment market. In addition, increase in adoption of Myocardial Infarction Treatment in emerging economies such as China, India, and others, will create new opportunities for global Myocardial Infarction Treatment market. However, the higher cost of research and development, and limited R&D Activities are the key restraints for global Myocardial Infarction Treatment market.
Geographically North America dominated global Myocardial Infarction Treatment market, owing to expanding aging population and prevalence of co-morbidities. European is projected to have fastest growth, owing to rapidly increasing healthcare expenditure, modernization of healthcare infrastructure. Growing medical tourism industry in developing nations such as Japan, and India in this Asia Pacific is also driving the market in the region. Among all the distribution channel, hospitals has the highest market share in global Myocardial Infarction Treatment market.
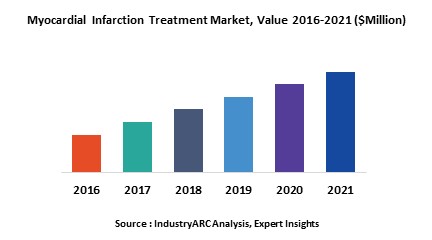
This report identifies the global Myocardial Infarction Treatment market size in for the year 2014-2016, and forecast of the same for year 2021. It also highlights the market drivers, restraints, growth indicators, challenges, and other key aspects with respect to global Myocardial Infarction Treatment market.
This report segments global Myocardial Infarction Treatment market on the basis of product type, distribution channel, and regional market as follows:
- Myocardial Infarction Treatment Market, By Type: Analgesics. Antiplatelet agents, and Others
- The report has focused study on Myocardial Infarction Treatment market by basis of end-user such as: Hospitals, Hospital Pharmacies, Drug Stores, and Others
- This report has been further segmented into major regions, which includes detailed analysis of each region such as: North America, Europe, Asia-Pacific (APAC), and Rest of the World (RoW) covering all the major country level markets in each of the region
This report identifies all the major companies operating in the Myocardial Infarction Treatment market. Some of the major companies’ profiles in detail are as follows:
- Novartis N.V
- Daiichi Sankyo Company Limited
- Bristol-Myers Squibb Company
- Boehringer Ingelheim GmbH
- AstraZeneca Terumo Interventional Systems Inc.
For more "Lifesciences and
Healthcare" related reports, please click here
1. Myocardial Infarction Treatment Market – Market Overview
2. Executive Summary
3. Market Landscape
3.1. Market Share Analysis
3.2. Comparative Analysis
3.3. Product Benchmarking
3.4. End User Profiling
3.5. Top 5 Financials Analysis
4. Myocardial Infarction Treatment Market– Market Forces
4.1. Drivers
4.1.1. Increasing incidence of coronary artery disease and changes in lifestyle
4.1.2. Increasing number of smokers, increasing incidence of obesity and lack of exercise
4.2. Restraints
4.2.1. Limited R&D activities
4.3. Opportunities
4.3.1. Emerging economies
4.4. Challenges
4.5. Porter’s Five Forces Analysis
4.5.1. Bargaining Power of Suppliers
4.5.2. Bargaining Power of Buyers
4.5.3. Threat of New Entrants
4.5.4. Threat of Substitutes
4.5.5. Degree of Competition
5. Myocardial Infarction Treatment Market– Strategic Analysis
5.1. Value Chain Analysis
5.2. Pricing Analysis
5.3. Opportunities Analysis
5.4. Product/Market Life Cycle Analysis
5.5. Suppliers and Distributors
6. Myocardial Infarction Treatment Market, By Product Type
6.1. Analgesics
6.2. Antiplatelet Agents
6.3. Vasodilators
6.4. Thrombolytics and anti-thrombotic agents
6.5. Glycoprotein IIb/IIIa inhibitors
6.6. B adrenergic blockers
6.7. Angiotensin receptor antagonists
6.8. Plaque Modification Device
6.9. Angiotensin converting enzyme inhibitors
7. Myocardial Infarction Treatment Market, By Distribution Channel
7.1. Hospitals
7.2. Hospital Pharmacies
7.3. Drug Stores
7.4. Online Drug Stores
8. Myocardial Infarction Treatment Market, By Geography
8.1. Europe
8.1.1. Germany
8.1.2. France
8.1.3. Italy
8.1.4. Spain
8.1.5. Russia
8.1.6. U.K.
8.1.7. Rest of Europe
8.2. Asia Pacific
8.2.1. China
8.2.2. India
8.2.3. Japan
8.2.4. South Korea
8.2.5. Rest of Asia-Pacific
8.3. North America
8.3.1. U.S.
8.3.2. Canada
8.3.3. Mexico
8.4. Rest of the World (RoW)
8.4.1. Brazil
8.4.2. Rest of RoW
9. Myocardial Infarction Treatment – Market Entropy
9.1. Expansion
9.2. Technological Developments
9.3. Merger & Acquisitions, and Joint Ventures
9.4. Supply- Contract
10. Company Profiles (Overview, Financials, SWOT Analysis, Developments, Product Portfolio)
10.1. Novartis N.V
10.2. Daiichi Sankyo Company Limited
10.3. Bristol-Myers Squibb Company
10.4. Boehringer Ingelheim GmbH
10.5. AstraZeneca
10.6. Apotex Inc
10.7. Sandoz
10.8. Par Pharmaceutical Companies, Inc
10.9. Mylan N.V
10.10. Pfizer Inc.
*More than 40 Companies are profiled in this Research Report, Complete List available on Request*
"*Financials would be provided on a best efforts basis for private companies"
11. Appendix
11.1. Abbreviations
11.2. Sources
11.3. Research Methodology
11.4. Bibliography
11.5. Compilation of Expert Insights
11.6. Disclaimer
List of Tables:
Table 1: Myocardial Infarction Treatment Market Overview 2021-2026
Table 2: Myocardial Infarction Treatment Market Leader Analysis 2018-2019 (US$)
Table 3: Myocardial Infarction Treatment Market Product Analysis 2018-2019 (US$)
Table 4: Myocardial Infarction Treatment Market End User Analysis 2018-2019 (US$)
Table 5: Myocardial Infarction Treatment Market Patent Analysis 2013-2018* (US$)
Table 6: Myocardial Infarction Treatment Market Financial Analysis 2018-2019 (US$)
Table 7: Myocardial Infarction Treatment Market Driver Analysis 2018-2019 (US$)
Table 8: Myocardial Infarction Treatment Market Challenges Analysis 2018-2019 (US$)
Table 9: Myocardial Infarction Treatment Market Constraint Analysis 2018-2019 (US$)
Table 10: Myocardial Infarction Treatment Market Supplier Bargaining Power Analysis 2018-2019 (US$)
Table 11: Myocardial Infarction Treatment Market Buyer Bargaining Power Analysis 2018-2019 (US$)
Table 12: Myocardial Infarction Treatment Market Threat of Substitutes Analysis 2018-2019 (US$)
Table 13: Myocardial Infarction Treatment Market Threat of New Entrants Analysis 2018-2019 (US$)
Table 14: Myocardial Infarction Treatment Market Degree of Competition Analysis 2018-2019 (US$)
Table 15: Myocardial Infarction Treatment Market Value Chain Analysis 2018-2019 (US$)
Table 16: Myocardial Infarction Treatment Market Pricing Analysis 2021-2026 (US$)
Table 17: Myocardial Infarction Treatment Market Opportunities Analysis 2021-2026 (US$)
Table 18: Myocardial Infarction Treatment Market Product Life Cycle Analysis 2021-2026 (US$)
Table 19: Myocardial Infarction Treatment Market Supplier Analysis 2018-2019 (US$)
Table 20: Myocardial Infarction Treatment Market Distributor Analysis 2018-2019 (US$)
Table 21: Myocardial Infarction Treatment Market Trend Analysis 2018-2019 (US$)
Table 22: Myocardial Infarction Treatment Market Size 2018 (US$)
Table 23: Myocardial Infarction Treatment Market Forecast Analysis 2021-2026 (US$)
Table 24: Myocardial Infarction Treatment Market Sales Forecast Analysis 2021-2026 (Units)
Table 25: Myocardial Infarction Treatment Market, Revenue & Volume,By Product Type, 2021-2026 ($)
Table 26: Myocardial Infarction Treatment Market By Product Type, Revenue & Volume,By Analgesics, 2021-2026 ($)
Table 27: Myocardial Infarction Treatment Market By Product Type, Revenue & Volume,By Antiplatelet Agents, 2021-2026 ($)
Table 28: Myocardial Infarction Treatment Market By Product Type, Revenue & Volume,By Vasodilators, 2021-2026 ($)
Table 29: Myocardial Infarction Treatment Market By Product Type, Revenue & Volume,By Thrombolytics and anti-thrombotic agents, 2021-2026 ($)
Table 30: Myocardial Infarction Treatment Market By Product Type, Revenue & Volume,By Glycoprotein IIb/IIIa inhibitors, 2021-2026 ($)
Table 31: Myocardial Infarction Treatment Market, Revenue & Volume,By Distribution Channel, 2021-2026 ($)
Table 32: Myocardial Infarction Treatment Market By Distribution Channel, Revenue & Volume,By Hospitals, 2021-2026 ($)
Table 33: Myocardial Infarction Treatment Market By Distribution Channel, Revenue & Volume,By Hospital Pharmacies, 2021-2026 ($)
Table 34: Myocardial Infarction Treatment Market By Distribution Channel, Revenue & Volume,By Drug Stores, 2021-2026 ($)
Table 35: Myocardial Infarction Treatment Market By Distribution Channel, Revenue & Volume,By Online Drug Stores, 2021-2026 ($)
Table 36: North America Myocardial Infarction Treatment Market, Revenue & Volume,By Product Type, 2021-2026 ($)
Table 37: North America Myocardial Infarction Treatment Market, Revenue & Volume,By Distribution Channel, 2021-2026 ($)
Table 38: South america Myocardial Infarction Treatment Market, Revenue & Volume,By Product Type, 2021-2026 ($)
Table 39: South america Myocardial Infarction Treatment Market, Revenue & Volume,By Distribution Channel, 2021-2026 ($)
Table 40: Europe Myocardial Infarction Treatment Market, Revenue & Volume,By Product Type, 2021-2026 ($)
Table 41: Europe Myocardial Infarction Treatment Market, Revenue & Volume,By Distribution Channel, 2021-2026 ($)
Table 42: APAC Myocardial Infarction Treatment Market, Revenue & Volume,By Product Type, 2021-2026 ($)
Table 43: APAC Myocardial Infarction Treatment Market, Revenue & Volume,By Distribution Channel, 2021-2026 ($)
Table 44: Middle East & Africa Myocardial Infarction Treatment Market, Revenue & Volume,By Product Type, 2021-2026 ($)
Table 45: Middle East & Africa Myocardial Infarction Treatment Market, Revenue & Volume,By Distribution Channel, 2021-2026 ($)
Table 46: Russia Myocardial Infarction Treatment Market, Revenue & Volume,By Product Type, 2021-2026 ($)
Table 47: Russia Myocardial Infarction Treatment Market, Revenue & Volume,By Distribution Channel, 2021-2026 ($)
Table 48: Israel Myocardial Infarction Treatment Market, Revenue & Volume,By Product Type, 2021-2026 ($)
Table 49: Israel Myocardial Infarction Treatment Market, Revenue & Volume,By Distribution Channel, 2021-2026 ($)
Table 50: Top Companies 2018 (US$)Myocardial Infarction Treatment Market, Revenue & Volume
Table 51: Product Launch 2018-2019Myocardial Infarction Treatment Market, Revenue & Volume
Table 52: Mergers & Acquistions 2018-2019Myocardial Infarction Treatment Market, Revenue & Volume
List of Figures:
Figure 1: Overview of Myocardial Infarction Treatment Market 2021-2026
Figure 2: Market Share Analysis for Myocardial Infarction Treatment Market 2018 (US$)
Figure 3: Product Comparison in Myocardial Infarction Treatment Market 2018-2019 (US$)
Figure 4: End User Profile for Myocardial Infarction Treatment Market 2018-2019 (US$)
Figure 5: Patent Application and Grant in Myocardial Infarction Treatment Market 2013-2018* (US$)
Figure 6: Top 5 Companies Financial Analysis in Myocardial Infarction Treatment Market 2018-2019 (US$)
Figure 7: Market Entry Strategy in Myocardial Infarction Treatment Market 2018-2019
Figure 8: Ecosystem Analysis in Myocardial Infarction Treatment Market 2018
Figure 9: Average Selling Price in Myocardial Infarction Treatment Market 2021-2026
Figure 10: Top Opportunites in Myocardial Infarction Treatment Market 2018-2019
Figure 11: Market Life Cycle Analysis in Myocardial Infarction Treatment Market
Figure 12: GlobalBy Product TypeMyocardial Infarction Treatment Market Revenue, 2021-2026 ($)
Figure 13: GlobalBy Distribution ChannelMyocardial Infarction Treatment Market Revenue, 2021-2026 ($)
Figure 14: Global Myocardial Infarction Treatment Market - By Geography
Figure 15: Global Myocardial Infarction Treatment Market Value & Volume, By Geography, 2021-2026 ($)Â
Figure 16: Global Myocardial Infarction Treatment Market CAGR, By Geography, 2021-2026 (%)
Figure 17: North America Myocardial Infarction Treatment Market Value & Volume, 2021-2026 ($)
Figure 18: US Myocardial Infarction Treatment Market Value & Volume, 2021-2026 ($)
Figure 19: US GDP and Population, 2018-2019 ($)
Figure 20: US GDP – Composition of 2018, By Sector of Origin
Figure 21: US Export and Import Value & Volume, 2018-2019 ($)
Figure 22: Canada Myocardial Infarction Treatment Market Value & Volume, 2021-2026 ($)
Figure 23: Canada GDP and Population, 2018-2019 ($)
Figure 24: Canada GDP – Composition of 2018, By Sector of Origin
Figure 25: Canada Export and Import Value & Volume, 2018-2019 ($)
Figure 26: Mexico Myocardial Infarction Treatment Market Value & Volume, 2021-2026 ($)
Figure 27: Mexico GDP and Population, 2018-2019 ($)
Figure 28: Mexico GDP – Composition of 2018, By Sector of Origin
Figure 29: Mexico Export and Import Value & Volume, 2018-2019 ($)
Figure 30: South America Myocardial Infarction Treatment Market Value & Volume, 2021-2026 ($)
Figure 31: Brazil Myocardial Infarction Treatment Market Value & Volume, 2021-2026 ($)
Figure 32: Brazil GDP and Population, 2018-2019 ($)
Figure 33: Brazil GDP – Composition of 2018, By Sector of Origin
Figure 34: Brazil Export and Import Value & Volume, 2018-2019 ($)
Figure 35: Venezuela Myocardial Infarction Treatment Market Value & Volume, 2021-2026 ($)
Figure 36: Venezuela GDP and Population, 2018-2019 ($)
Figure 37: Venezuela GDP – Composition of 2018, By Sector of Origin
Figure 38: Venezuela Export and Import Value & Volume, 2018-2019 ($)
Figure 39: Argentina Myocardial Infarction Treatment Market Value & Volume, 2021-2026 ($)
Figure 40: Argentina GDP and Population, 2018-2019 ($)
Figure 41: Argentina GDP – Composition of 2018, By Sector of Origin
Figure 42: Argentina Export and Import Value & Volume, 2018-2019 ($)
Figure 43: Ecuador Myocardial Infarction Treatment Market Value & Volume, 2021-2026 ($)
Figure 44: Ecuador GDP and Population, 2018-2019 ($)
Figure 45: Ecuador GDP – Composition of 2018, By Sector of Origin
Figure 46: Ecuador Export and Import Value & Volume, 2018-2019 ($)
Figure 47: Peru Myocardial Infarction Treatment Market Value & Volume, 2021-2026 ($)
Figure 48: Peru GDP and Population, 2018-2019 ($)
Figure 49: Peru GDP – Composition of 2018, By Sector of Origin
Figure 50: Peru Export and Import Value & Volume, 2018-2019 ($)
Figure 51: Colombia Myocardial Infarction Treatment Market Value & Volume, 2021-2026 ($)
Figure 52: Colombia GDP and Population, 2018-2019 ($)
Figure 53: Colombia GDP – Composition of 2018, By Sector of Origin
Figure 54: Colombia Export and Import Value & Volume, 2018-2019 ($)
Figure 55: Costa Rica Myocardial Infarction Treatment Market Value & Volume, 2021-2026 ($)
Figure 56: Costa Rica GDP and Population, 2018-2019 ($)
Figure 57: Costa Rica GDP – Composition of 2018, By Sector of Origin
Figure 58: Costa Rica Export and Import Value & Volume, 2018-2019 ($)
Figure 59: Europe Myocardial Infarction Treatment Market Value & Volume, 2021-2026 ($)
Figure 60: U.K Myocardial Infarction Treatment Market Value & Volume, 2021-2026 ($)
Figure 61: U.K GDP and Population, 2018-2019 ($)
Figure 62: U.K GDP – Composition of 2018, By Sector of Origin
Figure 63: U.K Export and Import Value & Volume, 2018-2019 ($)
Figure 64: Germany Myocardial Infarction Treatment Market Value & Volume, 2021-2026 ($)
Figure 65: Germany GDP and Population, 2018-2019 ($)
Figure 66: Germany GDP – Composition of 2018, By Sector of Origin
Figure 67: Germany Export and Import Value & Volume, 2018-2019 ($)
Figure 68: Italy Myocardial Infarction Treatment Market Value & Volume, 2021-2026 ($)
Figure 69: Italy GDP and Population, 2018-2019 ($)
Figure 70: Italy GDP – Composition of 2018, By Sector of Origin
Figure 71: Italy Export and Import Value & Volume, 2018-2019 ($)
Figure 72: France Myocardial Infarction Treatment Market Value & Volume, 2021-2026 ($)
Figure 73: France GDP and Population, 2018-2019 ($)
Figure 74: France GDP – Composition of 2018, By Sector of Origin
Figure 75: France Export and Import Value & Volume, 2018-2019 ($)
Figure 76: Netherlands Myocardial Infarction Treatment Market Value & Volume, 2021-2026 ($)
Figure 77: Netherlands GDP and Population, 2018-2019 ($)
Figure 78: Netherlands GDP – Composition of 2018, By Sector of Origin
Figure 79: Netherlands Export and Import Value & Volume, 2018-2019 ($)
Figure 80: Belgium Myocardial Infarction Treatment Market Value & Volume, 2021-2026 ($)
Figure 81: Belgium GDP and Population, 2018-2019 ($)
Figure 82: Belgium GDP – Composition of 2018, By Sector of Origin
Figure 83: Belgium Export and Import Value & Volume, 2018-2019 ($)
Figure 84: Spain Myocardial Infarction Treatment Market Value & Volume, 2021-2026 ($)
Figure 85: Spain GDP and Population, 2018-2019 ($)
Figure 86: Spain GDP – Composition of 2018, By Sector of Origin
Figure 87: Spain Export and Import Value & Volume, 2018-2019 ($)
Figure 88: Denmark Myocardial Infarction Treatment Market Value & Volume, 2021-2026 ($)
Figure 89: Denmark GDP and Population, 2018-2019 ($)
Figure 90: Denmark GDP – Composition of 2018, By Sector of Origin
Figure 91: Denmark Export and Import Value & Volume, 2018-2019 ($)
Figure 92: APAC Myocardial Infarction Treatment Market Value & Volume, 2021-2026 ($)
Figure 93: China Myocardial Infarction Treatment Market Value & Volume, 2021-2026
Figure 94: China GDP and Population, 2018-2019 ($)
Figure 95: China GDP – Composition of 2018, By Sector of Origin
Figure 96: China Export and Import Value & Volume, 2018-2019 ($)Myocardial Infarction Treatment Market China Export and Import Value & Volume, 2018-2019 ($)
Figure 97: Australia Myocardial Infarction Treatment Market Value & Volume, 2021-2026 ($)
Figure 98: Australia GDP and Population, 2018-2019 ($)
Figure 99: Australia GDP – Composition of 2018, By Sector of Origin
Figure 100: Australia Export and Import Value & Volume, 2018-2019 ($)
Figure 101: South Korea Myocardial Infarction Treatment Market Value & Volume, 2021-2026 ($)
Figure 102: South Korea GDP and Population, 2018-2019 ($)
Figure 103: South Korea GDP – Composition of 2018, By Sector of Origin
Figure 104: South Korea Export and Import Value & Volume, 2018-2019 ($)
Figure 105: India Myocardial Infarction Treatment Market Value & Volume, 2021-2026 ($)
Figure 106: India GDP and Population, 2018-2019 ($)
Figure 107: India GDP – Composition of 2018, By Sector of Origin
Figure 108: India Export and Import Value & Volume, 2018-2019 ($)
Figure 109: Taiwan Myocardial Infarction Treatment Market Value & Volume, 2021-2026 ($)
Figure 110: Taiwan GDP and Population, 2018-2019 ($)
Figure 111: Taiwan GDP – Composition of 2018, By Sector of Origin
Figure 112: Taiwan Export and Import Value & Volume, 2018-2019 ($)
Figure 113: Malaysia Myocardial Infarction Treatment Market Value & Volume, 2021-2026 ($)
Figure 114: Malaysia GDP and Population, 2018-2019 ($)
Figure 115: Malaysia GDP – Composition of 2018, By Sector of Origin
Figure 116: Malaysia Export and Import Value & Volume, 2018-2019 ($)
Figure 117: Hong Kong Myocardial Infarction Treatment Market Value & Volume, 2021-2026 ($)
Figure 118: Hong Kong GDP and Population, 2018-2019 ($)
Figure 119: Hong Kong GDP – Composition of 2018, By Sector of Origin
Figure 120: Hong Kong Export and Import Value & Volume, 2018-2019 ($)
Figure 121: Middle East & Africa Myocardial Infarction Treatment Market Middle East & Africa 3D Printing Market Value & Volume, 2021-2026 ($)
Figure 122: Russia Myocardial Infarction Treatment Market Value & Volume, 2021-2026 ($)
Figure 123: Russia GDP and Population, 2018-2019 ($)
Figure 124: Russia GDP – Composition of 2018, By Sector of Origin
Figure 125: Russia Export and Import Value & Volume, 2018-2019 ($)
Figure 126: Israel Myocardial Infarction Treatment Market Value & Volume, 2021-2026 ($)
Figure 127: Israel GDP and Population, 2018-2019 ($)
Figure 128: Israel GDP – Composition of 2018, By Sector of Origin
Figure 129: Israel Export and Import Value & Volume, 2018-2019 ($)
Figure 130: Entropy Share, By Strategies, 2018-2019* (%)Myocardial Infarction Treatment Market
Figure 131: Developments, 2018-2019*Myocardial Infarction Treatment Market
Figure 132: Company 1 Myocardial Infarction Treatment Market Net Revenue, By Years, 2018-2019* ($)
Figure 133: Company 1 Myocardial Infarction Treatment Market Net Revenue Share, By Business segments, 2018 (%)
Figure 134: Company 1 Myocardial Infarction Treatment Market Net Sales Share, By Geography, 2018 (%)
Figure 135: Company 2 Myocardial Infarction Treatment Market Net Revenue, By Years, 2018-2019* ($)
Figure 136: Company 2 Myocardial Infarction Treatment Market Net Revenue Share, By Business segments, 2018 (%)
Figure 137: Company 2 Myocardial Infarction Treatment Market Net Sales Share, By Geography, 2018 (%)
Figure 138: Company 3 Myocardial Infarction Treatment Market Net Revenue, By Years, 2018-2019* ($)
Figure 139: Company 3 Myocardial Infarction Treatment Market Net Revenue Share, By Business segments, 2018 (%)
Figure 140: Company 3 Myocardial Infarction Treatment Market Net Sales Share, By Geography, 2018 (%)
Figure 141: Company 4 Myocardial Infarction Treatment Market Net Revenue, By Years, 2018-2019* ($)
Figure 142: Company 4 Myocardial Infarction Treatment Market Net Revenue Share, By Business segments, 2018 (%)
Figure 143: Company 4 Myocardial Infarction Treatment Market Net Sales Share, By Geography, 2018 (%)
Figure 144: Company 5 Myocardial Infarction Treatment Market Net Revenue, By Years, 2018-2019* ($)
Figure 145: Company 5 Myocardial Infarction Treatment Market Net Revenue Share, By Business segments, 2018 (%)
Figure 146: Company 5 Myocardial Infarction Treatment Market Net Sales Share, By Geography, 2018 (%)
Figure 147: Company 6 Myocardial Infarction Treatment Market Net Revenue, By Years, 2018-2019* ($)
Figure 148: Company 6 Myocardial Infarction Treatment Market Net Revenue Share, By Business segments, 2018 (%)
Figure 149: Company 6 Myocardial Infarction Treatment Market Net Sales Share, By Geography, 2018 (%)
Figure 150: Company 7 Myocardial Infarction Treatment Market Net Revenue, By Years, 2018-2019* ($)
Figure 151: Company 7 Myocardial Infarction Treatment Market Net Revenue Share, By Business segments, 2018 (%)
Figure 152: Company 7 Myocardial Infarction Treatment Market Net Sales Share, By Geography, 2018 (%)
Figure 153: Company 8 Myocardial Infarction Treatment Market Net Revenue, By Years, 2018-2019* ($)
Figure 154: Company 8 Myocardial Infarction Treatment Market Net Revenue Share, By Business segments, 2018 (%)
Figure 155: Company 8 Myocardial Infarction Treatment Market Net Sales Share, By Geography, 2018 (%)
Figure 156: Company 9 Myocardial Infarction Treatment Market Net Revenue, By Years, 2018-2019* ($)
Figure 157: Company 9 Myocardial Infarction Treatment Market Net Revenue Share, By Business segments, 2018 (%)
Figure 158: Company 9 Myocardial Infarction Treatment Market Net Sales Share, By Geography, 2018 (%)
Figure 159: Company 10 Myocardial Infarction Treatment Market Net Revenue, By Years, 2018-2019* ($)
Figure 160: Company 10 Myocardial Infarction Treatment Market Net Revenue Share, By Business segments, 2018 (%)
Figure 161: Company 10 Myocardial Infarction Treatment Market Net Sales Share, By Geography, 2018 (%)
Figure 162: Company 11 Myocardial Infarction Treatment Market Net Revenue, By Years, 2018-2019* ($)
Figure 163: Company 11 Myocardial Infarction Treatment Market Net Revenue Share, By Business segments, 2018 (%)
Figure 164: Company 11 Myocardial Infarction Treatment Market Net Sales Share, By Geography, 2018 (%)
Figure 165: Company 12 Myocardial Infarction Treatment Market Net Revenue, By Years, 2018-2019* ($)
Figure 166: Company 12 Myocardial Infarction Treatment Market Net Revenue Share, By Business segments, 2018 (%)
Figure 167: Company 12 Myocardial Infarction Treatment Market Net Sales Share, By Geography, 2018 (%)
Figure 168: Company 13 Myocardial Infarction Treatment Market Net Revenue, By Years, 2018-2019* ($)
Figure 169: Company 13 Myocardial Infarction Treatment Market Net Revenue Share, By Business segments, 2018 (%)
Figure 170: Company 13 Myocardial Infarction Treatment Market Net Sales Share, By Geography, 2018 (%)
Figure 171: Company 14 Myocardial Infarction Treatment Market Net Revenue, By Years, 2018-2019* ($)
Figure 172: Company 14 Myocardial Infarction Treatment Market Net Revenue Share, By Business segments, 2018 (%)
Figure 173: Company 14 Myocardial Infarction Treatment Market Net Sales Share, By Geography, 2018 (%)
Figure 174: Company 15 Myocardial Infarction Treatment Market Net Revenue, By Years, 2018-2019* ($)
Figure 175: Company 15 Myocardial Infarction Treatment Market Net Revenue Share, By Business segments, 2018 (%)
Figure 176: Company 15 Myocardial Infarction Treatment Market Net Sales Share, By Geography, 2018 (%)