 Email
Email Print
Print


Organometallics Market - by Type (Organosilicon, Organoboron, Organogallaum, Organopalladium, Organolithium, Organoberyllium, Organomagnesium & Others), by Application (Organic Synthesis, Catalysis (Homogeneous Catalysis & Heterogeneous Catalysis), Metal Purification & Others), by End-use Industry (Healthcare & Pharmaceutical, Electrical & Electronics, Chemical, Textile, Metallurgy & Others), By Geography - Global Opportunity Analysis & Industry Forecast, 2022-2027
Organometallics Market Overview
The Organometallics market size is projected to reach US$4.3 billion by 2027, after growing at a CAGR of 5.3% during the forecast period 2022-2027. Organometallic compounds such as Gilman reagents and Grignard reagents are widely used in stoichiometric processes, as well as in the role of catalysts to increase the rates of reactions. Organometallics are widely employed as a catalyst in the chemical industry for the manufacturing of various chemicals like acetic acid, which is supporting the Organometallic industry's growth. The major factor driving the growth of the market is the increasing demand from the chemical industry, the flourishing metallurgy industry and growing applications in the textile industry. Several end-use industries in the Organometallics industry suffered negative effects as a result of the novel coronavirus pandemic. The production halt owing to enforced lockdown resulted in decreased supply, demand and consumption of Organometallics, which had a direct impact on the Organometallics market size in the year 2020.

Organometallics Market Report Coverage
The “Organometallics Market Report
– Forecast (2022-2027)” by IndustryARC, covers an in-depth analysis of the
following segments in the Organometallics industry.
Key Takeaways
- Asia-Pacific dominates the Organometallics market, owing to the increasing production and demand for chemical products in Asia-Pacific. This increase in production and demand can be attributed to the increasing urbanization, growing per capita income and population in APAC countries.
- Organometallics compounds such as Gilman reagents and Grignard reagents, widely used in stoichiometric processes are in high demand for use in metal-organic chemical vapor deposition and other thin-film applications due to the LED and solar cell industries' rapid growth and maturation, which is boosting the market.
- Acetic acid is primarily produced using organometallics as a catalyst. The demand for Organometallics will therefore probably increase in response to the increasing demand for acetic acid.
- Growing e-commerce is a key factor accelerating the market's expansion, increasing demand from numerous chemical companies for these compounds and rising demand for organometallics from the industry that synthesizes organic compounds. These are the main factors, among others, that are propelling the organometallics market.
- However, it is estimated that the availability of alternatives and variations in the cost of raw materials will impede market expansion.
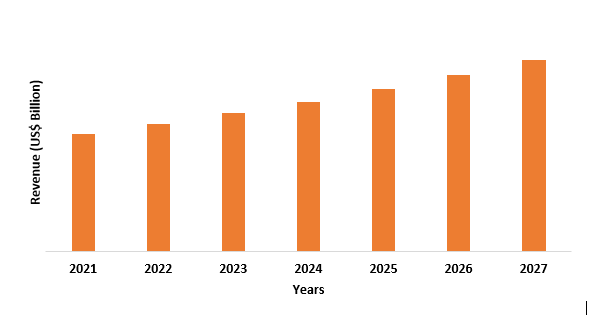
Figure: Asia-Pacific Organometallics Market Revenue, 2021-2027 (US$ Billion)
For More Details On this report - Request For Sample
Organometallics Market Segment Analysis – by Application
The catalysis segment held a significant share in the Organometallics
market share in 2021 and is forecasted to grow at a CAGR of 6.9% during the
forecast period 2022-2027. In industrial chemical reactions, homogeneous
catalysts are the main application of organometallic compounds. Organometallic compounds
such as Gilman reagents and Grignard reagents are widely used in
stoichiometric processes. Additionally, they serve as stoichiometric reagents
in chemical reactions that are both research- and industry-focused. Alkene
polymerization, hydroformylation, alkene oligomerization, methanol
carbonylation, hydrocarboxylation, hydrosilylation and hydrocyanation are a few
examples of important industrial processes. Excellent opportunities for organic
synthesis, particularly for the synthesis of fine chemicals, are provided by
organometallic catalysis. The organic chemistry of transition metals is
extremely diverse and they encourage a wide range of organic transformations,
including unusual ones. As a result, the demand for Organometallics in
catalysis is on a significant upsurge, thereby driving segmental growth.
Organometallics Market Segment Analysis – by End-use Industry
The chemical segment held a significant share in the Organometallics
market share in 2021 and is forecasted to grow at a CAGR of 7.1% during the
forecast period 2022-2027, owing to the growing demand for Organometallic
catalysis from the chemical industry. In the chemical industry,
organometallics are used as catalysts to speed up chemical reactions for
industrial-scale production of substances like carbon monoxide, acetic acid,
alkali-derived polymers, acetaldehydes, etc., that have a variety of uses in our
daily lives. Alcohol can also be produced using organometallic compounds by
adding them to ketone or aldehyde and then creating alcohol from them.
Moreover, The market under consideration is anticipated to be driven by the
increase in alcohol production for both industrial uses and beverages. The
global market for alcoholic beverages was estimated to be worth USD 1.58
trillion in 2020 by AF Press in collaboration with the Indian Council for
Research on International Economic Relations (ICRIER) and it is anticipated to
increase at a compound annual growth rate (CAGR) of about 3.5% between 2020 and
2023. According to the Chemical and Petrochemical Statistics at a Glance - 2020
Report published by the Department of Chemicals and Petrochemicals, the
production of acetic acid in India increased from 153.80 000'MT in 2018-2019 to
167.86 000'MT, after growing at a CAGR of 0.64%, thereby increasing the demand
for organometallics used to manufacture acetic acid. As a result of this aforementioned
expansion, the Organometallics market is also being propelled.
Organometallics Market Segment Analysis – by Geography
Asia-Pacific held a significant share in the Organometallics market share in 2021 up to 40%, owing to the bolstering growth of the chemical sector in APAC countries. For instance, the Asia-Pacific chemical industry is growing due to the development of new facilities, the surge in production and various public-private initiatives associated with the chemical industry in the region. For instance, the Indian chemicals market was worth US$ 178 billion in 2019 and is expected to grow at a 9.3% CAGR to US$304 billion by 2025. By 2025, the chemical market is expected to expand at a 9% annual rate. By 2025, India's chemical industry is intended to raise US$300 billion in revenue. According to the European Chemical Industry Council (cefic), China is developing its chemical industry to the next level, shifting from "following the lead" to "taking the lead," from a "big country" to a "great power" in the petroleum and chemical sector and dominating global markets while also setting the pace for technological innovation and trade. China is the world's largest producer of chemicals, accounting for 44.6% of global chemical sales in 2020 (up from 25.8% in 2010). According to the Singapore Economic Development Board (EDB), Singapore's energy and chemicals sectors are both among the top 10 globally and in 2019 Singapore was the eighth-largest exporter of chemicals (ranked by the World Trade Statistical Review 2020). And with the increasing chemical industry, it is anticipated that the demand for catalysis will significantly increase, which will accelerate the demand for Organometallics. As a result, the growing chemical industry in APAC will be a major driver of the Organometallics market growth over the forecast period.
Organometallics Market Drivers
Federal Government Initiatives Regarding Semiconductor:
Trimethyl aluminum, trimethyl antimony,
trimethylgallium and trimethylindium are used in the semiconductor fabrication
process, which bodes well for the organometallic compounds industry. The
federal government is launching several initiatives to increase semiconductor
production. For instance, in June 2021, the United States government took the
initiative to strengthen America's semiconductor supply chains by investing a
sizable amount of money in domestic chip manufacturing and innovation. The
United States Innovation and Competition Act (USICA), a comprehensive piece of
competitiveness legislation with US$52 billion in funding to support local chip
manufacturing, research and design, was passed by the US government. The
Japanese government had ambitious plans to support domestic semiconductor
companies' international growth and boost their yearly sales to more than
US$114 billion by 2030. Such government initiatives are ramping up the production
of semiconductors, thereby, propelling the demand for organometallics. Hence,
federal government initiatives regarding semiconductors are acting as a market
driver.
Bolstering Growth of the Pharmaceutical Industry:
The use of organometallic compounds has been widely adopted in the
development of antimalarial drugs as a result of the Plasmodium parasite's
resistance to conventional organic antimalarials. In various regions, there is
bolstering growth of the pharmaceutical industry. For instance, According to
Enterprise Ireland, the worth of the UK pharmaceuticals industry is projected
to increase 19.3 percent between 2018 and 2023, equating to 3.6 percent annual
growth. The European Federation of Pharmaceutical Industries and Associations
(EFPIA) estimates that total pharmaceutical production in Europe will reach
EURO 310,000 million (US$354,080.76 million) in 2020, representing a 5.7
percent increase. Total pharmaceutical sales in Canada increased by 35.3
percent to US$29.9 billion from 2011 to 2019, according to the 2019 PMPRB
Annual Report. According to the General Statistics Office of Vietnam, in 2019
the total pharmaceuticals production in Vietnam was US$3255.6 million and in
2020 it was US$3484.5 million, an increase of about 7.03%. According to the
International Trade Administration (ITA), the total local pharmaceutical
production in Japan increased from US$62,570 thousand in 2018 to US$87,027
thousand in 2019. According to the International Trade Administration, the
pharmaceuticals market in Vietnam is expected to grow by a 10% annual rate from
2017 to 2028, with revenues per capita virtually tripling in ten years from
2017 to 2027. With the increasing pharmaceutical industry, the demand for
pharmaceutical intermediate is increasing at a robust pace, thereby driving the
organometallics market.
Organometallics Market Challenges
Increasing Concerns Related to Organometallics:
Organometallic compounds can be found in the nearby environmental
compartments either as a result of extensive human activity or because they
already exist there naturally. The majority of organometallic compounds were
discovered in the environment to be persistent, difficult to decompose, easily
concentrated and extremely toxic - often more toxic than their elemental form.
Numerous public health and environmental protection agencies now demand
extensive research on the properties and pathways of transformation in
different environmental compartments, as well as their fate and interactions
between different environmental compartments (under different external and
internal conditions), since organometallic species of trace metals were found
to be frequently more concerning than their parent compounds. It is anticipated
that this increasing concern related to Organometallics will have an impact on its
demand, thereby negatively affecting the Organometallics market size during the
forecast period.
Organometallics Industry Outlook
Technology launches,
acquisitions and R&D activities are key strategies adopted by players in
the Organometallics market. The top 10 companies in the Organometallics market
are:
- Baoji Guokang Bio-Technology Co. Ltd.
- Matrix Guangzhou Chemicals Corp.
- American Elements
- Nouryon B.V.
- Vital Materials
- GFS Chemicals Inc.
- HOS-Technik GmBH
- Alfa Aesar
- FMC Corporation
- NOAH Technologies Corporation
Recent Developments
- In November 2020, A Life Sciences & Organic Chemistry Product Group was introduced by American Elements. This new division of more than 6,000 products is the result of the company's decades-long experience in bulk manufacturing organic & organometallic chemicals combined & expanded.
- In November 2019, to produce LED chips and broaden its product line for semiconductor applications, Vital Materials purchased the Gallium-based Organometallics division of Lanxess.
- In November 2019, Organotin catalysts, specialty and intermediate product lines and the global organometallic business of Lanxess were acquired by the European affiliate of PMC Group.
Relevant Reports
Report Code: CMR 0205
Report Code: CMR 45277
Report Code: CMR 39570
For more Chemicals and Materials Market reports, please click here
Table 1: Organometallics Market Overview 2021-2026
Table 2: Organometallics Market Leader Analysis 2018-2019 (US$)
Table 3: Organometallics Market Product Analysis 2018-2019 (US$)
Table 4: Organometallics Market End User Analysis 2018-2019 (US$)
Table 5: Organometallics Market Patent Analysis 2013-2018* (US$)
Table 6: Organometallics Market Financial Analysis 2018-2019 (US$)
Table 7: Organometallics Market Driver Analysis 2018-2019 (US$)
Table 8: Organometallics Market Challenges Analysis 2018-2019 (US$)
Table 9: Organometallics Market Constraint Analysis 2018-2019 (US$)
Table 10: Organometallics Market Supplier Bargaining Power Analysis 2018-2019 (US$)
Table 11: Organometallics Market Buyer Bargaining Power Analysis 2018-2019 (US$)
Table 12: Organometallics Market Threat of Substitutes Analysis 2018-2019 (US$)
Table 13: Organometallics Market Threat of New Entrants Analysis 2018-2019 (US$)
Table 14: Organometallics Market Degree of Competition Analysis 2018-2019 (US$)
Table 15: Organometallics Market Value Chain Analysis 2018-2019 (US$)
Table 16: Organometallics Market Pricing Analysis 2021-2026 (US$)
Table 17: Organometallics Market Opportunities Analysis 2021-2026 (US$)
Table 18: Organometallics Market Product Life Cycle Analysis 2021-2026 (US$)
Table 19: Organometallics Market Supplier Analysis 2018-2019 (US$)
Table 20: Organometallics Market Distributor Analysis 2018-2019 (US$)
Table 21: Organometallics Market Trend Analysis 2018-2019 (US$)
Table 22: Organometallics Market Size 2018 (US$)
Table 23: Organometallics Market Forecast Analysis 2021-2026 (US$)
Table 24: Organometallics Market Sales Forecast Analysis 2021-2026 (Units)
Table 25: Organometallics Market, Revenue & Volume, By Type, 2021-2026 ($)
Table 26: Organometallics Market By Type, Revenue & Volume, By Organotins, 2021-2026 ($)
Table 27: Organometallics Market By Type, Revenue & Volume, By Organoaluminums, 2021-2026 ($)
Table 28: Organometallics Market By Type, Revenue & Volume, By Organomagnesiums, 2021-2026 ($)
Table 29: Organometallics Market By Type, Revenue & Volume, By Organolithiums, 2021-2026 ($)
Table 30: Organometallics Market By Type, Revenue & Volume, By Oraganosodium, 2021-2026 ($)
Table 31: Organometallics Market, Revenue & Volume, By Application, 2021-2026 ($)
Table 32: Organometallics Market By Application, Revenue & Volume, By Deprotonation, 2021-2026 ($)
Table 33: Organometallics Market By Application, Revenue & Volume, By Directed ortho metalation, 2021-2026 ($)
Table 34: Organometallics Market By Application, Revenue & Volume, By Halogen-metal exchange, 2021-2026 ($)
Table 35: Organometallics Market By Application, Revenue & Volume, By Reduction, 2021-2026 ($)
Table 36: Organometallics Market, Revenue & Volume, By End Use Industry, 2021-2026 ($)
Table 37: Organometallics Market By End Use Industry, Revenue & Volume, By Polymers, 2021-2026 ($)
Table 38: Organometallics Market By End Use Industry, Revenue & Volume, By Synthetic Rubber, 2021-2026 ($)
Table 39: Organometallics Market By End Use Industry, Revenue & Volume, By Pharmaceuticals, 2021-2026 ($)
Table 40: Organometallics Market By End Use Industry, Revenue & Volume, By Electronics, 2021-2026 ($)
Table 41: Organometallics Market By End Use Industry, Revenue & Volume, By Flavors and fragrances, 2021-2026 ($)
Table 42: North America Organometallics Market, Revenue & Volume, By Type, 2021-2026 ($)
Table 43: North America Organometallics Market, Revenue & Volume, By Application, 2021-2026 ($)
Table 44: North America Organometallics Market, Revenue & Volume, By End Use Industry, 2021-2026 ($)
Table 45: South america Organometallics Market, Revenue & Volume, By Type, 2021-2026 ($)
Table 46: South america Organometallics Market, Revenue & Volume, By Application, 2021-2026 ($)
Table 47: South america Organometallics Market, Revenue & Volume, By End Use Industry, 2021-2026 ($)
Table 48: Europe Organometallics Market, Revenue & Volume, By Type, 2021-2026 ($)
Table 49: Europe Organometallics Market, Revenue & Volume, By Application, 2021-2026 ($)
Table 50: Europe Organometallics Market, Revenue & Volume, By End Use Industry, 2021-2026 ($)
Table 51: APAC Organometallics Market, Revenue & Volume, By Type, 2021-2026 ($)
Table 52: APAC Organometallics Market, Revenue & Volume, By Application, 2021-2026 ($)
Table 53: APAC Organometallics Market, Revenue & Volume, By End Use Industry, 2021-2026 ($)
Table 54: Middle East & Africa Organometallics Market, Revenue & Volume, By Type, 2021-2026 ($)
Table 55: Middle East & Africa Organometallics Market, Revenue & Volume, By Application, 2021-2026 ($)
Table 56: Middle East & Africa Organometallics Market, Revenue & Volume, By End Use Industry, 2021-2026 ($)
Table 57: Russia Organometallics Market, Revenue & Volume, By Type, 2021-2026 ($)
Table 58: Russia Organometallics Market, Revenue & Volume, By Application, 2021-2026 ($)
Table 59: Russia Organometallics Market, Revenue & Volume, By End Use Industry, 2021-2026 ($)
Table 60: Israel Organometallics Market, Revenue & Volume, By Type, 2021-2026 ($)
Table 61: Israel Organometallics Market, Revenue & Volume, By Application, 2021-2026 ($)
Table 62: Israel Organometallics Market, Revenue & Volume, By End Use Industry, 2021-2026 ($)
Table 63: Top Companies 2018 (US$)Organometallics Market, Revenue & Volume
Table 64: Product Launch 2018-2019Organometallics Market, Revenue & Volume
Table 65: Mergers & Acquistions 2018-2019Organometallics Market, Revenue & Volume
List of Figures:
Figure 1: Overview of Organometallics Market 2021-2026
Figure 2: Market Share Analysis for Organometallics Market 2018 (US$)
Figure 3: Product Comparison in Organometallics Market 2018-2019 (US$)
Figure 4: End User Profile for Organometallics Market 2018-2019 (US$)
Figure 5: Patent Application and Grant in Organometallics Market 2013-2018* (US$)
Figure 6: Top 5 Companies Financial Analysis in Organometallics Market 2018-2019 (US$)
Figure 7: Market Entry Strategy in Organometallics Market 2018-2019
Figure 8: Ecosystem Analysis in Organometallics Market 2018
Figure 9: Average Selling Price in Organometallics Market 2021-2026
Figure 10: Top Opportunites in Organometallics Market 2018-2019
Figure 11: Market Life Cycle Analysis in Organometallics Market
Figure 12: GlobalBy TypeOrganometallics Market Revenue, 2021-2026 ($)
Figure 13: GlobalBy ApplicationOrganometallics Market Revenue, 2021-2026 ($)
Figure 14: GlobalBy End Use IndustryOrganometallics Market Revenue, 2021-2026 ($)
Figure 15: Global Organometallics Market - By Geography
Figure 16: Global Organometallics Market Value & Volume, By Geography, 2021-2026 ($)
Figure 17: Global Organometallics Market CAGR, By Geography, 2021-2026 (%)
Figure 18: North America Organometallics Market Value & Volume, 2021-2026 ($)
Figure 19: US Organometallics Market Value & Volume, 2021-2026 ($)
Figure 20: US GDP and Population, 2018-2019 ($)
Figure 21: US GDP – Composition of 2018, By Sector of Origin
Figure 22: US Export and Import Value & Volume, 2018-2019 ($)
Figure 23: Canada Organometallics Market Value & Volume, 2021-2026 ($)
Figure 24: Canada GDP and Population, 2018-2019 ($)
Figure 25: Canada GDP – Composition of 2018, By Sector of Origin
Figure 26: Canada Export and Import Value & Volume, 2018-2019 ($)
Figure 27: Mexico Organometallics Market Value & Volume, 2021-2026 ($)
Figure 28: Mexico GDP and Population, 2018-2019 ($)
Figure 29: Mexico GDP – Composition of 2018, By Sector of Origin
Figure 30: Mexico Export and Import Value & Volume, 2018-2019 ($)
Figure 31: South America Organometallics Market Value & Volume, 2021-2026 ($)
Figure 32: Brazil Organometallics Market Value & Volume, 2021-2026 ($)
Figure 33: Brazil GDP and Population, 2018-2019 ($)
Figure 34: Brazil GDP – Composition of 2018, By Sector of Origin
Figure 35: Brazil Export and Import Value & Volume, 2018-2019 ($)
Figure 36: Venezuela Organometallics Market Value & Volume, 2021-2026 ($)
Figure 37: Venezuela GDP and Population, 2018-2019 ($)
Figure 38: Venezuela GDP – Composition of 2018, By Sector of Origin
Figure 39: Venezuela Export and Import Value & Volume, 2018-2019 ($)
Figure 40: Argentina Organometallics Market Value & Volume, 2021-2026 ($)
Figure 41: Argentina GDP and Population, 2018-2019 ($)
Figure 42: Argentina GDP – Composition of 2018, By Sector of Origin
Figure 43: Argentina Export and Import Value & Volume, 2018-2019 ($)
Figure 44: Ecuador Organometallics Market Value & Volume, 2021-2026 ($)
Figure 45: Ecuador GDP and Population, 2018-2019 ($)
Figure 46: Ecuador GDP – Composition of 2018, By Sector of Origin
Figure 47: Ecuador Export and Import Value & Volume, 2018-2019 ($)
Figure 48: Peru Organometallics Market Value & Volume, 2021-2026 ($)
Figure 49: Peru GDP and Population, 2018-2019 ($)
Figure 50: Peru GDP – Composition of 2018, By Sector of Origin
Figure 51: Peru Export and Import Value & Volume, 2018-2019 ($)
Figure 52: Colombia Organometallics Market Value & Volume, 2021-2026 ($)
Figure 53: Colombia GDP and Population, 2018-2019 ($)
Figure 54: Colombia GDP – Composition of 2018, By Sector of Origin
Figure 55: Colombia Export and Import Value & Volume, 2018-2019 ($)
Figure 56: Costa Rica Organometallics Market Value & Volume, 2021-2026 ($)
Figure 57: Costa Rica GDP and Population, 2018-2019 ($)
Figure 58: Costa Rica GDP – Composition of 2018, By Sector of Origin
Figure 59: Costa Rica Export and Import Value & Volume, 2018-2019 ($)
Figure 60: Europe Organometallics Market Value & Volume, 2021-2026 ($)
Figure 61: U.K Organometallics Market Value & Volume, 2021-2026 ($)
Figure 62: U.K GDP and Population, 2018-2019 ($)
Figure 63: U.K GDP – Composition of 2018, By Sector of Origin
Figure 64: U.K Export and Import Value & Volume, 2018-2019 ($)
Figure 65: Germany Organometallics Market Value & Volume, 2021-2026 ($)
Figure 66: Germany GDP and Population, 2018-2019 ($)
Figure 67: Germany GDP – Composition of 2018, By Sector of Origin
Figure 68: Germany Export and Import Value & Volume, 2018-2019 ($)
Figure 69: Italy Organometallics Market Value & Volume, 2021-2026 ($)
Figure 70: Italy GDP and Population, 2018-2019 ($)
Figure 71: Italy GDP – Composition of 2018, By Sector of Origin
Figure 72: Italy Export and Import Value & Volume, 2018-2019 ($)
Figure 73: France Organometallics Market Value & Volume, 2021-2026 ($)
Figure 74: France GDP and Population, 2018-2019 ($)
Figure 75: France GDP – Composition of 2018, By Sector of Origin
Figure 76: France Export and Import Value & Volume, 2018-2019 ($)
Figure 77: Netherlands Organometallics Market Value & Volume, 2021-2026 ($)
Figure 78: Netherlands GDP and Population, 2018-2019 ($)
Figure 79: Netherlands GDP – Composition of 2018, By Sector of Origin
Figure 80: Netherlands Export and Import Value & Volume, 2018-2019 ($)
Figure 81: Belgium Organometallics Market Value & Volume, 2021-2026 ($)
Figure 82: Belgium GDP and Population, 2018-2019 ($)
Figure 83: Belgium GDP – Composition of 2018, By Sector of Origin
Figure 84: Belgium Export and Import Value & Volume, 2018-2019 ($)
Figure 85: Spain Organometallics Market Value & Volume, 2021-2026 ($)
Figure 86: Spain GDP and Population, 2018-2019 ($)
Figure 87: Spain GDP – Composition of 2018, By Sector of Origin
Figure 88: Spain Export and Import Value & Volume, 2018-2019 ($)
Figure 89: Denmark Organometallics Market Value & Volume, 2021-2026 ($)
Figure 90: Denmark GDP and Population, 2018-2019 ($)
Figure 91: Denmark GDP – Composition of 2018, By Sector of Origin
Figure 92: Denmark Export and Import Value & Volume, 2018-2019 ($)
Figure 93: APAC Organometallics Market Value & Volume, 2021-2026 ($)
Figure 94: China Organometallics Market Value & Volume, 2021-2026
Figure 95: China GDP and Population, 2018-2019 ($)
Figure 96: China GDP – Composition of 2018, By Sector of Origin
Figure 97: China Export and Import Value & Volume, 2018-2019 ($)Organometallics Market China Export and Import Value & Volume, 2018-2019 ($)
Figure 98: Australia Organometallics Market Value & Volume, 2021-2026 ($)
Figure 99: Australia GDP and Population, 2018-2019 ($)
Figure 100: Australia GDP – Composition of 2018, By Sector of Origin
Figure 101: Australia Export and Import Value & Volume, 2018-2019 ($)
Figure 102: South Korea Organometallics Market Value & Volume, 2021-2026 ($)
Figure 103: South Korea GDP and Population, 2018-2019 ($)
Figure 104: South Korea GDP – Composition of 2018, By Sector of Origin
Figure 105: South Korea Export and Import Value & Volume, 2018-2019 ($)
Figure 106: India Organometallics Market Value & Volume, 2021-2026 ($)
Figure 107: India GDP and Population, 2018-2019 ($)
Figure 108: India GDP – Composition of 2018, By Sector of Origin
Figure 109: India Export and Import Value & Volume, 2018-2019 ($)
Figure 110: Taiwan Organometallics Market Value & Volume, 2021-2026 ($)
Figure 111: Taiwan GDP and Population, 2018-2019 ($)
Figure 112: Taiwan GDP – Composition of 2018, By Sector of Origin
Figure 113: Taiwan Export and Import Value & Volume, 2018-2019 ($)
Figure 114: Malaysia Organometallics Market Value & Volume, 2021-2026 ($)
Figure 115: Malaysia GDP and Population, 2018-2019 ($)
Figure 116: Malaysia GDP – Composition of 2018, By Sector of Origin
Figure 117: Malaysia Export and Import Value & Volume, 2018-2019 ($)
Figure 118: Hong Kong Organometallics Market Value & Volume, 2021-2026 ($)
Figure 119: Hong Kong GDP and Population, 2018-2019 ($)
Figure 120: Hong Kong GDP – Composition of 2018, By Sector of Origin
Figure 121: Hong Kong Export and Import Value & Volume, 2018-2019 ($)
Figure 122: Middle East & Africa Organometallics Market Middle East & Africa 3D Printing Market Value & Volume, 2021-2026 ($)
Figure 123: Russia Organometallics Market Value & Volume, 2021-2026 ($)
Figure 124: Russia GDP and Population, 2018-2019 ($)
Figure 125: Russia GDP – Composition of 2018, By Sector of Origin
Figure 126: Russia Export and Import Value & Volume, 2018-2019 ($)
Figure 127: Israel Organometallics Market Value & Volume, 2021-2026 ($)
Figure 128: Israel GDP and Population, 2018-2019 ($)
Figure 129: Israel GDP – Composition of 2018, By Sector of Origin
Figure 130: Israel Export and Import Value & Volume, 2018-2019 ($)
Figure 131: Entropy Share, By Strategies, 2018-2019* (%)Organometallics Market
Figure 132: Developments, 2018-2019*Organometallics Market
Figure 133: Company 1 Organometallics Market Net Revenue, By Years, 2018-2019* ($)
Figure 134: Company 1 Organometallics Market Net Revenue Share, By Business segments, 2018 (%)
Figure 135: Company 1 Organometallics Market Net Sales Share, By Geography, 2018 (%)
Figure 136: Company 2 Organometallics Market Net Revenue, By Years, 2018-2019* ($)
Figure 137: Company 2 Organometallics Market Net Revenue Share, By Business segments, 2018 (%)
Figure 138: Company 2 Organometallics Market Net Sales Share, By Geography, 2018 (%)
Figure 139: Company 3 Organometallics Market Net Revenue, By Years, 2018-2019* ($)
Figure 140: Company 3 Organometallics Market Net Revenue Share, By Business segments, 2018 (%)
Figure 141: Company 3 Organometallics Market Net Sales Share, By Geography, 2018 (%)
Figure 142: Company 4 Organometallics Market Net Revenue, By Years, 2018-2019* ($)
Figure 143: Company 4 Organometallics Market Net Revenue Share, By Business segments, 2018 (%)
Figure 144: Company 4 Organometallics Market Net Sales Share, By Geography, 2018 (%)
Figure 145: Company 5 Organometallics Market Net Revenue, By Years, 2018-2019* ($)
Figure 146: Company 5 Organometallics Market Net Revenue Share, By Business segments, 2018 (%)
Figure 147: Company 5 Organometallics Market Net Sales Share, By Geography, 2018 (%)
Figure 148: Company 6 Organometallics Market Net Revenue, By Years, 2018-2019* ($)
Figure 149: Company 6 Organometallics Market Net Revenue Share, By Business segments, 2018 (%)
Figure 150: Company 6 Organometallics Market Net Sales Share, By Geography, 2018 (%)
Figure 151: Company 7 Organometallics Market Net Revenue, By Years, 2018-2019* ($)
Figure 152: Company 7 Organometallics Market Net Revenue Share, By Business segments, 2018 (%)
Figure 153: Company 7 Organometallics Market Net Sales Share, By Geography, 2018 (%)
Figure 154: Company 8 Organometallics Market Net Revenue, By Years, 2018-2019* ($)
Figure 155: Company 8 Organometallics Market Net Revenue Share, By Business segments, 2018 (%)
Figure 156: Company 8 Organometallics Market Net Sales Share, By Geography, 2018 (%)
Figure 157: Company 9 Organometallics Market Net Revenue, By Years, 2018-2019* ($)
Figure 158: Company 9 Organometallics Market Net Revenue Share, By Business segments, 2018 (%)
Figure 159: Company 9 Organometallics Market Net Sales Share, By Geography, 2018 (%)
Figure 160: Company 10 Organometallics Market Net Revenue, By Years, 2018-2019* ($)
Figure 161: Company 10 Organometallics Market Net Revenue Share, By Business segments, 2018 (%)
Figure 162: Company 10 Organometallics Market Net Sales Share, By Geography, 2018 (%)
Figure 163: Company 11 Organometallics Market Net Revenue, By Years, 2018-2019* ($)
Figure 164: Company 11 Organometallics Market Net Revenue Share, By Business segments, 2018 (%)
Figure 165: Company 11 Organometallics Market Net Sales Share, By Geography, 2018 (%)
Figure 166: Company 12 Organometallics Market Net Revenue, By Years, 2018-2019* ($)
Figure 167: Company 12 Organometallics Market Net Revenue Share, By Business segments, 2018 (%)
Figure 168: Company 12 Organometallics Market Net Sales Share, By Geography, 2018 (%)
Figure 169: Company 13 Organometallics Market Net Revenue, By Years, 2018-2019* ($)
Figure 170: Company 13 Organometallics Market Net Revenue Share, By Business segments, 2018 (%)
Figure 171: Company 13 Organometallics Market Net Sales Share, By Geography, 2018 (%)
Figure 172: Company 14 Organometallics Market Net Revenue, By Years, 2018-2019* ($)
Figure 173: Company 14 Organometallics Market Net Revenue Share, By Business segments, 2018 (%)
Figure 174: Company 14 Organometallics Market Net Sales Share, By Geography, 2018 (%)
Figure 175: Company 15 Organometallics Market Net Revenue, By Years, 2018-2019* ($)
Figure 176: Company 15 Organometallics Market Net Revenue Share, By Business segments, 2018 (%)
Figure 177: Company 15 Organometallics Market Net Sales Share, By Geography, 2018 (%)