 Email
Email Print
Print


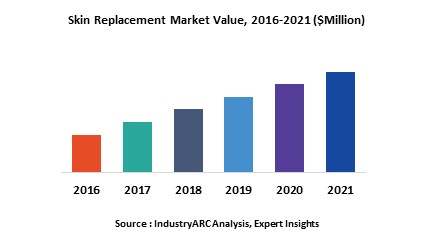
Skin is the largest organ in human body which is highly dynamic in nature. With the outer layer of skin called epidermis and the inner layer called dermis. Skin is a network of nerves, blood vessels and cells thus acting as protective armour for the vital and critical human organs. It serves the body in diverse ways and one of the major functions is its protective functionality. The skin’s protective function creates a barrier for internal organs and tissues from toxins, disease-carrying microbes, heat and cold and other dangers present in the environment. Skin also plays a significant role in regulating the body temperature and preserving body’s fluid balance. Nerves within skin sense the presence of potentially harmful agents, such as bees, and immune cells in the skin help to fight against these malicious agents. Globally increasing life expectancy rate along with advancement in the skin replacement technology and increasing spending on healthcare is expected to be the key growth driver for the skin replacement market during the period of study.
Geographically North America dominated skin replacement market driven by best in the class healthcare infrastructure, advanced facilities, higher awareness, higher technological penetration and higher spending by the citizens towards healthcare expenditure. North America was followed by Europe and Asia-Pacific as second and third largest market for skin replacement market. Asia Pacific is projected to have fastest growth, owing to rapidly increasing healthcare infrastructure, increased spending, government initiatives and increasing awareness amongst population, and growing medical tourism industry in developing nations such as China, and India in this region.
This report identifies the global skin replacement market size in for the year 2014-2016, and forecast of the same for year 2021. It also highlights the market drivers, restraints, growth indicators, challenges, and other key aspects with respect to global skin replacement market.
This report segments global skin replacement market on the basis of product type, material, end-use industry and regional market as follows:
This report identifies all the major companies operating in the skin replacement market. Some of the major companies’ profiles in detail are as follows:
Geographically North America dominated skin replacement market driven by best in the class healthcare infrastructure, advanced facilities, higher awareness, higher technological penetration and higher spending by the citizens towards healthcare expenditure. North America was followed by Europe and Asia-Pacific as second and third largest market for skin replacement market. Asia Pacific is projected to have fastest growth, owing to rapidly increasing healthcare infrastructure, increased spending, government initiatives and increasing awareness amongst population, and growing medical tourism industry in developing nations such as China, and India in this region.
This report identifies the global skin replacement market size in for the year 2014-2016, and forecast of the same for year 2021. It also highlights the market drivers, restraints, growth indicators, challenges, and other key aspects with respect to global skin replacement market.
This report segments global skin replacement market on the basis of product type, material, end-use industry and regional market as follows:
- Skin Replacement Market research report is classified on the basis of product type. Some of the major product types covered are as follows: Epicel and Integra
- Skin Replacement market research report is classified on the basis of material. Some of the major material types covered in this report are as follows: Spider Silk, and Collagen
- Skin Replacement market research report is classified on the basis of end-user. Some of the major end-users covered in this report are as follows: Chemical, Cosmetics, and Pharmaceuticals
- This report has been further segmented into major regions, which includes detailed analysis of each region such as: North America, Europe, Asia-Pacific (APAC), and Rest of the World (RoW) covering all the major country level markets in each of the region
This report identifies all the major companies operating in the skin replacement market. Some of the major companies’ profiles in detail are as follows:
- Cellular Dynamics International
- Cynata Therapeutics Limited
- Platelet BioGenesis
- Tengion
- TissueGene, Inc
1. Skin Replacement Market - Overview
1.1. Definitions and Scope
2. Skin Replacement Market - Executive summary
2.1. Market Revenue, Market Size and Key Trends by Company
2.2. Key Trends by type of Application
2.3. Key Trends segmented by Geography
3. Skin Replacement Market
3.1. Comparative analysis
3.1.1. Product Benchmarking - Top 10 companies
3.1.2. Top 5 Financials Analysis
3.1.3. Market Value split by Top 10 companies
3.1.4. Patent Analysis - Top 10 companies
3.1.5. Pricing Analysis
4. Skin Replacement Market – Startup companies Scenario Premium
4.1. Top 10 startup company Analysis by
4.1.1. Investment
4.1.2. Revenue
4.1.3. Market Shares
4.1.4. Market Size and Application Analysis
4.1.5. Venture Capital and Funding Scenario
5. Skin Replacement Market – Industry Market Entry Scenario Premium
5.1. Regulatory Framework Overview
5.2. New Business and Ease of Doing business index
5.3. Case studies of successful ventures
5.4. Customer Analysis – Top 10 companies
6. Skin Replacement Market Forces
6.1. Drivers
6.2. Constraints
6.3. Challenges
6.4. Porters five force model
6.4.1. Bargaining power of suppliers
6.4.2. Bargaining powers of customers
6.4.3. Threat of new entrants
6.4.4. Rivalry among existing players
6.4.5. Threat of substitutes
7. Skin Replacement Market -Strategic analysis
7.1. Value chain analysis
7.2. Opportunities analysis
7.3. Product life cycle
7.4. Suppliers and distributors Market Share
8. Skin Replacement Market – By Product (Market Size -$Million / $Billion)
8.1. Market Size and Market Share Analysis
8.2. Application Revenue and Trend Research
8.3. Product Segment Analysis
8.3.1. Epicel
8.3.2. Integra
9. Skin Replacement Market – By Material (Market Size -$Million / $Billion)
9.1. Spider Silk
9.2. Collagen
10. Skin Replacement Market – By Material (Market Size -$Million / $Billion)
10.1. Chemicals
10.2. Cosmetics
10.3. Pharmaceuticals
11. Skin Replacement - By Geography (Market Size -$Million / $Billion)
11.1. Skin Replacement Market - North America Segment Research
11.2. North America Market Research (Million / $Billion)
11.2.1. Segment type Size and Market Size Analysis
11.2.2. Revenue and Trends
11.2.3. Application Revenue and Trends by type of Application
11.2.4. Company Revenue and Product Analysis
11.2.5. North America Product type and Application Market Size
11.2.5.1. U.S.
11.2.5.2. Canada
11.2.5.3. Mexico
11.2.5.4. Rest of North America
11.3. Skin Replacement - South America Segment Research
11.4. South America Market Research (Market Size -$Million / $Billion)
11.4.1. Segment type Size and Market Size Analysis
11.4.2. Revenue and Trends
11.4.3. Application Revenue and Trends by type of Application
11.4.4. Company Revenue and Product Analysis
11.4.5. South America Product type and Application Market Size
11.4.5.1. Brazil
11.4.5.2. Venezuela
11.4.5.3. Argentina
11.4.5.4. Ecuador
11.4.5.5. Peru
11.4.5.6. Colombia
11.4.5.7. Costa Rica
11.4.5.8. Rest of South America
11.5. Skin Replacement - Europe Segment Research
11.6. Europe Market Research (Market Size -$Million / $Billion)
11.6.1. Segment type Size and Market Size Analysis
11.6.2. Revenue and Trends
11.6.3. Application Revenue and Trends by type of Application
11.6.4. Company Revenue and Product Analysis
11.6.5. Europe Segment Product type and Application Market Size
11.6.5.1. U.K
11.6.5.2. Germany
11.6.5.3. Italy
11.6.5.4. France
11.6.5.5. Netherlands
11.6.5.6. Belgium
11.6.5.7. Spain
11.6.5.8. Denmark
11.6.5.9. Rest of Europe
11.7. Skin Replacement – APAC Segment Research
11.8. APAC Market Research (Market Size -$Million / $Billion)
11.8.1. Segment type Size and Market Size Analysis
11.8.2. Revenue and Trends
11.8.3. Application Revenue and Trends by type of Application
11.8.4. Company Revenue and Product Analysis
11.8.5. APAC Segment – Product type and Application Market Size
11.8.5.1. China
11.8.5.2. Australia
11.8.5.3. Japan
11.8.5.4. South Korea
11.8.5.5. India
11.8.5.6. Taiwan
11.8.5.7. Malaysia
12. Skin Replacement Market - Entropy
12.1. New product launches
12.2. M&A's, collaborations, JVs and partnerships
13. Skin Replacement Market – Industry / Segment Competition landscape Premium
13.1. Market Share Analysis
13.1.1. Market Share by Country- Top companies
13.1.2. Market Share by Region- Top 10 companies
13.1.3. Market Share by type of Application – Top 10 companies
13.1.4. Market Share by type of Product / Product category- Top 10 companies
13.1.5. Market Share at global level- Top 10 companies
13.1.6. Best Practises for companies
14. Skin Replacement Market – Key Company List by Country Premium
15. Skin Replacement Market Company Analysis
15.1. Market Share, Company Revenue, Products, M&A, Developments
15.2. Cellular Dynamics International
15.3. Cynata Therapeutics Limited
15.4. Platelet BioGenesis
15.5. Tengion
15.6. TissueGene, Inc
15.7. Stratatech Corporation
15.8. Victor Company
15.9. Integra
15.10. Company 9
15.11. Company 10 and More
"*Financials would be provided on a best efforts basis for private companies"
16. Skin Replacement Market -Appendix
16.1. Abbreviations
16.2. Sources
17. Skin Replacement Market -Methodology Premium
17.1. Research Methodology
17.1.1. Company Expert Interviews
17.1.2. Industry Databases
17.1.3. Associations
17.1.4. Company News
17.1.5. Company Annual Reports
17.1.6. Application Trends
17.1.7. New Products and Product database
17.1.8. Company Transcripts
17.1.9. R&D Trends
17.1.10. Key Opinion Leaders Interviews
17.1.11. Supply and Demand Trends
List of Tables:
Table 1: Mosquito Repeller Market Overview 2021-2026
Table 2: Mosquito Repeller Market Leader Analysis 2018-2019 (US$)
Table 3: Mosquito Repeller Market Product Analysis 2018-2019 (US$)
Table 4: Mosquito Repeller Market End User Analysis 2018-2019 (US$)
Table 5: Mosquito Repeller Market Patent Analysis 2013-2018* (US$)
Table 6: Mosquito Repeller Market Financial Analysis 2018-2019 (US$)
Table 7: Mosquito Repeller Market Driver Analysis 2018-2019 (US$)
Table 8: Mosquito Repeller Market Challenges Analysis 2018-2019 (US$)
Table 9: Mosquito Repeller Market Constraint Analysis 2018-2019 (US$)
Table 10: Mosquito Repeller Market Supplier Bargaining Power Analysis 2018-2019 (US$)
Table 11: Mosquito Repeller Market Buyer Bargaining Power Analysis 2018-2019 (US$)
Table 12: Mosquito Repeller Market Threat of Substitutes Analysis 2018-2019 (US$)
Table 13: Mosquito Repeller Market Threat of New Entrants Analysis 2018-2019 (US$)
Table 14: Mosquito Repeller Market Degree of Competition Analysis 2018-2019 (US$)
Table 15: Mosquito Repeller Market Value Chain Analysis 2018-2019 (US$)
Table 16: Mosquito Repeller Market Pricing Analysis 2021-2026 (US$)
Table 17: Mosquito Repeller Market Opportunities Analysis 2021-2026 (US$)
Table 18: Mosquito Repeller Market Product Life Cycle Analysis 2021-2026 (US$)
Table 19: Mosquito Repeller Market Supplier Analysis 2018-2019 (US$)
Table 20: Mosquito Repeller Market Distributor Analysis 2018-2019 (US$)
Table 21: Mosquito Repeller Market Trend Analysis 2018-2019 (US$)
Table 22: Mosquito Repeller Market Size 2018 (US$)
Table 23: Mosquito Repeller Market Forecast Analysis 2021-2026 (US$)
Table 24: Mosquito Repeller Market Sales Forecast Analysis 2021-2026 (Units)
Table 25: Mosquito Repeller Market, Revenue & Volume, By Product, 2021-2026 ($)
Table 26: Mosquito Repeller Market By Product, Revenue & Volume, By Epicel, 2021-2026 ($)
Table 27: Mosquito Repeller Market By Product, Revenue & Volume, By Integra, 2021-2026 ($)
Table 28: Mosquito Repeller Market, Revenue & Volume, By Material, 2021-2026 ($)
Table 29: Mosquito Repeller Market By Material, Revenue & Volume, By Spider Silk, 2021-2026 ($)
Table 30: Mosquito Repeller Market By Material, Revenue & Volume, By Collagen, 2021-2026 ($)
Table 31: Mosquito Repeller Market By Material, Revenue & Volume, By Chemicals, 2021-2026 ($)
Table 32: Mosquito Repeller Market By Material, Revenue & Volume, By Cosmetics, 2021-2026 ($)
Table 33: Mosquito Repeller Market By Material, Revenue & Volume, By Pharmaceuticals, 2021-2026 ($)
Table 34: North America Mosquito Repeller Market, Revenue & Volume, By Product, 2021-2026 ($)
Table 35: North America Mosquito Repeller Market, Revenue & Volume, By Material, 2021-2026 ($)
Table 36: South america Mosquito Repeller Market, Revenue & Volume, By Product, 2021-2026 ($)
Table 37: South america Mosquito Repeller Market, Revenue & Volume, By Material, 2021-2026 ($)
Table 38: Europe Mosquito Repeller Market, Revenue & Volume, By Product, 2021-2026 ($)
Table 39: Europe Mosquito Repeller Market, Revenue & Volume, By Material, 2021-2026 ($)
Table 40: APAC Mosquito Repeller Market, Revenue & Volume, By Product, 2021-2026 ($)
Table 41: APAC Mosquito Repeller Market, Revenue & Volume, By Material, 2021-2026 ($)
Table 42: Middle East & Africa Mosquito Repeller Market, Revenue & Volume, By Product, 2021-2026 ($)
Table 43: Middle East & Africa Mosquito Repeller Market, Revenue & Volume, By Material, 2021-2026 ($)
Table 44: Russia Mosquito Repeller Market, Revenue & Volume, By Product, 2021-2026 ($)
Table 45: Russia Mosquito Repeller Market, Revenue & Volume, By Material, 2021-2026 ($)
Table 46: Israel Mosquito Repeller Market, Revenue & Volume, By Product, 2021-2026 ($)
Table 47: Israel Mosquito Repeller Market, Revenue & Volume, By Material, 2021-2026 ($)
Table 48: Top Companies 2018 (US$)Mosquito Repeller Market, Revenue & Volume
Table 49: Product Launch 2018-2019Mosquito Repeller Market, Revenue & Volume
Table 50: Mergers & Acquistions 2018-2019Mosquito Repeller Market, Revenue & Volume
List of Figures:
Figure 1: Overview of Mosquito Repeller Market 2021-2026
Figure 2: Market Share Analysis for Mosquito Repeller Market 2018 (US$)
Figure 3: Product Comparison in Mosquito Repeller Market 2018-2019 (US$)
Figure 4: End User Profile for Mosquito Repeller Market 2018-2019 (US$)
Figure 5: Patent Application and Grant in Mosquito Repeller Market 2013-2018* (US$)
Figure 6: Top 5 Companies Financial Analysis in Mosquito Repeller Market 2018-2019 (US$)
Figure 7: Market Entry Strategy in Mosquito Repeller Market 2018-2019
Figure 8: Ecosystem Analysis in Mosquito Repeller Market 2018
Figure 9: Average Selling Price in Mosquito Repeller Market 2021-2026
Figure 10: Top Opportunites in Mosquito Repeller Market 2018-2019
Figure 11: Market Life Cycle Analysis in Mosquito Repeller Market
Figure 12: GlobalBy ProductMosquito Repeller Market Revenue, 2021-2026 ($)
Figure 13: GlobalBy MaterialMosquito Repeller Market Revenue, 2021-2026 ($)
Figure 14: Global Mosquito Repeller Market - By Geography
Figure 15: Global Mosquito Repeller Market Value & Volume, By Geography, 2021-2026 ($)
Figure 16: Global Mosquito Repeller Market CAGR, By Geography, 2021-2026 (%)
Figure 17: North America Mosquito Repeller Market Value & Volume, 2021-2026 ($)
Figure 18: US Mosquito Repeller Market Value & Volume, 2021-2026 ($)
Figure 19: US GDP and Population, 2018-2019 ($)
Figure 20: US GDP – Composition of 2018, By Sector of Origin
Figure 21: US Export and Import Value & Volume, 2018-2019 ($)
Figure 22: Canada Mosquito Repeller Market Value & Volume, 2021-2026 ($)
Figure 23: Canada GDP and Population, 2018-2019 ($)
Figure 24: Canada GDP – Composition of 2018, By Sector of Origin
Figure 25: Canada Export and Import Value & Volume, 2018-2019 ($)
Figure 26: Mexico Mosquito Repeller Market Value & Volume, 2021-2026 ($)
Figure 27: Mexico GDP and Population, 2018-2019 ($)
Figure 28: Mexico GDP – Composition of 2018, By Sector of Origin
Figure 29: Mexico Export and Import Value & Volume, 2018-2019 ($)
Figure 30: South America Mosquito Repeller Market Value & Volume, 2021-2026 ($)
Figure 31: Brazil Mosquito Repeller Market Value & Volume, 2021-2026 ($)
Figure 32: Brazil GDP and Population, 2018-2019 ($)
Figure 33: Brazil GDP – Composition of 2018, By Sector of Origin
Figure 34: Brazil Export and Import Value & Volume, 2018-2019 ($)
Figure 35: Venezuela Mosquito Repeller Market Value & Volume, 2021-2026 ($)
Figure 36: Venezuela GDP and Population, 2018-2019 ($)
Figure 37: Venezuela GDP – Composition of 2018, By Sector of Origin
Figure 38: Venezuela Export and Import Value & Volume, 2018-2019 ($)
Figure 39: Argentina Mosquito Repeller Market Value & Volume, 2021-2026 ($)
Figure 40: Argentina GDP and Population, 2018-2019 ($)
Figure 41: Argentina GDP – Composition of 2018, By Sector of Origin
Figure 42: Argentina Export and Import Value & Volume, 2018-2019 ($)
Figure 43: Ecuador Mosquito Repeller Market Value & Volume, 2021-2026 ($)
Figure 44: Ecuador GDP and Population, 2018-2019 ($)
Figure 45: Ecuador GDP – Composition of 2018, By Sector of Origin
Figure 46: Ecuador Export and Import Value & Volume, 2018-2019 ($)
Figure 47: Peru Mosquito Repeller Market Value & Volume, 2021-2026 ($)
Figure 48: Peru GDP and Population, 2018-2019 ($)
Figure 49: Peru GDP – Composition of 2018, By Sector of Origin
Figure 50: Peru Export and Import Value & Volume, 2018-2019 ($)
Figure 51: Colombia Mosquito Repeller Market Value & Volume, 2021-2026 ($)
Figure 52: Colombia GDP and Population, 2018-2019 ($)
Figure 53: Colombia GDP – Composition of 2018, By Sector of Origin
Figure 54: Colombia Export and Import Value & Volume, 2018-2019 ($)
Figure 55: Costa Rica Mosquito Repeller Market Value & Volume, 2021-2026 ($)
Figure 56: Costa Rica GDP and Population, 2018-2019 ($)
Figure 57: Costa Rica GDP – Composition of 2018, By Sector of Origin
Figure 58: Costa Rica Export and Import Value & Volume, 2018-2019 ($)
Figure 59: Europe Mosquito Repeller Market Value & Volume, 2021-2026 ($)
Figure 60: U.K Mosquito Repeller Market Value & Volume, 2021-2026 ($)
Figure 61: U.K GDP and Population, 2018-2019 ($)
Figure 62: U.K GDP – Composition of 2018, By Sector of Origin
Figure 63: U.K Export and Import Value & Volume, 2018-2019 ($)
Figure 64: Germany Mosquito Repeller Market Value & Volume, 2021-2026 ($)
Figure 65: Germany GDP and Population, 2018-2019 ($)
Figure 66: Germany GDP – Composition of 2018, By Sector of Origin
Figure 67: Germany Export and Import Value & Volume, 2018-2019 ($)
Figure 68: Italy Mosquito Repeller Market Value & Volume, 2021-2026 ($)
Figure 69: Italy GDP and Population, 2018-2019 ($)
Figure 70: Italy GDP – Composition of 2018, By Sector of Origin
Figure 71: Italy Export and Import Value & Volume, 2018-2019 ($)
Figure 72: France Mosquito Repeller Market Value & Volume, 2021-2026 ($)
Figure 73: France GDP and Population, 2018-2019 ($)
Figure 74: France GDP – Composition of 2018, By Sector of Origin
Figure 75: France Export and Import Value & Volume, 2018-2019 ($)
Figure 76: Netherlands Mosquito Repeller Market Value & Volume, 2021-2026 ($)
Figure 77: Netherlands GDP and Population, 2018-2019 ($)
Figure 78: Netherlands GDP – Composition of 2018, By Sector of Origin
Figure 79: Netherlands Export and Import Value & Volume, 2018-2019 ($)
Figure 80: Belgium Mosquito Repeller Market Value & Volume, 2021-2026 ($)
Figure 81: Belgium GDP and Population, 2018-2019 ($)
Figure 82: Belgium GDP – Composition of 2018, By Sector of Origin
Figure 83: Belgium Export and Import Value & Volume, 2018-2019 ($)
Figure 84: Spain Mosquito Repeller Market Value & Volume, 2021-2026 ($)
Figure 85: Spain GDP and Population, 2018-2019 ($)
Figure 86: Spain GDP – Composition of 2018, By Sector of Origin
Figure 87: Spain Export and Import Value & Volume, 2018-2019 ($)
Figure 88: Denmark Mosquito Repeller Market Value & Volume, 2021-2026 ($)
Figure 89: Denmark GDP and Population, 2018-2019 ($)
Figure 90: Denmark GDP – Composition of 2018, By Sector of Origin
Figure 91: Denmark Export and Import Value & Volume, 2018-2019 ($)
Figure 92: APAC Mosquito Repeller Market Value & Volume, 2021-2026 ($)
Figure 93: China Mosquito Repeller Market Value & Volume, 2021-2026
Figure 94: China GDP and Population, 2018-2019 ($)
Figure 95: China GDP – Composition of 2018, By Sector of Origin
Figure 96: China Export and Import Value & Volume, 2018-2019 ($)Mosquito Repeller Market China Export and Import Value & Volume, 2018-2019 ($)
Figure 97: Australia Mosquito Repeller Market Value & Volume, 2021-2026 ($)
Figure 98: Australia GDP and Population, 2018-2019 ($)
Figure 99: Australia GDP – Composition of 2018, By Sector of Origin
Figure 100: Australia Export and Import Value & Volume, 2018-2019 ($)
Figure 101: South Korea Mosquito Repeller Market Value & Volume, 2021-2026 ($)
Figure 102: South Korea GDP and Population, 2018-2019 ($)
Figure 103: South Korea GDP – Composition of 2018, By Sector of Origin
Figure 104: South Korea Export and Import Value & Volume, 2018-2019 ($)
Figure 105: India Mosquito Repeller Market Value & Volume, 2021-2026 ($)
Figure 106: India GDP and Population, 2018-2019 ($)
Figure 107: India GDP – Composition of 2018, By Sector of Origin
Figure 108: India Export and Import Value & Volume, 2018-2019 ($)
Figure 109: Taiwan Mosquito Repeller Market Value & Volume, 2021-2026 ($)
Figure 110: Taiwan GDP and Population, 2018-2019 ($)
Figure 111: Taiwan GDP – Composition of 2018, By Sector of Origin
Figure 112: Taiwan Export and Import Value & Volume, 2018-2019 ($)
Figure 113: Malaysia Mosquito Repeller Market Value & Volume, 2021-2026 ($)
Figure 114: Malaysia GDP and Population, 2018-2019 ($)
Figure 115: Malaysia GDP – Composition of 2018, By Sector of Origin
Figure 116: Malaysia Export and Import Value & Volume, 2018-2019 ($)
Figure 117: Hong Kong Mosquito Repeller Market Value & Volume, 2021-2026 ($)
Figure 118: Hong Kong GDP and Population, 2018-2019 ($)
Figure 119: Hong Kong GDP – Composition of 2018, By Sector of Origin
Figure 120: Hong Kong Export and Import Value & Volume, 2018-2019 ($)
Figure 121: Middle East & Africa Mosquito Repeller Market Middle East & Africa 3D Printing Market Value & Volume, 2021-2026 ($)
Figure 122: Russia Mosquito Repeller Market Value & Volume, 2021-2026 ($)
Figure 123: Russia GDP and Population, 2018-2019 ($)
Figure 124: Russia GDP – Composition of 2018, By Sector of Origin
Figure 125: Russia Export and Import Value & Volume, 2018-2019 ($)
Figure 126: Israel Mosquito Repeller Market Value & Volume, 2021-2026 ($)
Figure 127: Israel GDP and Population, 2018-2019 ($)
Figure 128: Israel GDP – Composition of 2018, By Sector of Origin
Figure 129: Israel Export and Import Value & Volume, 2018-2019 ($)
Figure 130: Entropy Share, By Strategies, 2018-2019* (%)Mosquito Repeller Market
Figure 131: Developments, 2018-2019*Mosquito Repeller Market
Figure 132: Company 1 Mosquito Repeller Market Net Revenue, By Years, 2018-2019* ($)
Figure 133: Company 1 Mosquito Repeller Market Net Revenue Share, By Business segments, 2018 (%)
Figure 134: Company 1 Mosquito Repeller Market Net Sales Share, By Geography, 2018 (%)
Figure 135: Company 2 Mosquito Repeller Market Net Revenue, By Years, 2018-2019* ($)
Figure 136: Company 2 Mosquito Repeller Market Net Revenue Share, By Business segments, 2018 (%)
Figure 137: Company 2 Mosquito Repeller Market Net Sales Share, By Geography, 2018 (%)
Figure 138: Company 3 Mosquito Repeller Market Net Revenue, By Years, 2018-2019* ($)
Figure 139: Company 3 Mosquito Repeller Market Net Revenue Share, By Business segments, 2018 (%)
Figure 140: Company 3 Mosquito Repeller Market Net Sales Share, By Geography, 2018 (%)
Figure 141: Company 4 Mosquito Repeller Market Net Revenue, By Years, 2018-2019* ($)
Figure 142: Company 4 Mosquito Repeller Market Net Revenue Share, By Business segments, 2018 (%)
Figure 143: Company 4 Mosquito Repeller Market Net Sales Share, By Geography, 2018 (%)
Figure 144: Company 5 Mosquito Repeller Market Net Revenue, By Years, 2018-2019* ($)
Figure 145: Company 5 Mosquito Repeller Market Net Revenue Share, By Business segments, 2018 (%)
Figure 146: Company 5 Mosquito Repeller Market Net Sales Share, By Geography, 2018 (%)
Figure 147: Company 6 Mosquito Repeller Market Net Revenue, By Years, 2018-2019* ($)
Figure 148: Company 6 Mosquito Repeller Market Net Revenue Share, By Business segments, 2018 (%)
Figure 149: Company 6 Mosquito Repeller Market Net Sales Share, By Geography, 2018 (%)
Figure 150: Company 7 Mosquito Repeller Market Net Revenue, By Years, 2018-2019* ($)
Figure 151: Company 7 Mosquito Repeller Market Net Revenue Share, By Business segments, 2018 (%)
Figure 152: Company 7 Mosquito Repeller Market Net Sales Share, By Geography, 2018 (%)
Figure 153: Company 8 Mosquito Repeller Market Net Revenue, By Years, 2018-2019* ($)
Figure 154: Company 8 Mosquito Repeller Market Net Revenue Share, By Business segments, 2018 (%)
Figure 155: Company 8 Mosquito Repeller Market Net Sales Share, By Geography, 2018 (%)
Figure 156: Company 9 Mosquito Repeller Market Net Revenue, By Years, 2018-2019* ($)
Figure 157: Company 9 Mosquito Repeller Market Net Revenue Share, By Business segments, 2018 (%)
Figure 158: Company 9 Mosquito Repeller Market Net Sales Share, By Geography, 2018 (%)
Figure 159: Company 10 Mosquito Repeller Market Net Revenue, By Years, 2018-2019* ($)
Figure 160: Company 10 Mosquito Repeller Market Net Revenue Share, By Business segments, 2018 (%)
Figure 161: Company 10 Mosquito Repeller Market Net Sales Share, By Geography, 2018 (%)
Figure 162: Company 11 Mosquito Repeller Market Net Revenue, By Years, 2018-2019* ($)
Figure 163: Company 11 Mosquito Repeller Market Net Revenue Share, By Business segments, 2018 (%)
Figure 164: Company 11 Mosquito Repeller Market Net Sales Share, By Geography, 2018 (%)
Figure 165: Company 12 Mosquito Repeller Market Net Revenue, By Years, 2018-2019* ($)
Figure 166: Company 12 Mosquito Repeller Market Net Revenue Share, By Business segments, 2018 (%)
Figure 167: Company 12 Mosquito Repeller Market Net Sales Share, By Geography, 2018 (%)
Figure 168: Company 13 Mosquito Repeller Market Net Revenue, By Years, 2018-2019* ($)
Figure 169: Company 13 Mosquito Repeller Market Net Revenue Share, By Business segments, 2018 (%)
Figure 170: Company 13 Mosquito Repeller Market Net Sales Share, By Geography, 2018 (%)
Figure 171: Company 14 Mosquito Repeller Market Net Revenue, By Years, 2018-2019* ($)
Figure 172: Company 14 Mosquito Repeller Market Net Revenue Share, By Business segments, 2018 (%)
Figure 173: Company 14 Mosquito Repeller Market Net Sales Share, By Geography, 2018 (%)
Figure 174: Company 15 Mosquito Repeller Market Net Revenue, By Years, 2018-2019* ($)
Figure 175: Company 15 Mosquito Repeller Market Net Revenue Share, By Business segments, 2018 (%)
Figure 176: Company 15 Mosquito Repeller Market Net Sales Share, By Geography, 2018 (%)