 Email
Email Print
Print


Global Soda Ash Market Overview
The Global Soda Ash market size is set to grow at a CAGR of 4.2% and to reach $31.12 billion during the period 2024-2030. Club Soda is a carbonated drink added with minerals like sodium bicarbonate, sodium citrate, potassium bicarbonate, potassium sulfate, and disodium phosphate & also flavored with spices or fruit juices. It's also known as sparkling water, soda water, and seltzer water. Club Soda is a refreshing alternative to soda and other sugary drinks, which increase the risk of obesity and type 2 diabetes. According to studies, drinking soda water can help relieve constipation symptoms like stomach pain and irregular bowel movements. Club Soda is made by adding carbon dioxide to purified or filtered water. Club soda can be generated either naturally or by the carbonation process. It has a lower mineral concentration than seltzer but a higher mineral content than normal drinking water. Gluten-free beverages have gained significant popularity among health-conscious consumers, as people with celiac disease or allergies discover the benefits of gluten-free beverages, and gluten-free soda water has proven to be beneficial for people suffering from inflammatory diseases and autoimmune disorders. The rising popularity of flavored alcoholic beverages and healthier alternatives has led to a worldwide demand for ready-to-drink sparkling beverages like soda water. Several manufacturers are also producing novel product varieties to broaden their existing product portfolio. Increased demand for low alcohol, low calorie & low carbohydrate beverages propelling the growth of the Club Soda water market, as well as brand awareness advertising by manufacturers, are the fundamental reasons driving the Club Soda market sector during the forecast period 2024-2030.
Global Soda Ash Market Report Coverage
The report: “Global Soda Ash Industry – Forecast (2024-2030)”, by IndustryARC covers an in-depth analysis of the following segments of the Global Soda Ash Market Report.
By Process: Solvay, Leblanc
By Type: Light Sodium Carbonate, Granular Soda ash, Refined Sodium hydrogen carbon
By Grade: Light, Medium, Dense
By Application: Glass, Chemical, Others
By End User: Glass Industry, Food & Beverages, Paper & Pulp, Consumer Goods, Oil & Gas, Electronics, Others
By Geography: North America (U.S, Canada, Mexico), South America (Brazil, Argentina and others), Europe (Germany, UK, France, Italy, Spain, Russia and Others), APAC (China, Japan India, SK, Australia and Others), and RoW (Middle east and Africa)
Key Takeaways
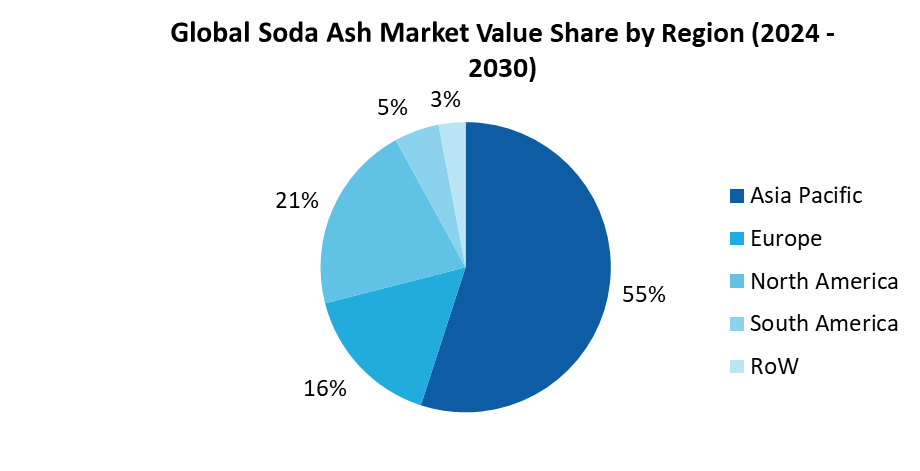
• The global Soda Ash Market is dominated by APAC with a market share of 55% in 2023. The Asia-Pacific region, particularly China, has been a major player in the soda ash market. China, with its booming industrial sectors, has been a key contributor to both production and consumption.
• The glass industry is a major consumer of soda ash, primarily for the production of glass containers and flat glass. Any trends or developments in the glass industry can significantly impact the soda ash market.
• Environmental regulations and concerns about carbon emissions are impacting the soda ash industry. Soda ash production is energy-intensive and can contribute to greenhouse gas emissions. As a result, there is a growing emphasis on adopting cleaner production processes and reducing the carbon footprint of soda ash manufacturing.
For more details on this report - Request for Sample
Global Soda Ash Market Segment Analysis- By Grade
Light Grade Ash held a significant portion of the Global Soda Ash market in 2023, claiming a major share due to its versatile applications and desirable properties. Its prevalence stems from its widespread utilization across various industries, including glass manufacturing, chemicals, detergents, and more. Light Grade Ash's purity, consistency, and affordability make it a preferred choice for many industrial processes, driving its prominence in the market. Additionally, its compatibility with diverse production methods and its role as a key ingredient in numerous consumer products further solidify its position. As demand for soda ash continues to rise globally, the dominance of Light Grade Ash is expected to persist, sustaining its substantial market share.
Global Soda Ash Market Segment Analysis - By End Users
The global Soda Ash Market is dominated by Glass Industry with a market share in 2023. The glass industry is a significant consumer of soda ash, utilizing it as a key ingredient in glass production processes. With the global demand for glass products across various sectors such as construction, automotive, and packaging, the market demand for soda ash remains robust. The versatility of glass and its widespread applications ensure a steady need for soda ash worldwide. As per United States census, Construction spending in December 2023 reached an estimated annual rate of $2,096.0 billion, 0.9% above November's figure. Compared to December 2022, it rose by 13.9%. In 2023, total construction spending amounted to $1,978.7 billion, a 7.0% increase from 2022's $1,848.7 billion. As construction activities surge, the soda ash market is poised for increased demand to meet industry needs.
Global Soda Ash Market Segment Analysis- By Geography
The global Soda Ash Market is dominated by APAC with a market share of 55% in 2023. The Asia Pacific region's Soda Ash market is driven by robust demand factors, including burgeoning construction activities, escalating glass production, and increasing detergent and chemicals manufacturing. The construction boom in emerging economies fuels demand for soda ash in glass production for windows and facades. Moreover, the expanding detergent and chemicals sector relies heavily on soda ash as a key ingredient. The region's growing population and urbanization further amplify these trends, emphasizing the pivotal role of soda ash in diverse industries. Additionally, the Asia Pacific's focus on sustainable practices and green technologies contributes to the demand for soda ash in environmentally conscious applications.
Global Soda Ash Market Drivers
Construction and Infrastructure Development:
The demand for soda ash is being driven by the construction and infrastructure development sectors. The construction industry is a significant driver for the soda ash market, with soda ash extensively used in the production of flat glass, fiberglass, and other construction materials. Rapid urbanization and infrastructure development in emerging economies provide opportunities for the soda ash market, as countries investing in infrastructure projects drive the demand for glass and construction materials, thereby creating growth prospects for soda ash.
Rising Demand from the Foundry Industry
The foundry industry is driving a surge in demand for soda ash, a key ingredient in metal casting processes. With its role in facilitating the fusion of molding sand and removal of impurities, soda ash enhances casting efficiency. The increasing global demand for metal components and products is propelling the growth of the soda ash market, as foundries seek this crucial additive to meet production demands. This uptick underscores soda ash's pivotal role in supporting foundry operations amid escalating industry requirements.
Global Soda Ash Market Challenges
Price Volatility:
Price volatility is a significant challenge for the soda ash market, primarily driven by fluctuations in raw material prices, notably trona ore and natural gas. These fluctuations directly impact production costs, exerting pressure on market prices. Uncertainties in the availability and pricing of these key inputs make it challenging for producers to maintain stable pricing strategies, leading to market instability. Moreover, such volatility can hinder long-term planning and investment decisions, affecting the overall competitiveness of the industry.
Global Soda Ash Market Landscape
Partnerships and acquisitions along with product development and up gradation are key strategies adopted by players in the Global Soda Ash market. Major players in the Global Soda Ash market include Solvay, Tata Chemicals Limited, Shandong Haihua Group Co., Ltd., CIECH SA, Genesis Energy LP, GHCL Limited, Bashkir Soda Company, Tokuyama Corporation, Keshariya corporation, DCW Ltd., and others.
Partnerships/Mergers/Acquisitions
In September 2022, Solvay pioneers a more sustainable soda ash production process, investing $43.40 million in Dombasle, France. Their breakthrough technology slashes CO2 emissions by 50%, curtails water and limestone usage, and eliminates limestone discharge, aligning with their 2050 carbon neutrality goal.
In CIECH has successfully contracted all soda production for 2022, catering to 400 global clients, including major industrial players. Negotiated prices mitigate rising raw material costs, ensuring delivery reliability amid high demand from glass manufacturers. CIECH remains a leading soda ash producer in Central and Eastern Europe.
In November 2022, GHCL, a Delhi NCR headquartered company with interests in soda ash and textiles, will establish a Rs 3,500 crore greenfield manufacturing facility in Gujarat. The 0.5 MTPA capacity plant, spanning 1,000 acres near Mandvi town in Kutch district, signifies their commitment to expanding operations and leveraging Gujarat's coastal advantage.
1. Global Soda Ash Market - Overview
1.1 Definitions and Scope
2. Global Soda Ash Market - Executive Summary
2.1 Key Trends by Process
2.2 Key Trends by Type
2.3 Key Trends by Grade
2.4 Key Trends by Application
2.5 Key Trends by End User
2.6 Key Trends by Geography
3. Global Soda Ash Market - Comparative Analysis
3.1 Company Benchmarking
3.2 Global Financial Analysis
3.3 Market Share Analysis
3.4 Patent Analysis
3.5 Pricing Analysis
4. Global Soda Ash Market - Start-up Companies Scenario
4.1 Key Start-up Company Analysis by
4.1.1 Investment
4.1.2 Revenue
4.1.3 Venture Capital and Funding Scenario
5. Global Soda Ash Market – Market Entry Scenario Premium
5.1 Regulatory Framework Overview
5.2 New Business and Ease of Doing Business Index
5.3 Case Studies of Successful Ventures
6. Global Soda Ash Market - Forces
6.1 Market Drivers
6.2 Market Constraints/Challenges
6.3 Porter’s Five Force Model
6.3.1 Bargaining power of suppliers
6.3.2 Bargaining powers of customers
6.3.3 Threat of new entrants
6.3.4 Rivalry among existing players
6.3.5 Threat of substitutes
7. Global Soda Ash Market – Strategic Analysis
7.1 Value Chain Analysis
7.2 Opportunities Analysis
7.3 Market Life Cycle
8. Global Soda Ash Market– By Process (Market Size -$Million/Billion)
8.1 Solvay
8.2 Leblanc
9. Global Soda Ash Market– By Type (Market Size -$Million/Billion)
9.1 Light Sodium Carbonate
9.2 Granular Soda ash
9.3 Refined Sodium hydrogen carbon
10. Global Soda Ash Market– By Grade (Market Size -$Million/Billion)
10.1 Light
10.2 Medium
10.3 Dense
11. Global Soda Ash Market – By Application (Market Size -$Million/Billion)
11.1 Glass
11.2 Chemical
11.3 Others
12. Soda Ash Market– By End User (Market Size -$Million /Billion)
12.1 Glass Industry
12.1.1 Unit Flat Glass
12.1.2 Instrumentation Glass
12.1.3 Continuous Filament Glass
12.1.4 Domestic Glass
12.1.5 Special Glass
12.2 Food & Beverages
12.3 Paper & Pulp
12.4 Consumer Goods
12.5 Oil & Gas
12.6 Electronics
12.7 Others
13. Global Soda Ash Market – By Geography (Market Size - $Million/$Billion)
13.1 North America
13.1.1 U.S.
13.1.2 Canada
13.1.3 Mexico
13.2 Europe
13.2.1 U.K
13.2.2 Germany
13.2.3 Italy
13.2.4 France
13.2.5 Netherlands
13.2.6 Belgium
13.2.7 Spain
13.2.8 Denmark
13.2.9 Rest of Europe
13.3 Asia-Pacific
13.3.1 China
13.3.2 Australia
13.3.3 Japan
13.3.4 South Korea
13.3.5 India
13.3.6 Taiwan
13.3.7 Malaysia
13.3.8 Hong Kong
13.3.9 Rest of APAC
13.4 South America
13.4.1 Brazil
13.4.2 Venezuela
13.4.3 Argentina
13.4.4 Ecuador
13.4.5 Peru
13.4.6 Colombia
13.4.7 Costa Rica Costa Rica
13.4.8 Rest of South America
13.5 Rest of The World
13.5.1 Middle East
13.5.2 Africa
14. Global Soda Ash Market - Entropy
15. Global Soda Ash Market – Industry/Segment Competition Landscape
15.1 Market Share Analysis
15.1.1 Global Market Share – Key Companies
15.1.2 Market Share by Region – Key Companies
15.1.3 Market Share by Countries – Key Companies
15.2 Competition Matrix
15.3 Best Practices for Companies
16. Global Soda Ash Market – Key Company List by Country Premium
17. Global Soda Ash Market- Company Analysis
17.1 Solvay
17.2 Tata Chemicals Limited
17.3 Shandong Haihua Group Co., Ltd.
17.4 CIECH SA
17.5 Genesis Energy LP
17.6 GHCL Limited
17.7 Bashkir Soda Company
17.8 Tokuyama Corporation
17.9 keshariya corporation
17.10 DCW Ltd.
* "Financials would be provided to private companies on best-efforts basis."
Connect with our experts to get customized reports that best suit your requirements. Our reports include global-level data, niche markets and competitive landscape.
List of Tables
Table 1 Soda Ash Market Overview 2021-2026
Table 2 Soda Ash Market Leader Analysis 2018-2019 (US$)
Table 3 Soda Ash MarketProduct Analysis 2018-2019 (US$)
Table 4 Soda Ash MarketEnd User Analysis 2018-2019 (US$)
Table 5 Soda Ash MarketPatent Analysis 2013-2018* (US$)
Table 6 Soda Ash MarketFinancial Analysis 2018-2019 (US$)
Table 7 Soda Ash Market Driver Analysis 2018-2019 (US$)
Table 8 Soda Ash MarketChallenges Analysis 2018-2019 (US$)
Table 9 Soda Ash MarketConstraint Analysis 2018-2019 (US$)
Table 10 Soda Ash Market Supplier Bargaining Power Analysis 2018-2019 (US$)
Table 11 Soda Ash Market Buyer Bargaining Power Analysis 2018-2019 (US$)
Table 12 Soda Ash Market Threat of Substitutes Analysis 2018-2019 (US$)
Table 13 Soda Ash Market Threat of New Entrants Analysis 2018-2019 (US$)
Table 14 Soda Ash Market Degree of Competition Analysis 2018-2019 (US$)
Table 15 Soda Ash MarketValue Chain Analysis 2018-2019 (US$)
Table 16 Soda Ash MarketPricing Analysis 2021-2026 (US$)
Table 17 Soda Ash MarketOpportunities Analysis 2021-2026 (US$)
Table 18 Soda Ash MarketProduct Life Cycle Analysis 2021-2026 (US$)
Table 19 Soda Ash MarketSupplier Analysis 2018-2019 (US$)
Table 20 Soda Ash MarketDistributor Analysis 2018-2019 (US$)
Table 21 Soda Ash Market Trend Analysis 2018-2019 (US$)
Table 22 Soda Ash Market Size 2018 (US$)
Table 23 Soda Ash Market Forecast Analysis 2021-2026 (US$)
Table 24 Soda Ash Market Sales Forecast Analysis 2021-2026 (Units)
Table 25 Soda Ash Market, Revenue & Volume,By Application, 2021-2026 ($)
Table 26 Soda Ash MarketBy Application, Revenue & Volume,By Glass, 2021-2026 ($)
Table 27 Soda Ash MarketBy Application, Revenue & Volume,By Chemicals, 2021-2026 ($)
Table 28 Soda Ash MarketBy Application, Revenue & Volume,By Soaps and Detergents, 2021-2026 ($)
Table 29 Soda Ash MarketBy Application, Revenue & Volume,By Metallurgy, 2021-2026 ($)
Table 30 Soda Ash MarketBy Application, Revenue & Volume,By Water treatment, 2021-2026 ($)
Table 31 North America Soda Ash Market, Revenue & Volume,By Application, 2021-2026 ($)
Table 32 South america Soda Ash Market, Revenue & Volume,By Application, 2021-2026 ($)
Table 33 Europe Soda Ash Market, Revenue & Volume,By Application, 2021-2026 ($)
Table 34 APAC Soda Ash Market, Revenue & Volume,By Application, 2021-2026 ($)
Table 35 Middle East & Africa Soda Ash Market, Revenue & Volume,By Application, 2021-2026 ($)
Table 36 Russia Soda Ash Market, Revenue & Volume,By Application, 2021-2026 ($)
Table 37 Israel Soda Ash Market, Revenue & Volume,By Application, 2021-2026 ($)
Table 38 Top Companies 2018 (US$)Soda Ash Market, Revenue & Volume,,
Table 39 Product Launch 2018-2019Soda Ash Market, Revenue & Volume,,
Table 40 Mergers & Acquistions 2018-2019Soda Ash Market, Revenue & Volume,,
List of Figures
Figure 1 Overview of Soda Ash Market 2021-2026
Figure 2 Market Share Analysis for Soda Ash Market 2018 (US$)
Figure 3 Product Comparison in Soda Ash Market 2018-2019 (US$)
Figure 4 End User Profile for Soda Ash Market 2018-2019 (US$)
Figure 5 Patent Application and Grant in Soda Ash Market 2013-2018* (US$)
Figure 6 Top 5 Companies Financial Analysis in Soda Ash Market 2018-2019 (US$)
Figure 7 Market Entry Strategy in Soda Ash Market 2018-2019
Figure 8 Ecosystem Analysis in Soda Ash Market2018
Figure 9 Average Selling Price in Soda Ash Market 2021-2026
Figure 10 Top Opportunites in Soda Ash Market 2018-2019
Figure 11 Market Life Cycle Analysis in Soda Ash Market
Figure 12 GlobalBy ApplicationSoda Ash Market Revenue, 2021-2026 ($)
Figure 13 Global Soda Ash Market - By Geography
Figure 14 Global Soda Ash Market Value & Volume, By Geography, 2021-2026 ($)
Figure 15 Global Soda Ash Market CAGR, By Geography, 2021-2026 (%)
Figure 16 North America Soda Ash Market Value & Volume, 2021-2026 ($)
Figure 17 US Soda Ash Market Value & Volume, 2021-2026 ($)
Figure 18 US GDP and Population, 2018-2019 ($)
Figure 19 US GDP – Composition of 2018, By Sector of Origin
Figure 20 US Export and Import Value & Volume, 2018-2019 ($)
Figure 21 Canada Soda Ash Market Value & Volume, 2021-2026 ($)
Figure 22 Canada GDP and Population, 2018-2019 ($)
Figure 23 Canada GDP – Composition of 2018, By Sector of Origin
Figure 24 Canada Export and Import Value & Volume, 2018-2019 ($)
Figure 25 Mexico Soda Ash Market Value & Volume, 2021-2026 ($)
Figure 26 Mexico GDP and Population, 2018-2019 ($)
Figure 27 Mexico GDP – Composition of 2018, By Sector of Origin
Figure 28 Mexico Export and Import Value & Volume, 2018-2019 ($)
Figure 29 South America Soda Ash MarketSouth America 3D Printing Market Value & Volume, 2021-2026 ($)
Figure 30 Brazil Soda Ash Market Value & Volume, 2021-2026 ($)
Figure 31 Brazil GDP and Population, 2018-2019 ($)
Figure 32 Brazil GDP – Composition of 2018, By Sector of Origin
Figure 33 Brazil Export and Import Value & Volume, 2018-2019 ($)
Figure 34 Venezuela Soda Ash Market Value & Volume, 2021-2026 ($)
Figure 35 Venezuela GDP and Population, 2018-2019 ($)
Figure 36 Venezuela GDP – Composition of 2018, By Sector of Origin
Figure 37 Venezuela Export and Import Value & Volume, 2018-2019 ($)
Figure 38 Argentina Soda Ash Market Value & Volume, 2021-2026 ($)
Figure 39 Argentina GDP and Population, 2018-2019 ($)
Figure 40 Argentina GDP – Composition of 2018, By Sector of Origin
Figure 41 Argentina Export and Import Value & Volume, 2018-2019 ($)
Figure 42 Ecuador Soda Ash Market Value & Volume, 2021-2026 ($)
Figure 43 Ecuador GDP and Population, 2018-2019 ($)
Figure 44 Ecuador GDP – Composition of 2018, By Sector of Origin
Figure 45 Ecuador Export and Import Value & Volume, 2018-2019 ($)
Figure 46 Peru Soda Ash Market Value & Volume, 2021-2026 ($)
Figure 47 Peru GDP and Population, 2018-2019 ($)
Figure 48 Peru GDP – Composition of 2018, By Sector of Origin
Figure 49 Peru Export and Import Value & Volume, 2018-2019 ($)
Figure 50 Colombia Soda Ash Market Value & Volume, 2021-2026 ($)
Figure 51 Colombia GDP and Population, 2018-2019 ($)
Figure 52 Colombia GDP – Composition of 2018, By Sector of Origin
Figure 53 Colombia Export and Import Value & Volume, 2018-2019 ($)
Figure 54 Costa Rica Soda Ash MarketCosta Rica 3D Printing Market Value & Volume, 2021-2026 ($)
Figure 55 Costa Rica GDP and Population, 2018-2019 ($)
Figure 56 Costa Rica GDP – Composition of 2018, By Sector of Origin
Figure 57 Costa Rica Export and Import Value & Volume, 2018-2019 ($)
Figure 58 Europe Soda Ash Market Value & Volume, 2021-2026 ($)
Figure 59 U.K Soda Ash Market Value & Volume, 2021-2026 ($)
Figure 60 U.K GDP and Population, 2018-2019 ($)
Figure 61 U.K GDP – Composition of 2018, By Sector of Origin
Figure 62 U.K Export and Import Value & Volume, 2018-2019 ($)
Figure 63 Germany Soda Ash Market Value & Volume, 2021-2026 ($)
Figure 64 Germany GDP and Population, 2018-2019 ($)
Figure 65 Germany GDP – Composition of 2018, By Sector of Origin
Figure 66 Germany Export and Import Value & Volume, 2018-2019 ($)
Figure 67 Italy Soda Ash Market Value & Volume, 2021-2026 ($)
Figure 68 Italy GDP and Population, 2018-2019 ($)
Figure 69 Italy GDP – Composition of 2018, By Sector of Origin
Figure 70 Italy Export and Import Value & Volume, 2018-2019 ($)
Figure 71 France Soda Ash Market Value & Volume, 2021-2026 ($)
Figure 72 France GDP and Population, 2018-2019 ($)
Figure 73 France GDP – Composition of 2018, By Sector of Origin
Figure 74 France Export and Import Value & Volume, 2018-2019 ($)
Figure 75 Netherlands Soda Ash Market Value & Volume, 2021-2026 ($)
Figure 76 Netherlands GDP and Population, 2018-2019 ($)
Figure 77 Netherlands GDP – Composition of 2018, By Sector of Origin
Figure 78 Netherlands Export and Import Value & Volume, 2018-2019 ($)
Figure 79 Belgium Soda Ash Market Value & Volume, 2021-2026 ($)
Figure 80 Belgium GDP and Population, 2018-2019 ($)
Figure 81 Belgium GDP – Composition of 2018, By Sector of Origin
Figure 82 Belgium Export and Import Value & Volume, 2018-2019 ($)
Figure 83 Spain Soda Ash Market Value & Volume, 2021-2026 ($)
Figure 84 Spain GDP and Population, 2018-2019 ($)
Figure 85 Spain GDP – Composition of 2018, By Sector of Origin
Figure 86 Spain Export and Import Value & Volume, 2018-2019 ($)
Figure 87 Denmark Soda Ash Market Value & Volume, 2021-2026 ($)
Figure 88 Denmark GDP and Population, 2018-2019 ($)
Figure 89 Denmark GDP – Composition of 2018, By Sector of Origin
Figure 90 Denmark Export and Import Value & Volume, 2018-2019 ($)
Figure 91 APAC Soda Ash Market Value & Volume, 2021-2026 ($)
Figure 92 China Soda Ash MarketValue & Volume, 2021-2026
Figure 93 China GDP and Population, 2018-2019 ($)
Figure 94 China GDP – Composition of 2018, By Sector of Origin
Figure 95 China Export and Import Value & Volume, 2018-2019 ($)Soda Ash MarketChina Export and Import Value & Volume, 2018-2019 ($)
Figure 96 Australia Soda Ash Market Value & Volume, 2021-2026 ($)
Figure 97 Australia GDP and Population, 2018-2019 ($)
Figure 98 Australia GDP – Composition of 2018, By Sector of Origin
Figure 99 Australia Export and Import Value & Volume, 2018-2019 ($)
Figure 100 South Korea Soda Ash Market Value & Volume, 2021-2026 ($)
Figure 101 South Korea GDP and Population, 2018-2019 ($)
Figure 102 South Korea GDP – Composition of 2018, By Sector of Origin
Figure 103 South Korea Export and Import Value & Volume, 2018-2019 ($)
Figure 104 India Soda Ash Market Value & Volume, 2021-2026 ($)
Figure 105 India GDP and Population, 2018-2019 ($)
Figure 106 India GDP – Composition of 2018, By Sector of Origin
Figure 107 India Export and Import Value & Volume, 2018-2019 ($)
Figure 108 Taiwan Soda Ash MarketTaiwan 3D Printing Market Value & Volume, 2021-2026 ($)
Figure 109 Taiwan GDP and Population, 2018-2019 ($)
Figure 110 Taiwan GDP – Composition of 2018, By Sector of Origin
Figure 111 Taiwan Export and Import Value & Volume, 2018-2019 ($)
Figure 112 Malaysia Soda Ash MarketMalaysia 3D Printing Market Value & Volume, 2021-2026 ($)
Figure 113 Malaysia GDP and Population, 2018-2019 ($)
Figure 114 Malaysia GDP – Composition of 2018, By Sector of Origin
Figure 115 Malaysia Export and Import Value & Volume, 2018-2019 ($)
Figure 116 Hong Kong Soda Ash MarketHong Kong 3D Printing Market Value & Volume, 2021-2026 ($)
Figure 117 Hong Kong GDP and Population, 2018-2019 ($)
Figure 118 Hong Kong GDP – Composition of 2018, By Sector of Origin
Figure 119 Hong Kong Export and Import Value & Volume, 2018-2019 ($)
Figure 120 Middle East & Africa Soda Ash MarketMiddle East & Africa 3D Printing Market Value & Volume, 2021-2026 ($)
Figure 121 Russia Soda Ash MarketRussia 3D Printing Market Value & Volume, 2021-2026 ($)
Figure 122 Russia GDP and Population, 2018-2019 ($)
Figure 123 Russia GDP – Composition of 2018, By Sector of Origin
Figure 124 Russia Export and Import Value & Volume, 2018-2019 ($)
Figure 125 Israel Soda Ash Market Value & Volume, 2021-2026 ($)
Figure 126 Israel GDP and Population, 2018-2019 ($)
Figure 127 Israel GDP – Composition of 2018, By Sector of Origin
Figure 128 Israel Export and Import Value & Volume, 2018-2019 ($)
Figure 129 Entropy Share, By Strategies, 2018-2019* (%)Soda Ash Market
Figure 130 Developments, 2018-2019*Soda Ash Market
Figure 131 Company 1 Soda Ash Market Net Revenue, By Years, 2018-2019* ($)
Figure 132 Company 1 Soda Ash Market Net Revenue Share, By Business segments, 2018 (%)
Figure 133 Company 1 Soda Ash Market Net Sales Share, By Geography, 2018 (%)
Figure 134 Company 2 Soda Ash Market Net Revenue, By Years, 2018-2019* ($)
Figure 135 Company 2 Soda Ash Market Net Revenue Share, By Business segments, 2018 (%)
Figure 136 Company 2 Soda Ash Market Net Sales Share, By Geography, 2018 (%)
Figure 137 Company 3Soda Ash Market Net Revenue, By Years, 2018-2019* ($)
Figure 138 Company 3Soda Ash Market Net Revenue Share, By Business segments, 2018 (%)
Figure 139 Company 3Soda Ash Market Net Sales Share, By Geography, 2018 (%)
Figure 140 Company 4 Soda Ash Market Net Revenue, By Years, 2018-2019* ($)
Figure 141 Company 4 Soda Ash Market Net Revenue Share, By Business segments, 2018 (%)
Figure 142 Company 4 Soda Ash Market Net Sales Share, By Geography, 2018 (%)
Figure 143 Company 5 Soda Ash Market Net Revenue, By Years, 2018-2019* ($)
Figure 144 Company 5 Soda Ash Market Net Revenue Share, By Business segments, 2018 (%)
Figure 145 Company 5 Soda Ash Market Net Sales Share, By Geography, 2018 (%)
Figure 146 Company 6 Soda Ash Market Net Revenue, By Years, 2018-2019* ($)
Figure 147 Company 6 Soda Ash Market Net Revenue Share, By Business segments, 2018 (%)
Figure 148 Company 6 Soda Ash Market Net Sales Share, By Geography, 2018 (%)
Figure 149 Company 7 Soda Ash Market Net Revenue, By Years, 2018-2019* ($)
Figure 150 Company 7 Soda Ash Market Net Revenue Share, By Business segments, 2018 (%)
Figure 151 Company 7 Soda Ash Market Net Sales Share, By Geography, 2018 (%)
Figure 152 Company 8 Soda Ash Market Net Revenue, By Years, 2018-2019* ($)
Figure 153 Company 8 Soda Ash Market Net Revenue Share, By Business segments, 2018 (%)
Figure 154 Company 8 Soda Ash Market Net Sales Share, By Geography, 2018 (%)
Figure 155 Company 9 Soda Ash Market Net Revenue, By Years, 2018-2019* ($)
Figure 156 Company 9 Soda Ash Market Net Revenue Share, By Business segments, 2018 (%)
Figure 157 Company 9 Soda Ash Market Net Sales Share, By Geography, 2018 (%)
Figure 158 Company 10 Soda Ash Market Net Revenue, By Years, 2018-2019* ($)
Figure 159 Company 10 Soda Ash Market Net Revenue Share, By Business segments, 2018 (%)
Figure 160 Company 10 Soda Ash Market Net Sales Share, By Geography, 2018 (%)
Figure 161 Company 11 Soda Ash Market Net Revenue, By Years, 2018-2019* ($)
Figure 162 Company 11 Soda Ash Market Net Revenue Share, By Business segments, 2018 (%)
Figure 163 Company 11 Soda Ash Market Net Sales Share, By Geography, 2018 (%)
Figure 164 Company 12 Soda Ash Market Net Revenue, By Years, 2018-2019* ($)
Figure 165 Company 12 Soda Ash Market Net Revenue Share, By Business segments, 2018 (%)
Figure 166 Company 12 Soda Ash Market Net Sales Share, By Geography, 2018 (%)
Figure 167 Company 13Soda Ash Market Net Revenue, By Years, 2018-2019* ($)
Figure 168 Company 13Soda Ash Market Net Revenue Share, By Business segments, 2018 (%)
Figure 169 Company 13Soda Ash Market Net Sales Share, By Geography, 2018 (%)
Figure 170 Company 14 Soda Ash Market Net Revenue, By Years, 2018-2019* ($)
Figure 171 Company 14 Soda Ash Market Net Revenue Share, By Business segments, 2018 (%)
Figure 172 Company 14 Soda Ash Market Net Sales Share, By Geography, 2018 (%)
Figure 173 Company 15 Soda Ash Market Net Revenue, By Years, 2018-2019* ($)
Figure 174 Company 15 Soda Ash Market Net Revenue Share, By Business segments, 2018 (%)
Figure 175 Company 15 Soda Ash Market Net Sales Share, By Geography, 2018 (%)