 Email
Email Print
Print


Sodium Carboxymethyl Cellulose Market - Forecast(2024 - 2030)
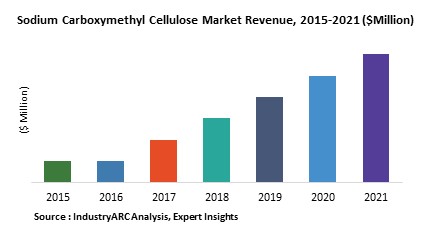
Sodium carboxymethyl cellulose commercially known as SCMC is a consolidant, all-purpose adhesive, and sizing agent. Due to its diversified usage the sales of SCMC has grown over the years. The global SCMC Market is $2.03B in 2017 and is estimated to grow at CAGR of 2.7% during 2018-2023. By application food & beverages hold the highest market share and generated revenue of $480.7M in 2017 and is estimated to grow at a CAGR of 3.4%.
What is Sodium Carboxymethyl Cellulose?
Sodium carboxymethyl cellulose is tasteless, odorless and non-toxic white powder or micro yellow fibrous in pure state. It is a polyionic cellulose compound and also a natural polymer derivative which is easily soluble in hot and cold water. It has very valuable and unusual chemical and physical properties which include thickening and emulsifying properties, as well as being difficult to get bad and being physiologically harmless. It is a natural polymer derivative with wide application.
What are the major applications for Sodium Carboxymethyl Cellulose?
Sodium carboxymethyl cellulose is most widely used in construction industry, toothpastes, detergents, ice creams, mining, textile design, hair color, henna, instant tattoos, ceramics, cosmetics, pharmaceuticals, paints, oil gas, and paper because of its high viscosity, good acid resistance and salt resistance, and water preservation
Market Research and Market Trends of Sodium Carboxymethyl cellulose
- Toothpaste manufacturers are now using the combination of CMC (carboxymethyl cellulose) and HEC (hydroxyethyl cellulose) in the high salt toothpastes to enhance the performance and also help in increasing the shelf-life of the toothpaste.
- SCMC is now used in floor production of cake fillings, moon cake, pastry, in bread production, and in drink production for the fresh effect, to reduce the water loss, and for the long preservation. Adding SCMC to these foods helps them to improve the taste, increase heat capacity and also some other characteristics.
- Increasing demand for cosmetics and personal care products from applications that’s include hair care, oral care and make up products is driving the market for SCMC.
- Bioengineered carboxymethyl cellulose-doxorubicin is now been used as a topical chemotherapy for melanoma skin cancer. This prodrug composed of CMC and DOX is offering promising results for skin disease applications associated with melanoma.
Who are the Major Players in Sodium carboxymethyl cellulose?
The companies referred in the market research report includes The Dow chemical company, Ashland Inc, CP kelco, Daicel corp, Akzo nobel, DKS Co ltd, Ugur seluloz kimya A.S.
What is our report scope?
The report incorporates in-depth assessment of the competitive landscape, product market sizing, product benchmarking, market trends, product developments, financial analysis, strategic analysis and so on to gauge the impact forces and potential opportunities of the market. Apart from this the report also includes a study of major developments in the market such as product launches, agreements, acquisitions, collaborations, mergers and so on to comprehend the prevailing market dynamics at present and its impact during the forecast period 2018-2024.
All our reports are customizable to your company needs to a certain extent, we do provide 20 free consulting hours along with purchase of each report, and this will allow you to request any additional data to customize the report to your needs.
Key Takeaways from this Report
- Evaluate market potential through analyzing growth rates (CAGR %), Volume (Units) and Value ($M) data given at country level – for product types, end use applications and by different industry verticals.
- Understand the different dynamics influencing the market – key driving factors, challenges and hidden opportunities.
- Get in-depth insights on your competitor performance – market shares, strategies, financial benchmarking, product benchmarking, SWOT and more.
- Analyze the sales and distribution channels across key geographies to improve top-line revenues.
- Understand the industry supply chain with a deep-dive on the value augmentation at each step, in order to optimize value and bring efficiencies in your processes.
- Get a quick outlook on the market entropy – M&A’s, deals, partnerships, product launches of all key players for the past 4 years.
- Evaluate the supply-demand gaps, import-export statistics and regulatory landscape for more than top 20 countries globally for the market.
1. Sodium Carboxymethyl Cellulose Market - Overview
1.1. Definitions and Scope
2. Sodium Carboxymethyl Cellulose Market - Executive summary
2.1. Market Revenue, Market Size and Key Trends by Company
2.2. Key Trends by type of Application
2.3. Key Trends segmented by Geography
3. Sodium Carboxymethyl Cellulose Market
3.1. Comparative analysis
3.1.1. Product Benchmarking - Top 10 companies
3.1.2. Top 5 Financials Analysis
3.1.3. Market Value split by Top 10 companies
3.1.4. Patent Analysis - Top 10 companies
3.1.5. Pricing Analysis
4. Sodium Carboxymethyl Cellulose Market – Startup companies Scenario Premium
4.1. Top 10 startup company Analysis by
4.1.1. Investment
4.1.2. Revenue
4.1.3. Market Shares
4.1.4. Market Size and Application Analysis
4.1.5. Venture Capital and Funding Scenario
5. Sodium Carboxymethyl Cellulose Market – Industry Market Entry Scenario Premium
5.1. Regulatory Framework Overview
5.2. New Business and Ease of Doing business index
5.3. Case studies of successful ventures
5.4. Customer Analysis – Top 10 companies
6. Sodium Carboxymethyl Cellulose Market Forces
6.1. Drivers
6.2. Constraints
6.3. Challenges
6.4. Porters five force model
6.4.1. Bargaining power of suppliers
6.4.2. Bargaining powers of customers
6.4.3. Threat of new entrants
6.4.4. Rivalry among existing players
6.4.5. Threat of substitutes
7. Sodium Carboxymethyl Cellulose Market -Strategic analysis
7.1. Value chain analysis
7.2. Opportunities analysis
7.3. Product life cycle
7.4. Suppliers and distributors Market Share
8. Sodium Carboxymethyl Cellulose Market – By Application (Market Size -$Million / $Billion)
8.1. Market Size and Market Share Analysis
8.2. Application Revenue and Trend Research
8.3. Product Segment Analysis
8.3.1. Drilling
8.3.2. Detergents
8.3.3. Hair color, henna
8.3.4. Mining
8.3.5. Textile dying
8.3.6. Instsant tattoo
8.3.7. Toothpastes
8.3.8. Ceramics
8.3.9. Ice cream
8.3.10. others
9. Sodium Carboxymethyl Cellulose – By End Use Industry(Market Size -$Million / $Billion)
9.1. Segment type Size and Market Share Analysis
9.2. Application Revenue and Trends by type of Application
9.3. Application Segment Analysis by Type
9.3.1. Introduction
9.3.2. Food & Beverage
9.3.3. Detergents
9.3.4. Pulp & Paper
9.3.5. Oil & Gas
9.3.6. Paints & Coatings
9.3.7. Pharmaceuticals
9.3.8. Cosmetics & Personal Care
9.3.9. Textile Industry
9.3.10. Construction industry
9.3.11. Daily chemical industry
10. Sodium Carboxymethyl Cellulose - By Geography (Market Size -$Million / $Billion)
10.1. Sodium Carboxymethyl Cellulose Market - North America Segment Research
10.2. North America Market Research (Million / $Billion)
10.2.1. Segment type Size and Market Size Analysis
10.2.2. Revenue and Trends
10.2.3. Application Revenue and Trends by type of Application
10.2.4. Company Revenue and Product Analysis
10.2.5. North America Product type and Application Market Size
10.2.5.1. U.S.
10.2.5.2. Canada
10.2.5.3. Mexico
10.2.5.4. Rest of North America
10.3. Sodium Carboxymethyl Cellulose - South America Segment Research
10.4. South America Market Research (Market Size -$Million / $Billion)
10.4.1. Segment type Size and Market Size Analysis
10.4.2. Revenue and Trends
10.4.3. Application Revenue and Trends by type of Application
10.4.4. Company Revenue and Product Analysis
10.4.5. South America Product type and Application Market Size
10.4.5.1. Brazil
10.4.5.2. Venezuela
10.4.5.3. Argentina
10.4.5.4. Ecuador
10.4.5.5. Peru
10.4.5.6. Colombia
10.4.5.7. Costa Rica
10.4.5.8. Rest of South America
10.5. Sodium Carboxymethyl Cellulose - Europe Segment Research
10.6. Europe Market Research (Market Size -$Million / $Billion)
10.6.1. Segment type Size and Market Size Analysis
10.6.2. Revenue and Trends
10.6.3. Application Revenue and Trends by type of Application
10.6.4. Company Revenue and Product Analysis
10.6.5. Europe Segment Product type and Application Market Size
10.6.5.1. U.K
10.6.5.2. Germany
10.6.5.3. Italy
10.6.5.4. France
10.6.5.5. Netherlands
10.6.5.6. Belgium
10.6.5.7. Spain
10.6.5.8. Denmark
10.6.5.9. Rest of Europe
10.7. Sodium Carboxymethyl Cellulose – APAC Segment Research
10.8. APAC Market Research (Market Size -$Million / $Billion)
10.8.1. Segment type Size and Market Size Analysis
10.8.2. Revenue and Trends
10.8.3. Application Revenue and Trends by type of Application
10.8.4. Company Revenue and Product Analysis
10.8.5. APAC Segment – Product type and Application Market Size
10.8.5.1. China
10.8.5.2. Australia
10.8.5.3. Japan
10.8.5.4. South Korea
10.8.5.5. India
10.8.5.6. Taiwan
10.8.5.7. Malaysia
11. Sodium Carboxymethyl Cellulose Market - Entropy
11.1. New product launches
11.2. M&A's, collaborations, JVs and partnerships
12. Sodium Carboxymethyl Cellulose Market – Industry / Segment Competition landscape Premium
12.1. Market Share Analysis
12.1.1. Market Share by Country- Top companies
12.1.2. Market Share by Region- Top 10 companies
12.1.3. Market Share by type of Application – Top 10 companies
12.1.4. Market Share by type of Product / Product category- Top 10 companies
12.1.5. Market Share at global level- Top 10 companies
12.1.6. Best Practices for companies
13. Sodium Carboxymethyl Cellulose Market – Key Company List by Country Premium
14. Sodium Carboxymethyl Cellulose Market Company Analysis
14.1. Market Share, Company Revenue, Products, M&A, Developments
14.2. The Dow chemical company
14.3. Ashland Inc
14.4. CP kelco
14.5. Daicel corp
14.6. Akzo nobel
14.7. DKS Co ltd
14.8. Ugur seluloz kimya A.S
14.9. Company 8
14.10. Company 9
14.11. Company 10 and more
"*Financials would be provided on a best efforts basis for private companies"
15. Sodium Carboxymethyl Cellulose Market - Appendix
15.1. Abbreviations
15.2. Sources
16. Sodium Carboxymethyl Cellulose Market - Methodology
16.1. Research Methodology
16.1.1. Company Expert Interviews
16.1.2. Industry Databases
16.1.3. Associations
16.1.4. Company News
16.1.5. Company Annual Reports
16.1.6. Application Trends
16.1.7. New Products and Product database
16.1.8. Company Transcripts
16.1.9. R&D Trends
16.1.10. Key Opinion Leaders Interviews
16.1.11. Supply and Demand Trends
List of Tables
Table 1: Sodium Carboxymethyl Cellulose Market Overview 2021-2026
Table 2: Sodium Carboxymethyl Cellulose Market Leader Analysis 2018-2019 (US$)
Table 3: Sodium Carboxymethyl Cellulose Market Product Analysis 2018-2019 (US$)
Table 4: Sodium Carboxymethyl Cellulose Market End User Analysis 2018-2019 (US$)
Table 5: Sodium Carboxymethyl Cellulose Market Patent Analysis 2013-2018* (US$)
Table 6: Sodium Carboxymethyl Cellulose Market Financial Analysis 2018-2019 (US$)
Table 7: Sodium Carboxymethyl Cellulose Market Driver Analysis 2018-2019 (US$)
Table 8: Sodium Carboxymethyl Cellulose Market Challenges Analysis 2018-2019 (US$)
Table 9: Sodium Carboxymethyl Cellulose Market Constraint Analysis 2018-2019 (US$)
Table 10: Sodium Carboxymethyl Cellulose Market Supplier Bargaining Power Analysis 2018-2019 (US$)
Table 11: Sodium Carboxymethyl Cellulose Market Buyer Bargaining Power Analysis 2018-2019 (US$)
Table 12: Sodium Carboxymethyl Cellulose Market Threat of Substitutes Analysis 2018-2019 (US$)
Table 13: Sodium Carboxymethyl Cellulose Market Threat of New Entrants Analysis 2018-2019 (US$)
Table 14: Sodium Carboxymethyl Cellulose Market Degree of Competition Analysis 2018-2019 (US$)
Table 15: Sodium Carboxymethyl Cellulose Market Value Chain Analysis 2018-2019 (US$)
Table 16: Sodium Carboxymethyl Cellulose Market Pricing Analysis 2021-2026 (US$)
Table 17: Sodium Carboxymethyl Cellulose Market Opportunities Analysis 2021-2026 (US$)
Table 18: Sodium Carboxymethyl Cellulose Market Product Life Cycle Analysis 2021-2026 (US$)
Table 19: Sodium Carboxymethyl Cellulose Market Supplier Analysis 2018-2019 (US$)
Table 20: Sodium Carboxymethyl Cellulose Market Distributor Analysis 2018-2019 (US$)
Table 21: Sodium Carboxymethyl Cellulose Market Trend Analysis 2018-2019 (US$)
Table 22: Sodium Carboxymethyl Cellulose Market Size 2018 (US$)
Table 23: Sodium Carboxymethyl Cellulose Market Forecast Analysis 2021-2026 (US$)
Table 24: Sodium Carboxymethyl Cellulose Market Sales Forecast Analysis 2021-2026 (Units)
Table 25: Sodium Carboxymethyl Cellulose Market, Revenue & Volume, By Application, 2021-2026 ($)
Table 26: Sodium Carboxymethyl Cellulose Market By Application, Revenue & Volume, By Drilling, 2021-2026 ($)
Table 27: Sodium Carboxymethyl Cellulose Market By Application, Revenue & Volume, By Detergents, 2021-2026 ($)
Table 28: Sodium Carboxymethyl Cellulose Market By Application, Revenue & Volume, By Hair color, henna, 2021-2026 ($)
Table 29: Sodium Carboxymethyl Cellulose Market By Application, Revenue & Volume, By Mining, 2021-2026 ($)
Table 30: Sodium Carboxymethyl Cellulose Market By Application, Revenue & Volume, By Textile dying, 2021-2026 ($)
Table 31: Sodium Carboxymethyl Cellulose Market, Revenue & Volume, By End user industry, 2021-2026 ($)
Table 32: Sodium Carboxymethyl Cellulose Market By End user industry, Revenue & Volume, By Food & Beverage, 2021-2026 ($)
Table 33: Sodium Carboxymethyl Cellulose Market By End user industry, Revenue & Volume, By Detergents, 2021-2026 ($)
Table 34: Sodium Carboxymethyl Cellulose Market By End user industry, Revenue & Volume, By Pulp & Paper, 2021-2026 ($)
Table 35: Sodium Carboxymethyl Cellulose Market By End user industry, Revenue & Volume, By Oil & Gas, 2021-2026 ($)
Table 36: Sodium Carboxymethyl Cellulose Market By End user industry, Revenue & Volume, By Paints & Coatings, 2021-2026 ($)
Table 37: North America Sodium Carboxymethyl Cellulose Market, Revenue & Volume, By Application, 2021-2026 ($)
Table 38: North America Sodium Carboxymethyl Cellulose Market, Revenue & Volume, By End user industry, 2021-2026 ($)
Table 39: South america Sodium Carboxymethyl Cellulose Market, Revenue & Volume, By Application, 2021-2026 ($)
Table 40: South america Sodium Carboxymethyl Cellulose Market, Revenue & Volume, By End user industry, 2021-2026 ($)
Table 41: Europe Sodium Carboxymethyl Cellulose Market, Revenue & Volume, By Application, 2021-2026 ($)
Table 42: Europe Sodium Carboxymethyl Cellulose Market, Revenue & Volume, By End user industry, 2021-2026 ($)
Table 43: APAC Sodium Carboxymethyl Cellulose Market, Revenue & Volume, By Application, 2021-2026 ($)
Table 44: APAC Sodium Carboxymethyl Cellulose Market, Revenue & Volume, By End user industry, 2021-2026 ($)
Table 45: Middle East & Africa Sodium Carboxymethyl Cellulose Market, Revenue & Volume, By Application, 2021-2026 ($)
Table 46: Middle East & Africa Sodium Carboxymethyl Cellulose Market, Revenue & Volume, By End user industry, 2021-2026 ($)
Table 47: Russia Sodium Carboxymethyl Cellulose Market, Revenue & Volume, By Application, 2021-2026 ($)
Table 48: Russia Sodium Carboxymethyl Cellulose Market, Revenue & Volume, By End user industry, 2021-2026 ($)
Table 49: Israel Sodium Carboxymethyl Cellulose Market, Revenue & Volume, By Application, 2021-2026 ($)
Table 50: Israel Sodium Carboxymethyl Cellulose Market, Revenue & Volume, By End user industry, 2021-2026 ($)
Table 51: Top Companies 2018 (US$)Sodium Carboxymethyl Cellulose Market, Revenue & Volume
Table 52: Product Launch 2018-2019Sodium Carboxymethyl Cellulose Market, Revenue & Volume
Table 53: Mergers & Acquistions 2018-2019Sodium Carboxymethyl Cellulose Market, Revenue & Volume
List of Figures
Figure 1: Overview of Sodium Carboxymethyl Cellulose Market 2021-2026
Figure 2: Market Share Analysis for Sodium Carboxymethyl Cellulose Market 2018 (US$)
Figure 3: Product Comparison in Sodium Carboxymethyl Cellulose Market 2018-2019 (US$)
Figure 4: End User Profile for Sodium Carboxymethyl Cellulose Market 2018-2019 (US$)
Figure 5: Patent Application and Grant in Sodium Carboxymethyl Cellulose Market 2013-2018* (US$)
Figure 6: Top 5 Companies Financial Analysis in Sodium Carboxymethyl Cellulose Market 2018-2019 (US$)
Figure 7: Market Entry Strategy in Sodium Carboxymethyl Cellulose Market 2018-2019
Figure 8: Ecosystem Analysis in Sodium Carboxymethyl Cellulose Market 2018
Figure 9: Average Selling Price in Sodium Carboxymethyl Cellulose Market 2021-2026
Figure 10: Top Opportunites in Sodium Carboxymethyl Cellulose Market 2018-2019
Figure 11: Market Life Cycle Analysis in Sodium Carboxymethyl Cellulose Market
Figure 12: GlobalBy ApplicationSodium Carboxymethyl Cellulose Market Revenue, 2021-2026 ($)
Figure 13: GlobalBy End user industrySodium Carboxymethyl Cellulose Market Revenue, 2021-2026 ($)
Figure 14: Global Sodium Carboxymethyl Cellulose Market - By Geography
Figure 15: Global Sodium Carboxymethyl Cellulose Market Value & Volume, By Geography, 2021-2026 ($)
Figure 16: Global Sodium Carboxymethyl Cellulose Market CAGR, By Geography, 2021-2026 (%)
Figure 17: North America Sodium Carboxymethyl Cellulose Market Value & Volume, 2021-2026 ($)
Figure 18: US Sodium Carboxymethyl Cellulose Market Value & Volume, 2021-2026 ($)
Figure 19: US GDP and Population, 2018-2019 ($)
Figure 20: US GDP – Composition of 2018, By Sector of Origin
Figure 21: US Export and Import Value & Volume, 2018-2019 ($)
Figure 22: Canada Sodium Carboxymethyl Cellulose Market Value & Volume, 2021-2026 ($)
Figure 23: Canada GDP and Population, 2018-2019 ($)
Figure 24: Canada GDP – Composition of 2018, By Sector of Origin
Figure 25: Canada Export and Import Value & Volume, 2018-2019 ($)
Figure 26: Mexico Sodium Carboxymethyl Cellulose Market Value & Volume, 2021-2026 ($)
Figure 27: Mexico GDP and Population, 2018-2019 ($)
Figure 28: Mexico GDP – Composition of 2018, By Sector of Origin
Figure 29: Mexico Export and Import Value & Volume, 2018-2019 ($)
Figure 30: South America Sodium Carboxymethyl Cellulose Market Value & Volume, 2021-2026 ($)
Figure 31: Brazil Sodium Carboxymethyl Cellulose Market Value & Volume, 2021-2026 ($)
Figure 32: Brazil GDP and Population, 2018-2019 ($)
Figure 33: Brazil GDP – Composition of 2018, By Sector of Origin
Figure 34: Brazil Export and Import Value & Volume, 2018-2019 ($)
Figure 35: Venezuela Sodium Carboxymethyl Cellulose Market Value & Volume, 2021-2026 ($)
Figure 36: Venezuela GDP and Population, 2018-2019 ($)
Figure 37: Venezuela GDP – Composition of 2018, By Sector of Origin
Figure 38: Venezuela Export and Import Value & Volume, 2018-2019 ($)
Figure 39: Argentina Sodium Carboxymethyl Cellulose Market Value & Volume, 2021-2026 ($)
Figure 40: Argentina GDP and Population, 2018-2019 ($)
Figure 41: Argentina GDP – Composition of 2018, By Sector of Origin
Figure 42: Argentina Export and Import Value & Volume, 2018-2019 ($)
Figure 43: Ecuador Sodium Carboxymethyl Cellulose Market Value & Volume, 2021-2026 ($)
Figure 44: Ecuador GDP and Population, 2018-2019 ($)
Figure 45: Ecuador GDP – Composition of 2018, By Sector of Origin
Figure 46: Ecuador Export and Import Value & Volume, 2018-2019 ($)
Figure 47: Peru Sodium Carboxymethyl Cellulose Market Value & Volume, 2021-2026 ($)
Figure 48: Peru GDP and Population, 2018-2019 ($)
Figure 49: Peru GDP – Composition of 2018, By Sector of Origin
Figure 50: Peru Export and Import Value & Volume, 2018-2019 ($)
Figure 51: Colombia Sodium Carboxymethyl Cellulose Market Value & Volume, 2021-2026 ($)
Figure 52: Colombia GDP and Population, 2018-2019 ($)
Figure 53: Colombia GDP – Composition of 2018, By Sector of Origin
Figure 54: Colombia Export and Import Value & Volume, 2018-2019 ($)
Figure 55: Costa Rica Sodium Carboxymethyl Cellulose Market Value & Volume, 2021-2026 ($)
Figure 56: Costa Rica GDP and Population, 2018-2019 ($)
Figure 57: Costa Rica GDP – Composition of 2018, By Sector of Origin
Figure 58: Costa Rica Export and Import Value & Volume, 2018-2019 ($)
Figure 59: Europe Sodium Carboxymethyl Cellulose Market Value & Volume, 2021-2026 ($)
Figure 60: U.K Sodium Carboxymethyl Cellulose Market Value & Volume, 2021-2026 ($)
Figure 61: U.K GDP and Population, 2018-2019 ($)
Figure 62: U.K GDP – Composition of 2018, By Sector of Origin
Figure 63: U.K Export and Import Value & Volume, 2018-2019 ($)
Figure 64: Germany Sodium Carboxymethyl Cellulose Market Value & Volume, 2021-2026 ($)
Figure 65: Germany GDP and Population, 2018-2019 ($)
Figure 66: Germany GDP – Composition of 2018, By Sector of Origin
Figure 67: Germany Export and Import Value & Volume, 2018-2019 ($)
Figure 68: Italy Sodium Carboxymethyl Cellulose Market Value & Volume, 2021-2026 ($)
Figure 69: Italy GDP and Population, 2018-2019 ($)
Figure 70: Italy GDP – Composition of 2018, By Sector of Origin
Figure 71: Italy Export and Import Value & Volume, 2018-2019 ($)
Figure 72: France Sodium Carboxymethyl Cellulose Market Value & Volume, 2021-2026 ($)
Figure 73: France GDP and Population, 2018-2019 ($)
Figure 74: France GDP – Composition of 2018, By Sector of Origin
Figure 75: France Export and Import Value & Volume, 2018-2019 ($)
Figure 76: Netherlands Sodium Carboxymethyl Cellulose Market Value & Volume, 2021-2026 ($)
Figure 77: Netherlands GDP and Population, 2018-2019 ($)
Figure 78: Netherlands GDP – Composition of 2018, By Sector of Origin
Figure 79: Netherlands Export and Import Value & Volume, 2018-2019 ($)
Figure 80: Belgium Sodium Carboxymethyl Cellulose Market Value & Volume, 2021-2026 ($)
Figure 81: Belgium GDP and Population, 2018-2019 ($)
Figure 82: Belgium GDP – Composition of 2018, By Sector of Origin
Figure 83: Belgium Export and Import Value & Volume, 2018-2019 ($)
Figure 84: Spain Sodium Carboxymethyl Cellulose Market Value & Volume, 2021-2026 ($)
Figure 85: Spain GDP and Population, 2018-2019 ($)
Figure 86: Spain GDP – Composition of 2018, By Sector of Origin
Figure 87: Spain Export and Import Value & Volume, 2018-2019 ($)
Figure 88: Denmark Sodium Carboxymethyl Cellulose Market Value & Volume, 2021-2026 ($)
Figure 89: Denmark GDP and Population, 2018-2019 ($)
Figure 90: Denmark GDP – Composition of 2018, By Sector of Origin
Figure 91: Denmark Export and Import Value & Volume, 2018-2019 ($)
Figure 92: APAC Sodium Carboxymethyl Cellulose Market Value & Volume, 2021-2026 ($)
Figure 93: China Sodium Carboxymethyl Cellulose Market Value & Volume, 2021-2026
Figure 94: China GDP and Population, 2018-2019 ($)
Figure 95: China GDP – Composition of 2018, By Sector of Origin
Figure 96: China Export and Import Value & Volume, 2018-2019 ($)Sodium Carboxymethyl Cellulose Market China Export and Import Value & Volume, 2018-2019 ($)
Figure 97: Australia Sodium Carboxymethyl Cellulose Market Value & Volume, 2021-2026 ($)
Figure 98: Australia GDP and Population, 2018-2019 ($)
Figure 99: Australia GDP – Composition of 2018, By Sector of Origin
Figure 100: Australia Export and Import Value & Volume, 2018-2019 ($)
Figure 101: South Korea Sodium Carboxymethyl Cellulose Market Value & Volume, 2021-2026 ($)
Figure 102: South Korea GDP and Population, 2018-2019 ($)
Figure 103: South Korea GDP – Composition of 2018, By Sector of Origin
Figure 104: South Korea Export and Import Value & Volume, 2018-2019 ($)
Figure 105: India Sodium Carboxymethyl Cellulose Market Value & Volume, 2021-2026 ($)
Figure 106: India GDP and Population, 2018-2019 ($)
Figure 107: India GDP – Composition of 2018, By Sector of Origin
Figure 108: India Export and Import Value & Volume, 2018-2019 ($)
Figure 109: Taiwan Sodium Carboxymethyl Cellulose Market Value & Volume, 2021-2026 ($)
Figure 110: Taiwan GDP and Population, 2018-2019 ($)
Figure 111: Taiwan GDP – Composition of 2018, By Sector of Origin
Figure 112: Taiwan Export and Import Value & Volume, 2018-2019 ($)
Figure 113: Malaysia Sodium Carboxymethyl Cellulose Market Value & Volume, 2021-2026 ($)
Figure 114: Malaysia GDP and Population, 2018-2019 ($)
Figure 115: Malaysia GDP – Composition of 2018, By Sector of Origin
Figure 116: Malaysia Export and Import Value & Volume, 2018-2019 ($)
Figure 117: Hong Kong Sodium Carboxymethyl Cellulose Market Value & Volume, 2021-2026 ($)
Figure 118: Hong Kong GDP and Population, 2018-2019 ($)
Figure 119: Hong Kong GDP – Composition of 2018, By Sector of Origin
Figure 120: Hong Kong Export and Import Value & Volume, 2018-2019 ($)
Figure 121: Middle East & Africa Sodium Carboxymethyl Cellulose Market Middle East & Africa 3D Printing Market Value & Volume, 2021-2026 ($)
Figure 122: Russia Sodium Carboxymethyl Cellulose Market Value & Volume, 2021-2026 ($)
Figure 123: Russia GDP and Population, 2018-2019 ($)
Figure 124: Russia GDP – Composition of 2018, By Sector of Origin
Figure 125: Russia Export and Import Value & Volume, 2018-2019 ($)
Figure 126: Israel Sodium Carboxymethyl Cellulose Market Value & Volume, 2021-2026 ($)
Figure 127: Israel GDP and Population, 2018-2019 ($)
Figure 128: Israel GDP – Composition of 2018, By Sector of Origin
Figure 129: Israel Export and Import Value & Volume, 2018-2019 ($)
Figure 130: Entropy Share, By Strategies, 2018-2019* (%)Sodium Carboxymethyl Cellulose Market
Figure 131: Developments, 2018-2019*Sodium Carboxymethyl Cellulose Market
Figure 132: Company 1 Sodium Carboxymethyl Cellulose Market Net Revenue, By Years, 2018-2019* ($)
Figure 133: Company 1 Sodium Carboxymethyl Cellulose Market Net Revenue Share, By Business segments, 2018 (%)
Figure 134: Company 1 Sodium Carboxymethyl Cellulose Market Net Sales Share, By Geography, 2018 (%)
Figure 135: Company 2 Sodium Carboxymethyl Cellulose Market Net Revenue, By Years, 2018-2019* ($)
Figure 136: Company 2 Sodium Carboxymethyl Cellulose Market Net Revenue Share, By Business segments, 2018 (%)
Figure 137: Company 2 Sodium Carboxymethyl Cellulose Market Net Sales Share, By Geography, 2018 (%)
Figure 138: Company 3 Sodium Carboxymethyl Cellulose Market Net Revenue, By Years, 2018-2019* ($)
Figure 139: Company 3 Sodium Carboxymethyl Cellulose Market Net Revenue Share, By Business segments, 2018 (%)
Figure 140: Company 3 Sodium Carboxymethyl Cellulose Market Net Sales Share, By Geography, 2018 (%)
Figure 141: Company 4 Sodium Carboxymethyl Cellulose Market Net Revenue, By Years, 2018-2019* ($)
Figure 142: Company 4 Sodium Carboxymethyl Cellulose Market Net Revenue Share, By Business segments, 2018 (%)
Figure 143: Company 4 Sodium Carboxymethyl Cellulose Market Net Sales Share, By Geography, 2018 (%)
Figure 144: Company 5 Sodium Carboxymethyl Cellulose Market Net Revenue, By Years, 2018-2019* ($)
Figure 145: Company 5 Sodium Carboxymethyl Cellulose Market Net Revenue Share, By Business segments, 2018 (%)
Figure 146: Company 5 Sodium Carboxymethyl Cellulose Market Net Sales Share, By Geography, 2018 (%)
Figure 147: Company 6 Sodium Carboxymethyl Cellulose Market Net Revenue, By Years, 2018-2019* ($)
Figure 148: Company 6 Sodium Carboxymethyl Cellulose Market Net Revenue Share, By Business segments, 2018 (%)
Figure 149: Company 6 Sodium Carboxymethyl Cellulose Market Net Sales Share, By Geography, 2018 (%)
Figure 150: Company 7 Sodium Carboxymethyl Cellulose Market Net Revenue, By Years, 2018-2019* ($)
Figure 151: Company 7 Sodium Carboxymethyl Cellulose Market Net Revenue Share, By Business segments, 2018 (%)
Figure 152: Company 7 Sodium Carboxymethyl Cellulose Market Net Sales Share, By Geography, 2018 (%)
Figure 153: Company 8 Sodium Carboxymethyl Cellulose Market Net Revenue, By Years, 2018-2019* ($)
Figure 154: Company 8 Sodium Carboxymethyl Cellulose Market Net Revenue Share, By Business segments, 2018 (%)
Figure 155: Company 8 Sodium Carboxymethyl Cellulose Market Net Sales Share, By Geography, 2018 (%)
Figure 156: Company 9 Sodium Carboxymethyl Cellulose Market Net Revenue, By Years, 2018-2019* ($)
Figure 157: Company 9 Sodium Carboxymethyl Cellulose Market Net Revenue Share, By Business segments, 2018 (%)
Figure 158: Company 9 Sodium Carboxymethyl Cellulose Market Net Sales Share, By Geography, 2018 (%)
Figure 159: Company 10 Sodium Carboxymethyl Cellulose Market Net Revenue, By Years, 2018-2019* ($)
Figure 160: Company 10 Sodium Carboxymethyl Cellulose Market Net Revenue Share, By Business segments, 2018 (%)
Figure 161: Company 10 Sodium Carboxymethyl Cellulose Market Net Sales Share, By Geography, 2018 (%)
Figure 162: Company 11 Sodium Carboxymethyl Cellulose Market Net Revenue, By Years, 2018-2019* ($)
Figure 163: Company 11 Sodium Carboxymethyl Cellulose Market Net Revenue Share, By Business segments, 2018 (%)
Figure 164: Company 11 Sodium Carboxymethyl Cellulose Market Net Sales Share, By Geography, 2018 (%)
Figure 165: Company 12 Sodium Carboxymethyl Cellulose Market Net Revenue, By Years, 2018-2019* ($)
Figure 166: Company 12 Sodium Carboxymethyl Cellulose Market Net Revenue Share, By Business segments, 2018 (%)
Figure 167: Company 12 Sodium Carboxymethyl Cellulose Market Net Sales Share, By Geography, 2018 (%)
Figure 168: Company 13 Sodium Carboxymethyl Cellulose Market Net Revenue, By Years, 2018-2019* ($)
Figure 169: Company 13 Sodium Carboxymethyl Cellulose Market Net Revenue Share, By Business segments, 2018 (%)
Figure 170: Company 13 Sodium Carboxymethyl Cellulose Market Net Sales Share, By Geography, 2018 (%)
Figure 171: Company 14 Sodium Carboxymethyl Cellulose Market Net Revenue, By Years, 2018-2019* ($)
Figure 172: Company 14 Sodium Carboxymethyl Cellulose Market Net Revenue Share, By Business segments, 2018 (%)
Figure 173: Company 14 Sodium Carboxymethyl Cellulose Market Net Sales Share, By Geography, 2018 (%)
Figure 174: Company 15 Sodium Carboxymethyl Cellulose Market Net Revenue, By Years, 2018-2019* ($)
Figure 175: Company 15 Sodium Carboxymethyl Cellulose Market Net Revenue Share, By Business segments, 2018 (%)
Figure 176: Company 15 Sodium Carboxymethyl Cellulose Market Net Sales Share, By Geography, 2018 (%)