Soy Lecithin Market - Forecast(2024 - 2030)

Report Code: CMR 0572 Report Format: PDF + Excel

Soy Lecithin Market Overview

The Soy Lecithin Market size is forecasted to reach US$712.4 million by 2027, after growing at an estimated CAGR of 4.6% during the forecast period 2022-2027. The soy lecithin is a naturally occurring fatty compound that is composed of phospholipids, which include phosphatidic acid, phosphatidylcholine, phosphatidylserine, phosphatidylethanolamine and other components, fatty acids and others. Soy lecithin has a wide range of applications in cosmetics, pharmaceuticals, textiles, construction and others because of its excellent functions as an emulsifying agent, a wetting agent, a lubricant and a release agent. The rising demand for soy lecithin in the food & beverage sector such as packaged foods, bakery goods, meat, confectioneries and others due to its superior emulsifying properties is anticipated to offer major growth opportunities in the Soy Lecithin Market during the forecast period. COVID-19 led to a major slowdown in the soy lecithin industry due to factors such as the closure of food & beverage outlets, halted production activities, raw material supply disruptions and other lockdown restrictions. However, with flourishing demand from major industries and recovery in the market, the demand for soy lecithin is anticipated to rise. This would offer rapid growth in the market and would contribute to the growing Soy Lecithin Market size during the forecast period.

Report Coverage

The “Soy Lecithin Market Report – Forecast (2022-2027)” by IndustryARC, covers an in-depth analysis of the following segments in the Soy Lecithin Industry.

By Form: Solid and Liquid.
By Grade: Pharmaceutical Grade, Industrial Grade, Food Grade and Others.
By Modification: Genetically Modified and Non-Genetically Modified.
By Application: Paints & Coatings, Rubber, Plastics, Detergents, Adhesives, Dyes, Pharmaceuticals, Printing Inks, Fabric Treatment and Others.
By End-Use Industry: Building & Construction (Commercial, Residential, Industrial and Infrastructural), Transportation (Aerospace, Automotive, Marine and Locomotive), Medical & Healthcare, Cosmetics & Personal Care (Face Care, Body Care, Lip Care and Others), Food & Beverage (Bakery Food, Dairy, Juice, Poultry, Animal Feed and Others), Textiles, Agriculture and Others.
By Geography: North America (the USA, Canada and Mexico), Europe (the UK, Germany, France, Italy, the Netherlands, Spain, Belgium and the Rest of Europe), Asia-Pacific (China, Japan, India, South Korea, Australia and New Zealand, Indonesia, Taiwan, Malaysia and the Rest of APAC), South America (Brazil, Argentina, Colombia, Chile and the Rest of South America) and the Rest of the World [the Middle-East (Saudi Arabia, the UAE, Israel and the Rest of the Middle-East) and Africa (South Africa, Nigeria and the Rest of Africa)].

Key Takeaways

  • North America dominates the Soy Lecithin industry due to the growing production base for soybeans, along with major advancements and development in healthcare, personal care, construction and others. These factors continue to boost market growth.
  • The Soy Lecithin Market size is growing because of the rising emphasis on biobased and organic lecithin products, high demand and applications across major end-use industries during the forecast period.
  • The liquid Soy Lecithin has excellent features such as blendability, viscosity control and emulsification, which boost its demand in the food & beverage sector.
  • However, the health risks associated with GMO Soy Lecithin such as allergies, vomit and others, along with rising soybean and Soy Lecithin prices hamper the growth of the market.

Figure: Soy Lecithin Market Revenue Share, By Geography, 2021 (%)

Soy Lecithin Market

For More Details on This Report - Request for Sample

Soy Lecithin Market Segment Analysis – by Form

The liquid segment held the largest Soy Lecithin Market share in 2021 and is forecasted to grow at an estimated CAGR of 4.2% during the forecast period 2022-2027. The liquid form of soy lecithin is high in demand as it smoothly blends with processed food products and removes a barrier. The soybean phospholipids consist of glycerophospholipids, phosphatidylethanolamine, phosphatidic acid, phosphatidylinositol, phosphatidylcholine, phosphatidylserine and sphingomyelin and have usage of liquid soy lecithin in food and beverage industry for bakery, soups and others. According to the India Brand Equity Foundation (IBEF), the food processing sector in India is estimated to reach US$535 billion by the year 2025-26. According to the U.S Department of Agriculture (USDA), the per capita consumption of baked products is 7.2 kg per year in China, 40.2kg in the United States and 22.5 kg in Japan. Moreover, the retail sale of baked goods in China is projected to grow to US$53 billion by 2025. With the robust consumption and growth of baked food items, the application of liquid soy lecithin as a flavor protector and antioxidant is rising, which is boosting the demand for soy lecithin in the food & beverage industry. Thus, the liquid Soy Lecithin form is anticipated to grow rapidly during the forecast period.

Soy Lecithin Market Segment Analysis – by End-use Industry

The food & beverage segment held the largest Soy Lecithin Market share in 2021 and is forecasted to grow at an estimated CAGR of 5.1% during the forecast period 2022-2027. Soy lecithin has a growing demand in the food & beverage sector due to flourishing applications in food items, confectioneries, meat & poultry, infant formulas, juices and others. The high demand for soy lecithin in the food and beverage industry is due to its superior properties such as emulsification, flavor protection and antioxidant features. According to the U.S Department of Agriculture (USDA), the full-service and fast-food restaurants, the two largest segments of the food service market accounted for 73.7% of all food-away-from-home sales in 2020. Furthermore, according to the Food & Drink Federation, the food and drink manufacturing business in the UK saw an increase of 7.9% in 2021 as compared to 2020. The flourishing food and beverage item production is boosting the growth of soy lecithin for a wide range of applications in the food and beverage industry, thereby contributing to the growth of the food and beverage segment in the Soy Lecithin market during the forecast period.

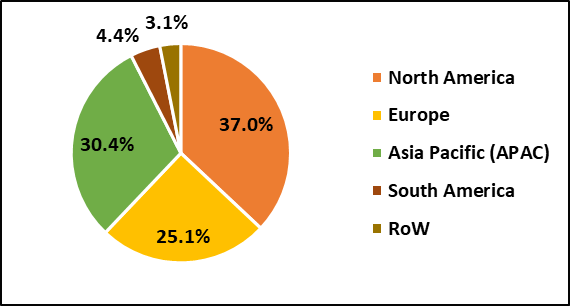
Soy Lecithin Market Segment Analysis – by Geography

North America held the largest Soy Lecithin Market share (up to 37%) in 2021, owing to the robust demand for soy lecithin from major end-use sectors such as medical & healthcare, cosmetics & personal care, food & beverage and others in this region. The robust growth in the pharmaceutical sector is driving the Soy Lecithin Market, owing to major healthcare development, drug development activities and others. According to the International Federation of Pharmaceutical Manufacturers & Associations (IFPMA), the estimated growth of the pharmaceutical sector for 2022 was 5.4% in North America. Furthermore, according to World Bank data, health expenditure in North America accounted for 16.32% of the GDP in 2019. The cosmetics and personal care sector is also rapidly growing in North America and contributes majorly to the growth of soy lecithin. According to the L'OREAL Annual Report 2021, the growth of like-for-like sales in cosmetics accounted for 22.2% compared to negative 7.4% like-for-like sales in 2020. The North American region held a 25% share in L'OREAL sales in 2021. Moreover, with a flourishing base for soy lecithin and soy production in the North American region, the demand for soy lecithin in North America is growing. Thus, the North American Soy Lecithin Market would grow rapidly during the forecast period. 

Soy Lecithin Market Drivers

Flourishing Application in the Cosmetics and Personal Care Industry:

Soy Lecithin has a rising demand in the cosmetics & personal care industry for a wide range of applications in skin care products (such as facial creams, lotions, cleansers and others), hair care products, primers, lip balms and others due to its superior functions such as emollient, emulsifying agent, viscosity control and others. Cosmetics & personal care is growing rapidly due to flourishing trend and production for beauty products, owing to high demand majorly from female users. According to the International Trade Administration, the beauty and personal care sector in Thailand is projected to grow at 5.5% through 2025. Moreover, as per the annual report 2021 by LOREAL, the annual revenue for cosmetics in 2021 accounted for US$34.57 billion compared to US$29.88 billion in 2020. Skincare held a share of 42%, haircare of 22% and hygiene products of 10% in 2020. With the rise in the cosmetics and personal care products such as skincare, haircare and others, the demand for soy lecithin for various applications in the cosmetics and personal care sector is flourishing, thereby driving the market and offering major growth opportunities in the Soy Lecithin industry.

Increasing Demand from the Medical & Healthcare Sector:

Soy Lecithin is composed of phospholipids, which include phosphatidic acid, phosphatidylcholine, phosphatidylserine, phosphatidylethanolamine and other components. It has flourishing applications in the healthcare sector for medications, natural supplements and drugs used in the treatment of liver disease, controlling high cholesterol and others. The medical industry is growing rapidly owing to flourishing development in healthcare infrastructure, increasing incidents of chronic disorder cases and high growth in drug development and advancements. According to the Indian Economic Survey, the domestic pharmaceutical industry in India is anticipated to reach US$65 billion by 2024 and further expand to US$125-130 billion by 2030. According to the Germany Trade and Investment (GTAI), the vitamin & minerals supplement OTC medications held US$1,189 million and joint pain treatment medications were US$1,498 million in the pharmacy segment in Europe 2019. With the high demand for over-the-counter (OTC) medications and supplements, the demand for soy lecithin in the medical and healthcare industry for dietary supplements, medications and other OTC drugs is rising, thereby driving the market.

Soy Lecithin Market Challenges

Health Issues and Rise in Soy Prices Hinder the Growth:

The genetically modified (GMO) Soy Lecithin is considered hazardous and is prone to various allergic reactions and health hazards such as gastrointestinal problems, low blood pressure, vomit and others. Moreover, the hike in the prices of soybean creates a challenge in the market as it affects the demand, supply and production trends in the industry. The soy prices are soaring and the Soybean Futures Trading was US$45.10 per quintal in October 2020, which spiraled to US$79.90 per quintal in August 2021 in India. Furthermore, Lasenor, a manufacturer of soy lecithin, stated that the prices for the non-GM IP soya lecithin rose from 6% to 9% when compared to 2020 and 2021. Thus, with major health risks and price rises associated with soy lecithin, the Soy Lecithin Market faces a slowdown and growth hamper.

Soy Lecithin Industry Outlook

Technology launches, acquisitions and R&D activities are key strategies players adopt in the Soy Lecithin Market. The top 10 companies in the Soy Lecithin Market are:

  1. American Lecithin Company
  2. Lipoid GmbH
  3. DuPont de Nemours Inc.
  4. Sonic Biochem Extractions
  5. Cargill Inc.
  6. NOW Foods
  7. Wilmar International
  8. LECICO GmbH
  9. Praan Naturals
  10. Lasenor Emul S.L.

Recent Developments

  • In September 2021, AAK acquired BIC Ingredients, the lecithin arm of BIC International Holdings. The company deals with sunflower, soy, rapeseed and other organic lecithins. The acquisition aimed to hold boost the product portfolio in specialty lecithin and offer reliable solutions in food, Pharma, cosmetics and others.
  • In September 2019, Praan Naturals launched the organic soy lecithin powder and liquid for usage in the cosmetics and personal care sector. The product launch aimed to expand the product portfolio and diversify applications in cosmetics for skin care, nail care, hair care and others.
  • In February 2019, Lasenor Emul, SL., and Simmons Grain Co. formed a joint venture named Lasenor USA LLC. The joint venture aimed to boost the production of full set organic soy lecithin products, which have major use in food and non-food applications. Thus, it offered a major growth in the market.

Relevant Reports

Lecithin & Phospholipids Market - Industry Analysis, Market Size, Share, Trends, Application Analysis, Growth and Forecast Analysis

Report Code: FBR 95554

Lecithin Market - Industry Analysis, Market Size, Share, Trends, Application Analysis, Growth and Forecast Analysis

Report Code: FBR 0061

Emulsifier Market - Industry Analysis, Market Size, Share, Trends, Application Analysis, Growth and Forecast Analysis

Report Code: CMR 16976

For more Chemicals and Materials Market reports, please click here

1. Soy Lecithin Market - Market Overview
    1.1 Definitions and Scope
2. Soy Lecithin Market - Executive Summary
    2.1 Key Trends by Form
    2.2 Key Trends by Grade
    2.3 Key Trends by Modification
    2.4 Key Trends by Application
    2.5 Key Trends by End-use Industry
    2.6 Key Trends by Geography
3. Soy Lecithin Market – Comparative analysis
    3.1 Market Share Analysis - Major Companies
    3.2 Product Benchmarking - Major Companies
    3.3 Top 5 Financials Analysis
    3.4 Patent Analysis- Major Companies
    3.5 Pricing Analysis (ASPs will be provided)
4. Soy Lecithin Market - Startup companies Scenario Premium Premium
    4.1 Major startup company analysis:
        4.1.1 Investment
        4.1.2 Revenue
        4.1.3 Product portfolio
        4.1.4 Venture Capital and Funding Scenario
5. Soy Lecithin Market – Industry Market Entry Scenario Premium Premium
    5.1 Regulatory Framework Overview
    5.2 New Business and Ease of Doing Business Index
    5.3 Successful Venture Profiles
    5.4 Customer Analysis – Major companies
6. Soy Lecithin Market - Market Forces
    6.1 Market Drivers
    6.2 Market Constraints
    6.3 Porter's Five Force Model
        6.3.1 Bargaining Power of Suppliers
        6.3.2 Bargaining Powers of Buyers
        6.3.3 Threat of New Entrants
        6.3.4 Competitive Rivalry
        6.3.5 Threat of Substitutes
7. Soy Lecithin Market – Strategic Analysis
    7.1 Value/Supply Chain Analysis
    7.2 Opportunity Analysis
    7.3 Product/Market Life Cycle
    7.4 Distributor Analysis – Major Companies
8. Soy Lecithin Market – by Form (Market Size - US$ Million/Billion)
    8.1 Solid
    8.2 Liquid
9. Soy Lecithin Market – by Grade (Market Size - US$ Million/Billion)
    9.1 Pharmaceutical Grade
    9.2 Industrial Grade
    9.3 Food Grade
    9.4 Others
10. Soy Lecithin Market – by Modification Type (Market size – US$ Million/Billion)
    10.1 Genetically Modified
    10.2 Non-Genetically Modified
11. Soy Lecithin Market – by Application (Market size – US$ Million/Billion)
    11.1 Paints & Coatings
    11.2 Rubber
    11.3 Plastics
    11.4 Detergents
    11.5 Adhesives
    11.6 Dyes
    11.7 Pharmaceuticals
    11.8 Printing Inks
    11.9 Fabric Treatment
    11.10 Others
12. Soy Lecithin Market - by End-use Industry (Market Size - US$ Million/Billion)
    12.1 Building & Construction
        12.1.1 Commercial
        12.1.2 Residential
        12.1.3 Industrial
        12.1.4 Infrastructural
    12.2 Transportation
        12.2.1 Aerospace
        12.2.2 Automotive
        12.2.3 Marine
        12.2.4 Locomotive
    12.3 Medical & Healthcare
    12.4 Cosmetics & Personal Care
        12.4.1 Face Care
        12.4.2 Body Care
        12.4.3 Lip Care
        12.4.4 Others
    12.5 Food & Beverage
        12.5.1 Bakery Food
        12.5.2 Dairy
        12.5.3 Juice
        12.5.4 Poultry
        12.5.5 Animal Feed
        12.5.6 Others
    12.6 Textiles
    12.7 Agriculture
    12.8 Others
13. Soy Lecithin Market - by Geography (Market Size - US$ Million/Billion)
    13.1 North America
        13.1.1 The USA
        13.1.2 Canada
        13.1.3 Mexico
    13.2 Europe
        13.2.1 The UK
        13.2.2 Germany
        13.2.3 France
        13.2.4 Italy
        13.2.5 The Netherlands
        13.2.6 Spain
        13.2.7 Belgium
        13.2.8 The Rest of Europe
    13.3 Asia-Pacific
        13.3.1 China
        13.3.2 Japan
        13.3.3 India
        13.3.4 South Korea
        13.3.5 Australia and New Zeeland
        13.3.6 Indonesia
        13.3.7 Taiwan
        13.3.8 Malaysia
        13.3.9 The Rest of APAC
    13.4 South America
        13.4.1 Brazil
        13.4.2 Argentina
        13.4.3 Colombia
        13.4.4 Chile
        13.4.5 The Rest of South America
    13.5 The Rest of the World
        13.5.1 The Middle-East
            13.5.1.1 Saudi Arabia
            13.5.1.2 The UAE
            13.5.1.3 Israel
            13.5.1.4 The Rest of the Middle-East
        13.5.2 Africa
            13.5.2.1 South Africa
            13.5.2.2 Nigeria
            13.5.2.3 The Rest of Africa
14. Soy Lecithin Market – Entropy
    14.1 New Product Launches
    14.2 M&As, Collaborations, JVs and Partnerships
15. Soy Lecithin Market – Industry/Competition Segment Analysis Premium
    15.1 Company Benchmarking Matrix – Major Companies
    15.2 Market Share at Global Level - Major companies
    15.3 Market Share by Key Region - Major companies
    15.4 Market Share by Key Country - Major companies
    15.5 Market Share by Key Application - Major companies
    15.6 Market Share by Key Product Type/Product category - Major companies
16. Soy Lecithin Market – Key Company List by Country Premium Premium
17. Soy Lecithin Market Company Analysis - Business Overview, Product Portfolio, Financials and Developments
    17.1 Company 1
    17.2 Company 2
    17.3 Company 3
    17.4 Company 4
    17.5 Company 5
    17.6 Company 6
    17.7 Company 7
    17.8 Company 8
    17.9 Company 9
    17.10 Company 10 and more
* "Financials would be provided to private companies on best-efforts basis."
Connect with our experts to get customized reports that best suit your requirements. Our reports include global-level data, niche markets and competitive landscape.
List of Tables:

Table 1: Leading Manufactures in Global Soup Market, 2015
Table 2: Distributors in Global Soup Market, 2015
Table 3: Global Soy Lecithin Market Revenue, By Type, 2016-2022 ($Million)
Table 4: Global Soy Lecithin Market Revenue, By Modification, 2016-2022 ($Million)
Table 5: Global Soy Lecithin Market Revenue, By End Use Industry, 2016-2022 ($Million)
Table 6: Americas: Soy Lecithin Market Revenue, By End-User Industry, 2016-2022 ($Million)
Table 7: Americas: Soy Lecithin Market Revenue, By Modification, 2016-2022 ($Million)
Table 8: Americas: Soy Lecithin Market Revenue, By Type, 2016-2022 ($Million)
Table 9: U.S.: GDP – Composition of 2015, By End Use
Table 10: Canada : GDP – Composition of 2015, By End Use
Table 11: Mexico: GDP – Composition of 2015, By End Use
Table 12: Europe: Soy Lecithin Market Revenue, By Type, 2016-2022 ($Million)
Table 13: Europe: Soy Lecithin Market Revenue, By Modification, 2016-2022 ($Million)
Table 14: Europe: Soy Lecithin Market Revenue, By End-Use Industry, 2016-2022 ($Million)
Table 15: U.K.: GDP – Composition of 2015, By End Use
Table 16: Germany: GDP – Composition of 2015, By End Use
Table 17: France: GDP – Composition of 2015, By End Use
Table 18: Italy : GDP – Composition of 2015, By End Use
Table 19: Spain: GDP – Composition of 2015, By End Use
Table 20: Asia Pacific Soy Lecithin Market Revenue, By Type, 2016-2022 ($Million)
Table 21: Asia Pacific Soy Lecithin Market Revenue, By Modification, 2016-2022 ($Million)
Table 22: Asia Pacific: Soy Lecithin Market Revenue, By End Use Industry, 2016-2022 ($Million)
Table 23: China: GDP – Composition of 2015, By End Use
Table 24: Japan: GDP – Composition of 2015, By End Use
Table 25: India: GDP – Composition of 2015, By End Use
Table 26: Australia: GDP – Composition of 2015, By End Use
Table 27: RoW: Soy Lecithin Market Revenue, By Type, 2016-2022 ($Million)
Table 28: RoW: Soy Lecithin Market Revenue, By Modification, 2016-2022 ($Million)
Table 29: RoW: Soy Lecithin Market Revenue, By End-Use Industry, 2015-2022 ($Million)


List of Figures:

Figure 1: Soy Lecithin Market Revenue, 2016, 2022 ($Million)
Figure 2: Soy Lecithin Market Revenue, By Type, 2016, 2022 ($Million)
Figure 3: Soy Lecithin Market Revenue Growth Rate, By Modification, 2018-2022 ($Million)
Figure 4: Soy Lecithin Market Revenue, By Modification, 2016-2022 ($Million)
Figure 5: Soy Lecithin Market Revenue, By Geography, 2016,2022 ($Million)
Figure 6: Soy Lecithin Market Revenue Share, By Company, 2016 (%)
Figure 7: Number of Patents Granted, 2012-2016
Figure 8: Number of Patents Granted, 2012-2016
Figure 9: E. I. DU Pont De Nemours And Company
Figure 10: Cargill Inc.
Figure 11: Archer Daniels Midland Company
Figure 12: Bunge Limited
Figure 13: EPS, By Company, 2013-2015 ($)
Figure 14: INDUSTRY PRICING ANALYSIS: ASP, BY MODIFICATION ($) 
Figure 15: De-Oiled: Soy Lecithin Market Revenue, 2016-2022 ($Million)
Figure 16: Fractionated Modified: Soy Lecithin Market Revenue, 2016-2022 ($Million)
Figure 17: Standardized: Soy Lecithin Market Revenue, 2016-2022 ($Million)
Figure 18: Others: Soy Lecithin Market Revenue, 2016-2022 ($Million)
Figure 19: Genetically Modified: Soy Lecithin Market Revenue, 2016-2022 ($Million)
Figure 20: Non-Genetically Modified: Soy Lecithin Market Revenue, 2016-2022 ($Million)
Figure 21: Food & Beverage: Global Soy Lecithin Market Revenue,2016-2022 ($Million)
Figure 22: Bakery &Confectionary: Global Soy Lecithin Market Revenue,2016-2022 ($Million)
Figure 23: Convenience Food: Global Soy Lecithin Market Revenue,2016-2022 ($Million)
Figure 24: Meat & Poultry: Global Soy Lecithin Market Revenue,2016-2022 ($Million)
Figure 25: Others: Global Soy Lecithin Market Revenue,2016-2022 ($Million)
Figure 26: Animal Feed Industry: Global Soy Lecithin Market Revenue,2016-2022 ($Million)
Figure 27: Ruminants: Global Soy Lecithin Market Revenue,2016-2022 ($Million)
Figure 28: Poultry: Global Soy Lecithin Market Revenue,2016-2022 ($Million)
Figure 29: Aquaculture: Global Soy Lecithin Market Revenue,2016-2022 ($Million)
Figure 30: Swine: Global Soy Lecithin Market Revenue,2016-2022 ($Million)
Figure 31: Equine: Global Soy Lecithin Market Revenue,2016-2022 ($Million)
Figure 32: Pets : Global Soy Lecithin Market Revenue,2016-2022 ($Million)
Figure 33: Others : Global Soy Lecithin Market Revenue,2016-2022 ($Million)
Figure 34: Pharmaceutical: Global Soy Lecithin Market Revenue,2016-2022 ($Million)
Figure 35: Plastic Industry: Global Soy Lecithin Market Revenue,2016-2022 ($Million)
Figure 36: Paint Industry : Global Soy Lecithin Market Revenue,2016-2022 ($Million)
Figure 37: Others: Global Soy Lecithin Market Revenue,2016-2022 ($Million)
Figure 38: Global Soy Lecithin Market Revenue, By Geography, 2015,2022 ($Million) 
Figure 39: Americas: Soy Lecithin Market CAGR, By Country, 2018-2022 (%)
Figure 40: U.S.: GDP and Population, 2012-2015 ($Trillion, Million)
Figure 41: U.S.: GDP – Composition of 2015, By Sector of Origin
Figure 42: U.S.: Export and Import Value, 2012-2015 ($Trillion)
Figure 43: Canada: GDP and Population, 2012-2015 ($Trillion, Million)
Figure 44: Canada: GDP – Composition of 2015, By Sector of Origin
Figure 45: Canada : Export and Import Value, 2012-2015 ($Billion)
Figure 46: Mexico: GDP and Population, 2012-2015 ($Trillion, Million)
Figure 47: Mexico: GDP – Composition of 2015, By Sector of Origin
Figure 48: Mexico: Export and Import Value, 2012-2015 ($Billion)
Figure 49: U.S.: Soy Lecithin Market Revenue, 2016-2022 ($Million)
Figure 50: Canada: Soy Lecithin Market Revenue, 2016-2022 ($Million)
Figure 51: Brazil: Soy Lecithin Market Revenue, 2016-2022 ($Million)
Figure 52: Mexico: Soy Lecithin Market Revenue, 2016-2022 ($Million)
Figure 53: Argentina: Soy Lecithin Market Revenue, 2016-2022 ($Million)
Figure 54: Uruguay: Soy Lecithin Market Revenue, 2016-2022 ($Million)
Figure 55: Others: Soy Lecithin Market Revenue, 2016-2022 ($Million)
Figure 56: Europe: Soy Lecithin Market CAGR, By Country, 2018-2022 (%)
Figure 57: U.K.: GDP and Population, 2012-2015 ($Trillion, Million)
Figure 58: U.K.: GDP – Composition of 2015, By Sector of Origin
Figure 59: U.K.: Export and Import Value, 2012-2015 ($Billion)
Figure 60: Germany: GDP and Population, 2012-2015 ($Trillion, Million)
Figure 61: Germany: GDP – Composition of 2015, By Sector of Origin
Figure 62: Germany: Export and Import Value, 2012-2015 ($Billion)
Figure 63: France: GDP and Population, 2012-2015 ($Trillion, Million)
Figure 64: France: GDP – Composition of 2015, By Sector of Origin
Figure 65: France: Export and Import Value, 2012-2015 ($Billion)
Figure 66: Italy: GDP and Population, 2012-2015 ($Trillion, Million)
Figure 67: Italy: GDP – Composition of 2015, By Sector of Origin
Figure 68: Italy : Export and Import Value, 2012-2015 ($Billion)
Figure 69: Spain: GDP and Population, 2012-2015 ($Trillion, Million)
Figure 70: Spain: GDP – Composition of 2015, By Sector of Origin
Figure 71: Spain: Export and Import Value, 2012-2015 ($Billion)
Figure 72: U.K.: Soy Lecithin Market Revenue, 2016-2022 ($Million)
Figure 73: Germany.: Soy Lecithin Market Revenue, 2016-2022 ($Million)
Figure 74: France: Soy Lecithin Market Revenue, 2016-2022 ($Million)
Figure 75: Italy: Soy Lecithin Market Revenue, 2016-2022 ($Million)
Figure 76: Spain: Soy Lecithin Market Revenue, 2016-2022 ($Million)
Figure 77: Russia: Soy Lecithin Market Revenue, 2016-2022 ($Million)
Figure 78: Rest of Europe: Soy Lecithin Market Revenue, 2016-2022 ($Million)
Figure 79: Asia Pacific: Soy Lecithin Market CAGR, By Country, 2018-2022 (%)
Figure 80: China: GDP and Population, 2012-2015 ($Trillion, Million)
Figure 81: China: GDP – Composition of 2015, By Sector of Origin
Figure 82: China: Export and Import Value, 2012-2015 ($Billion)
Figure 83: Japan: GDP and Population, 2012-2015 ($Trillion, Million)
Figure 84: Japan: GDP – Composition of 2015, By Sector of Origin
Figure 85: Japan: Export and Import Value, 2012-2015 ($Billion)
Figure 86: India: GDP and Population, 2012-2015 ($Trillion, Million)
Figure 87: India: GDP – Composition of 2015, By Sector of Origin
Figure 88: India: Export and Import Value, 2012-2015 ($Billion)
Figure 89: Australia: GDP and Population, 2012-2015 ($Trillion, Million)
Figure 90: Australia: GDP – Composition of 2015, By Sector of Origin
Figure 91: Australia: Export and Import Value, 2012-2015 ($Billion)
Figure 92: China: Soy Lecithin Market Revenue, 2016-2022 ($Million)
Figure 93: India: Soy Lecithin Market Revenue, 2016-2022 ($Million)
Figure 94: Japan: Soy Lecithin Market Revenue, 2016-2022 ($Million)
Figure 95: Australia & New Zealand: Soy Lecithin Market Revenue, 2016-2022 ($Million)
Figure 96: Rest of Asia-Pacific: Soy Lecithin Market Revenue, 2016-2022 ($Million)
Figure 97: RoW Soy Lecithin Market CAGR, By Country, 2018-2022 (%)
Figure 98: Middle East: Soy Lecithin Market Revenue, 2015-2023 ($Million)
Figure 99: Africa: Soy Lecithin Market Revenue, 2015-2023 ($Million)
Figure 100: Soy Lecithin Market Entropy Share, By Strategies, 2012-2018* (%)
Figure 101: Archer Daniels Midland Company Net Revenue, By Years, 2012-2015 ($Billion)
Figure 102: Archer Daniels Midland Company Net Revenue Share, By Business segments, 2015 (%)
Figure 103: Archer Daniels Midland Company Net Revenue Share, By Geography, 2015 (%)
Figure 104: Bunge Limited Net Sales, By Years, 2014-2016 ($ M)
Figure 105: Bunge Limited Net Sales Share, By Business Segments, 2015 (%)
Figure 106: Cargill Inc. Net Sales, By Years, 2014-2016 ($ Bn)
Figure 107: Cargill Inc. Net Sales Share, By Geography, 201 (%)
Figure 108: E. I. DU Pont De Nemours and Co Net Sales, By Years, 2014-2016 ($ Bn)
Figure 109: E. I. DU Pont De Nemours and Co Net Sales Share, By Business segments, 2015 (%)
Figure 110: E. I. DU Pont De Nemours and Co Net Sales Share, By Geography, 2015 (%)
Figure 111: Lecico GMBH. Net Sales, By Years, 2013-2015 ($ M)
Figure 112: Lecico GMBH. Net Sales Share, By Geography, 2015 (%)
Figure 113: Ruchi Soya Industries Ltd. Net Sales, By Years, 2014-2016 ($ M)
Figure 114: Ruchi Soya Industries Ltd. Net Sales Share, By Business Segments, 2015 (%)