 Email
Email Print
Print


Telemedicine Technologies Market - Forecast(2024 - 2030)
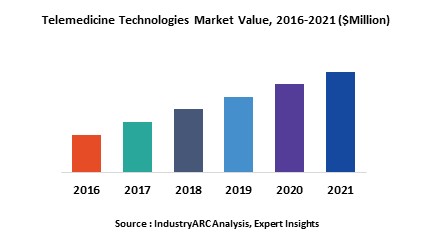
Telemedicine can be defined as the use of telecommunication and information technology to provide clinical health care services from a distance. Telemedicine helps in eliminating distance barriers between physician or healthcare service provider and patients and helps in improving access to medical services which would otherwise be difficult to make consistently available in distant rural communities. It is also used to save lives in critical care and emergency situations. Globally increasing internet penetration and usage technologies into healthcare practices is expected to drive the demand for the telemedicine technologies during the period of study.
Geographically, North America dominates the telemedicine technologies market driven by best in class infrastructure, best in industry practices, higher technological usage by citizen & doctors and higher spending by the citizens towards healthcare expenditure. North America was followed by Europe and Asia-Pacific as second and third largest markets for the telemedicine technologies market. Asia Pacific is projected to have the fastest growth, owing to rapidly developing medical infrastructure, increasing medical tourism, increased spending, and increasing awareness amongst population in developing nations such as China and India in this region.
This report identifies the telemedicine technologies market size in for the year 2014-2016, and forecast of the same for year 2021. It also highlights the market drivers, restraints, growth indicators, challenges, and other key aspects with respect to global telemedicine technologies market.
This report segments the telemedicine technologies market on the basis of applications, category and regional market as follows:
Sample Companies profiled in this report are:
Geographically, North America dominates the telemedicine technologies market driven by best in class infrastructure, best in industry practices, higher technological usage by citizen & doctors and higher spending by the citizens towards healthcare expenditure. North America was followed by Europe and Asia-Pacific as second and third largest markets for the telemedicine technologies market. Asia Pacific is projected to have the fastest growth, owing to rapidly developing medical infrastructure, increasing medical tourism, increased spending, and increasing awareness amongst population in developing nations such as China and India in this region.
This report identifies the telemedicine technologies market size in for the year 2014-2016, and forecast of the same for year 2021. It also highlights the market drivers, restraints, growth indicators, challenges, and other key aspects with respect to global telemedicine technologies market.
This report segments the telemedicine technologies market on the basis of applications, category and regional market as follows:
- Telemedicine Technologies Market research report is classified on the basis of applications. Some of the major applications covered in this report are as follows: Telecardiology, Teleradiology, Telepathology,Telepsychiatry, Dermatology
- Telemedicine Technologies Market research report is classified on the basis of category. Some of the major categories covered in this report are as follows: Hardware, Software and Network
- This report has been further segmented into major regions, which includes detailed analysis of each region such as: North America, Europe, Asia-Pacific (APAC), and Rest of the World (RoW) covering all the major country level markets in each of the region
Sample Companies profiled in this report are:
- Aerotel Medical Systems Ltd.
- International Business Machines Corp.
- Intouch Technologies
- Medical International Research
- 3m Health Information Systems
- 10+.
1. Telemedicine Technologies Market – Overview
2. Executive Summary
3. Telemedicine Technologies Market Landscape
3.1. Market Share Analysis
3.2. Comparative Analysis
3.3. Product Benchmarking
3.4. End User Profiling
3.5. Top 5 Financials Analysis
4. Telemedicine Technologies Market– Forces
4.1. Drivers
4.1.1. Increasing penetration of technology in healthcare practices
4.2. Restraints
4.3. Opportunities
4.4. Challenges
4.5. Porter’s Five Forces Analysis
4.5.1. Bargaining Power of Suppliers
4.5.2. Bargaining Power of Buyers
4.5.3. Threat of New Entrants
4.5.4. Threat of Substitutes
4.5.5. Degree of Competition
5. Telemedicine Technologies Market– Strategic Analysis
5.1. Value Chain Analysis
5.2. Pricing Analysis
5.3. Opportunities Analysis
5.4. Product/Market Life Cycle Analysis
5.5. Suppliers and Distributors
6. Telemedicine Technologies Market, By Category
6.1. Software
6.2. Hardware
6.3. Network
7. Telemedicine Technologies Market, By Applications
7.1. Telecardiology
7.2. Teleradiology
7.3. Telepathology
7.4. Telepsychiatry
7.5. Dermatology
8. Telemedicine Technologies Market, By Delivery Mode
8.1. On Premise
8.2. Web
8.3. Cloud
9. Telemedicine Technologies Market, By Geography
9.1. Europe
9.1.1. Germany
9.1.2. France
9.1.3. Italy
9.1.4. Spain
9.1.5. Russia
9.1.6. U.K.
9.1.7. Rest of Europe
9.2. Asia Pacific
9.2.1. China
9.2.2. India
9.2.3. Japan
9.2.4. South Korea
9.2.5. Rest of Asia-Pacific
9.3. North America
9.3.1. U.S.
9.3.2. Canada
9.3.3. Mexico
9.4. Rest of the World (RoW)
9.4.1. Brazil
9.4.2. Rest of RoW
10. Telemedicine Technologies Market – Entropy
10.1. Expansion
10.2. Technological Developments
10.3. Merger & Acquisitions, and Joint Ventures
10.4. Supply- Contract
11. Company Profiles (Overview, Financials, SWOT Analysis, Developments, Product Portfolio)
11.1. Aerotel Medical Systems Ltd.
11.2. Cardiocom
11.3. International Business Machines Corp.
11.4. Intouch Technologies
11.5. Medical International Research
11.6. Medtronic Inc.
11.7. Roche Diagnostics
11.8. Siemens Healthcare
11.9. 3m Health Information Systems
11.10. Allscripts Healthcare Solutions Inc.
11.11. Agfa Healthcare Nv
11.12. Medic4all
*More than 10 Companies are profiled in this Research Report*
"*Financials would be provided on a best efforts basis for private companies"
12. Appendix
12.1. Abbreviations
12.2. Sources
12.3. Research Methodology
12.4. Bibliography
12.5. Compilation of Expert Insights
12.6. Disclaimer
List of Tables
Table 1: Telemedicine Technologies Market Overview 2021-2026
Table 2: Telemedicine Technologies Market Leader Analysis 2018-2019 (US$)
Table 3: Telemedicine Technologies Market Product Analysis 2018-2019 (US$)
Table 4: Telemedicine Technologies Market End User Analysis 2018-2019 (US$)
Table 5: Telemedicine Technologies Market Patent Analysis 2013-2018* (US$)
Table 6: Telemedicine Technologies Market Financial Analysis 2018-2019 (US$)
Table 7: Telemedicine Technologies Market Driver Analysis 2018-2019 (US$)
Table 8: Telemedicine Technologies Market Challenges Analysis 2018-2019 (US$)
Table 9: Telemedicine Technologies Market Constraint Analysis 2018-2019 (US$)
Table 10: Telemedicine Technologies Market Supplier Bargaining Power Analysis 2018-2019 (US$)
Table 11: Telemedicine Technologies Market Buyer Bargaining Power Analysis 2018-2019 (US$)
Table 12: Telemedicine Technologies Market Threat of Substitutes Analysis 2018-2019 (US$)
Table 13: Telemedicine Technologies Market Threat of New Entrants Analysis 2018-2019 (US$)
Table 14: Telemedicine Technologies Market Degree of Competition Analysis 2018-2019 (US$)
Table 15: Telemedicine Technologies Market Value Chain Analysis 2018-2019 (US$)
Table 16: Telemedicine Technologies Market Pricing Analysis 2021-2026 (US$)
Table 17: Telemedicine Technologies Market Opportunities Analysis 2021-2026 (US$)
Table 18: Telemedicine Technologies Market Product Life Cycle Analysis 2021-2026 (US$)
Table 19: Telemedicine Technologies Market Supplier Analysis 2018-2019 (US$)
Table 20: Telemedicine Technologies Market Distributor Analysis 2018-2019 (US$)
Table 21: Telemedicine Technologies Market Trend Analysis 2018-2019 (US$)
Table 22: Telemedicine Technologies Market Size 2018 (US$)
Table 23: Telemedicine Technologies Market Forecast Analysis 2021-2026 (US$)
Table 24: Telemedicine Technologies Market Sales Forecast Analysis 2021-2026 (Units)
Table 25: Telemedicine Technologies Market, Revenue & Volume, By Category, 2021-2026 ($)
Table 26: Telemedicine Technologies Market By Category, Revenue & Volume, By Software, 2021-2026 ($)
Table 27: Telemedicine Technologies Market By Category, Revenue & Volume, By Hardware, 2021-2026 ($)
Table 28: Telemedicine Technologies Market By Category, Revenue & Volume, By Network, 2021-2026 ($)
Table 29: Telemedicine Technologies Market, Revenue & Volume, By Delivery Mode, 2021-2026 ($)
Table 30: Telemedicine Technologies Market By Delivery Mode, Revenue & Volume, By On Premise, 2021-2026 ($)
Table 31: Telemedicine Technologies Market By Delivery Mode, Revenue & Volume, By Web, 2021-2026 ($)
Table 32: Telemedicine Technologies Market By Delivery Mode, Revenue & Volume, By Cloud, 2021-2026 ($)
Table 33: Telemedicine Technologies Market, Revenue & Volume, By Applications, 2021-2026 ($)
Table 34: Telemedicine Technologies Market By Applications, Revenue & Volume, By Telecardiology, 2021-2026 ($)
Table 35: Telemedicine Technologies Market By Applications, Revenue & Volume, By Teleradiology, 2021-2026 ($)
Table 36: Telemedicine Technologies Market By Applications, Revenue & Volume, By Telepathology, 2021-2026 ($)
Table 37: Telemedicine Technologies Market By Applications, Revenue & Volume, By Telepsychiatry, 2021-2026 ($)
Table 38: Telemedicine Technologies Market By Applications, Revenue & Volume, By Dermatology, 2021-2026 ($)
Table 39: North America Telemedicine Technologies Market, Revenue & Volume, By Category, 2021-2026 ($)
Table 40: North America Telemedicine Technologies Market, Revenue & Volume, By Delivery Mode, 2021-2026 ($)
Table 41: North America Telemedicine Technologies Market, Revenue & Volume, By Applications, 2021-2026 ($)
Table 42: South america Telemedicine Technologies Market, Revenue & Volume, By Category, 2021-2026 ($)
Table 43: South america Telemedicine Technologies Market, Revenue & Volume, By Delivery Mode, 2021-2026 ($)
Table 44: South america Telemedicine Technologies Market, Revenue & Volume, By Applications, 2021-2026 ($)
Table 45: Europe Telemedicine Technologies Market, Revenue & Volume, By Category, 2021-2026 ($)
Table 46: Europe Telemedicine Technologies Market, Revenue & Volume, By Delivery Mode, 2021-2026 ($)
Table 47: Europe Telemedicine Technologies Market, Revenue & Volume, By Applications, 2021-2026 ($)
Table 48: APAC Telemedicine Technologies Market, Revenue & Volume, By Category, 2021-2026 ($)
Table 49: APAC Telemedicine Technologies Market, Revenue & Volume, By Delivery Mode, 2021-2026 ($)
Table 50: APAC Telemedicine Technologies Market, Revenue & Volume, By Applications, 2021-2026 ($)
Table 51: Middle East & Africa Telemedicine Technologies Market, Revenue & Volume, By Category, 2021-2026 ($)
Table 52: Middle East & Africa Telemedicine Technologies Market, Revenue & Volume, By Delivery Mode, 2021-2026 ($)
Table 53: Middle East & Africa Telemedicine Technologies Market, Revenue & Volume, By Applications, 2021-2026 ($)
Table 54: Russia Telemedicine Technologies Market, Revenue & Volume, By Category, 2021-2026 ($)
Table 55: Russia Telemedicine Technologies Market, Revenue & Volume, By Delivery Mode, 2021-2026 ($)
Table 56: Russia Telemedicine Technologies Market, Revenue & Volume, By Applications, 2021-2026 ($)
Table 57: Israel Telemedicine Technologies Market, Revenue & Volume, By Category, 2021-2026 ($)
Table 58: Israel Telemedicine Technologies Market, Revenue & Volume, By Delivery Mode, 2021-2026 ($)
Table 59: Israel Telemedicine Technologies Market, Revenue & Volume, By Applications, 2021-2026 ($)
Table 60: Top Companies 2018 (US$)Telemedicine Technologies Market, Revenue & Volume
Table 61: Product Launch 2018-2019Telemedicine Technologies Market, Revenue & Volume
Table 62: Mergers & Acquistions 2018-2019Telemedicine Technologies Market, Revenue & Volume
List of Figures
Figure 1: Overview of Telemedicine Technologies Market 2021-2026
Figure 2: Market Share Analysis for Telemedicine Technologies Market 2018 (US$)
Figure 3: Product Comparison in Telemedicine Technologies Market 2018-2019 (US$)
Figure 4: End User Profile for Telemedicine Technologies Market 2018-2019 (US$)
Figure 5: Patent Application and Grant in Telemedicine Technologies Market 2013-2018* (US$)
Figure 6: Top 5 Companies Financial Analysis in Telemedicine Technologies Market 2018-2019 (US$)
Figure 7: Market Entry Strategy in Telemedicine Technologies Market 2018-2019
Figure 8: Ecosystem Analysis in Telemedicine Technologies Market 2018
Figure 9: Average Selling Price in Telemedicine Technologies Market 2021-2026
Figure 10: Top Opportunites in Telemedicine Technologies Market 2018-2019
Figure 11: Market Life Cycle Analysis in Telemedicine Technologies Market
Figure 12: GlobalBy CategoryTelemedicine Technologies Market Revenue, 2021-2026 ($)
Figure 13: GlobalBy Delivery ModeTelemedicine Technologies Market Revenue, 2021-2026 ($)
Figure 14: GlobalBy ApplicationsTelemedicine Technologies Market Revenue, 2021-2026 ($)
Figure 15: Global Telemedicine Technologies Market - By Geography
Figure 16: Global Telemedicine Technologies Market Value & Volume, By Geography, 2021-2026 ($)
Figure 17: Global Telemedicine Technologies Market CAGR, By Geography, 2021-2026 (%)
Figure 18: North America Telemedicine Technologies Market Value & Volume, 2021-2026 ($)
Figure 19: US Telemedicine Technologies Market Value & Volume, 2021-2026 ($)
Figure 20: US GDP and Population, 2018-2019 ($)
Figure 21: US GDP – Composition of 2018, By Sector of Origin
Figure 22: US Export and Import Value & Volume, 2018-2019 ($)
Figure 23: Canada Telemedicine Technologies Market Value & Volume, 2021-2026 ($)
Figure 24: Canada GDP and Population, 2018-2019 ($)
Figure 25: Canada GDP – Composition of 2018, By Sector of Origin
Figure 26: Canada Export and Import Value & Volume, 2018-2019 ($)
Figure 27: Mexico Telemedicine Technologies Market Value & Volume, 2021-2026 ($)
Figure 28: Mexico GDP and Population, 2018-2019 ($)
Figure 29: Mexico GDP – Composition of 2018, By Sector of Origin
Figure 30: Mexico Export and Import Value & Volume, 2018-2019 ($)
Figure 31: South America Telemedicine Technologies Market Value & Volume, 2021-2026 ($)
Figure 32: Brazil Telemedicine Technologies Market Value & Volume, 2021-2026 ($)
Figure 33: Brazil GDP and Population, 2018-2019 ($)
Figure 34: Brazil GDP – Composition of 2018, By Sector of Origin
Figure 35: Brazil Export and Import Value & Volume, 2018-2019 ($)
Figure 36: Venezuela Telemedicine Technologies Market Value & Volume, 2021-2026 ($)
Figure 37: Venezuela GDP and Population, 2018-2019 ($)
Figure 38: Venezuela GDP – Composition of 2018, By Sector of Origin
Figure 39: Venezuela Export and Import Value & Volume, 2018-2019 ($)
Figure 40: Argentina Telemedicine Technologies Market Value & Volume, 2021-2026 ($)
Figure 41: Argentina GDP and Population, 2018-2019 ($)
Figure 42: Argentina GDP – Composition of 2018, By Sector of Origin
Figure 43: Argentina Export and Import Value & Volume, 2018-2019 ($)
Figure 44: Ecuador Telemedicine Technologies Market Value & Volume, 2021-2026 ($)
Figure 45: Ecuador GDP and Population, 2018-2019 ($)
Figure 46: Ecuador GDP – Composition of 2018, By Sector of Origin
Figure 47: Ecuador Export and Import Value & Volume, 2018-2019 ($)
Figure 48: Peru Telemedicine Technologies Market Value & Volume, 2021-2026 ($)
Figure 49: Peru GDP and Population, 2018-2019 ($)
Figure 50: Peru GDP – Composition of 2018, By Sector of Origin
Figure 51: Peru Export and Import Value & Volume, 2018-2019 ($)
Figure 52: Colombia Telemedicine Technologies Market Value & Volume, 2021-2026 ($)
Figure 53: Colombia GDP and Population, 2018-2019 ($)
Figure 54: Colombia GDP – Composition of 2018, By Sector of Origin
Figure 55: Colombia Export and Import Value & Volume, 2018-2019 ($)
Figure 56: Costa Rica Telemedicine Technologies Market Value & Volume, 2021-2026 ($)
Figure 57: Costa Rica GDP and Population, 2018-2019 ($)
Figure 58: Costa Rica GDP – Composition of 2018, By Sector of Origin
Figure 59: Costa Rica Export and Import Value & Volume, 2018-2019 ($)
Figure 60: Europe Telemedicine Technologies Market Value & Volume, 2021-2026 ($)
Figure 61: U.K Telemedicine Technologies Market Value & Volume, 2021-2026 ($)
Figure 62: U.K GDP and Population, 2018-2019 ($)
Figure 63: U.K GDP – Composition of 2018, By Sector of Origin
Figure 64: U.K Export and Import Value & Volume, 2018-2019 ($)
Figure 65: Germany Telemedicine Technologies Market Value & Volume, 2021-2026 ($)
Figure 66: Germany GDP and Population, 2018-2019 ($)
Figure 67: Germany GDP – Composition of 2018, By Sector of Origin
Figure 68: Germany Export and Import Value & Volume, 2018-2019 ($)
Figure 69: Italy Telemedicine Technologies Market Value & Volume, 2021-2026 ($)
Figure 70: Italy GDP and Population, 2018-2019 ($)
Figure 71: Italy GDP – Composition of 2018, By Sector of Origin
Figure 72: Italy Export and Import Value & Volume, 2018-2019 ($)
Figure 73: France Telemedicine Technologies Market Value & Volume, 2021-2026 ($)
Figure 74: France GDP and Population, 2018-2019 ($)
Figure 75: France GDP – Composition of 2018, By Sector of Origin
Figure 76: France Export and Import Value & Volume, 2018-2019 ($)
Figure 77: Netherlands Telemedicine Technologies Market Value & Volume, 2021-2026 ($)
Figure 78: Netherlands GDP and Population, 2018-2019 ($)
Figure 79: Netherlands GDP – Composition of 2018, By Sector of Origin
Figure 80: Netherlands Export and Import Value & Volume, 2018-2019 ($)
Figure 81: Belgium Telemedicine Technologies Market Value & Volume, 2021-2026 ($)
Figure 82: Belgium GDP and Population, 2018-2019 ($)
Figure 83: Belgium GDP – Composition of 2018, By Sector of Origin
Figure 84: Belgium Export and Import Value & Volume, 2018-2019 ($)
Figure 85: Spain Telemedicine Technologies Market Value & Volume, 2021-2026 ($)
Figure 86: Spain GDP and Population, 2018-2019 ($)
Figure 87: Spain GDP – Composition of 2018, By Sector of Origin
Figure 88: Spain Export and Import Value & Volume, 2018-2019 ($)
Figure 89: Denmark Telemedicine Technologies Market Value & Volume, 2021-2026 ($)
Figure 90: Denmark GDP and Population, 2018-2019 ($)
Figure 91: Denmark GDP – Composition of 2018, By Sector of Origin
Figure 92: Denmark Export and Import Value & Volume, 2018-2019 ($)
Figure 93: APAC Telemedicine Technologies Market Value & Volume, 2021-2026 ($)
Figure 94: China Telemedicine Technologies Market Value & Volume, 2021-2026
Figure 95: China GDP and Population, 2018-2019 ($)
Figure 96: China GDP – Composition of 2018, By Sector of Origin
Figure 97: China Export and Import Value & Volume, 2018-2019 ($)Telemedicine Technologies Market China Export and Import Value & Volume, 2018-2019 ($)
Figure 98: Australia Telemedicine Technologies Market Value & Volume, 2021-2026 ($)
Figure 99: Australia GDP and Population, 2018-2019 ($)
Figure 100: Australia GDP – Composition of 2018, By Sector of Origin
Figure 101: Australia Export and Import Value & Volume, 2018-2019 ($)
Figure 102: South Korea Telemedicine Technologies Market Value & Volume, 2021-2026 ($)
Figure 103: South Korea GDP and Population, 2018-2019 ($)
Figure 104: South Korea GDP – Composition of 2018, By Sector of Origin
Figure 105: South Korea Export and Import Value & Volume, 2018-2019 ($)
Figure 106: India Telemedicine Technologies Market Value & Volume, 2021-2026 ($)
Figure 107: India GDP and Population, 2018-2019 ($)
Figure 108: India GDP – Composition of 2018, By Sector of Origin
Figure 109: India Export and Import Value & Volume, 2018-2019 ($)
Figure 110: Taiwan Telemedicine Technologies Market Value & Volume, 2021-2026 ($)
Figure 111: Taiwan GDP and Population, 2018-2019 ($)
Figure 112: Taiwan GDP – Composition of 2018, By Sector of Origin
Figure 113: Taiwan Export and Import Value & Volume, 2018-2019 ($)
Figure 114: Malaysia Telemedicine Technologies Market Value & Volume, 2021-2026 ($)
Figure 115: Malaysia GDP and Population, 2018-2019 ($)
Figure 116: Malaysia GDP – Composition of 2018, By Sector of Origin
Figure 117: Malaysia Export and Import Value & Volume, 2018-2019 ($)
Figure 118: Hong Kong Telemedicine Technologies Market Value & Volume, 2021-2026 ($)
Figure 119: Hong Kong GDP and Population, 2018-2019 ($)
Figure 120: Hong Kong GDP – Composition of 2018, By Sector of Origin
Figure 121: Hong Kong Export and Import Value & Volume, 2018-2019 ($)
Figure 122: Middle East & Africa Telemedicine Technologies Market Middle East & Africa 3D Printing Market Value & Volume, 2021-2026 ($)
Figure 123: Russia Telemedicine Technologies Market Value & Volume, 2021-2026 ($)
Figure 124: Russia GDP and Population, 2018-2019 ($)
Figure 125: Russia GDP – Composition of 2018, By Sector of Origin
Figure 126: Russia Export and Import Value & Volume, 2018-2019 ($)
Figure 127: Israel Telemedicine Technologies Market Value & Volume, 2021-2026 ($)
Figure 128: Israel GDP and Population, 2018-2019 ($)
Figure 129: Israel GDP – Composition of 2018, By Sector of Origin
Figure 130: Israel Export and Import Value & Volume, 2018-2019 ($)
Figure 131: Entropy Share, By Strategies, 2018-2019* (%)Telemedicine Technologies Market
Figure 132: Developments, 2018-2019*Telemedicine Technologies Market
Figure 133: Company 1 Telemedicine Technologies Market Net Revenue, By Years, 2018-2019* ($)
Figure 134: Company 1 Telemedicine Technologies Market Net Revenue Share, By Business segments, 2018 (%)
Figure 135: Company 1 Telemedicine Technologies Market Net Sales Share, By Geography, 2018 (%)
Figure 136: Company 2 Telemedicine Technologies Market Net Revenue, By Years, 2018-2019* ($)
Figure 137: Company 2 Telemedicine Technologies Market Net Revenue Share, By Business segments, 2018 (%)
Figure 138: Company 2 Telemedicine Technologies Market Net Sales Share, By Geography, 2018 (%)
Figure 139: Company 3 Telemedicine Technologies Market Net Revenue, By Years, 2018-2019* ($)
Figure 140: Company 3 Telemedicine Technologies Market Net Revenue Share, By Business segments, 2018 (%)
Figure 141: Company 3 Telemedicine Technologies Market Net Sales Share, By Geography, 2018 (%)
Figure 142: Company 4 Telemedicine Technologies Market Net Revenue, By Years, 2018-2019* ($)
Figure 143: Company 4 Telemedicine Technologies Market Net Revenue Share, By Business segments, 2018 (%)
Figure 144: Company 4 Telemedicine Technologies Market Net Sales Share, By Geography, 2018 (%)
Figure 145: Company 5 Telemedicine Technologies Market Net Revenue, By Years, 2018-2019* ($)
Figure 146: Company 5 Telemedicine Technologies Market Net Revenue Share, By Business segments, 2018 (%)
Figure 147: Company 5 Telemedicine Technologies Market Net Sales Share, By Geography, 2018 (%)
Figure 148: Company 6 Telemedicine Technologies Market Net Revenue, By Years, 2018-2019* ($)
Figure 149: Company 6 Telemedicine Technologies Market Net Revenue Share, By Business segments, 2018 (%)
Figure 150: Company 6 Telemedicine Technologies Market Net Sales Share, By Geography, 2018 (%)
Figure 151: Company 7 Telemedicine Technologies Market Net Revenue, By Years, 2018-2019* ($)
Figure 152: Company 7 Telemedicine Technologies Market Net Revenue Share, By Business segments, 2018 (%)
Figure 153: Company 7 Telemedicine Technologies Market Net Sales Share, By Geography, 2018 (%)
Figure 154: Company 8 Telemedicine Technologies Market Net Revenue, By Years, 2018-2019* ($)
Figure 155: Company 8 Telemedicine Technologies Market Net Revenue Share, By Business segments, 2018 (%)
Figure 156: Company 8 Telemedicine Technologies Market Net Sales Share, By Geography, 2018 (%)
Figure 157: Company 9 Telemedicine Technologies Market Net Revenue, By Years, 2018-2019* ($)
Figure 158: Company 9 Telemedicine Technologies Market Net Revenue Share, By Business segments, 2018 (%)
Figure 159: Company 9 Telemedicine Technologies Market Net Sales Share, By Geography, 2018 (%)
Figure 160: Company 10 Telemedicine Technologies Market Net Revenue, By Years, 2018-2019* ($)
Figure 161: Company 10 Telemedicine Technologies Market Net Revenue Share, By Business segments, 2018 (%)
Figure 162: Company 10 Telemedicine Technologies Market Net Sales Share, By Geography, 2018 (%)
Figure 163: Company 11 Telemedicine Technologies Market Net Revenue, By Years, 2018-2019* ($)
Figure 164: Company 11 Telemedicine Technologies Market Net Revenue Share, By Business segments, 2018 (%)
Figure 165: Company 11 Telemedicine Technologies Market Net Sales Share, By Geography, 2018 (%)
Figure 166: Company 12 Telemedicine Technologies Market Net Revenue, By Years, 2018-2019* ($)
Figure 167: Company 12 Telemedicine Technologies Market Net Revenue Share, By Business segments, 2018 (%)
Figure 168: Company 12 Telemedicine Technologies Market Net Sales Share, By Geography, 2018 (%)
Figure 169: Company 13 Telemedicine Technologies Market Net Revenue, By Years, 2018-2019* ($)
Figure 170: Company 13 Telemedicine Technologies Market Net Revenue Share, By Business segments, 2018 (%)
Figure 171: Company 13 Telemedicine Technologies Market Net Sales Share, By Geography, 2018 (%)
Figure 172: Company 14 Telemedicine Technologies Market Net Revenue, By Years, 2018-2019* ($)
Figure 173: Company 14 Telemedicine Technologies Market Net Revenue Share, By Business segments, 2018 (%)
Figure 174: Company 14 Telemedicine Technologies Market Net Sales Share, By Geography, 2018 (%)
Figure 175: Company 15 Telemedicine Technologies Market Net Revenue, By Years, 2018-2019* ($)
Figure 176: Company 15 Telemedicine Technologies Market Net Revenue Share, By Business segments, 2018 (%)
Figure 177: Company 15 Telemedicine Technologies Market Net Sales Share, By Geography, 2018 (%)