 Email
Email Print
Print


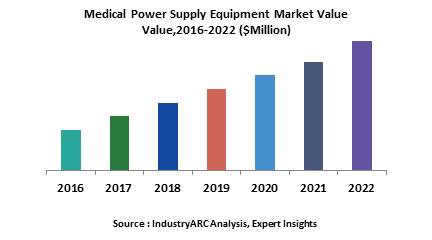
Medical Power Supply Equipment Market - Forecast(2024 - 2030)
The medical power supply devices are the devices, which take incoming electrical current and amplify or reduce it to the level required by medical devices in order to ensure their continuous functioning. Globally, advancement in medical device technology and growing usage of the portable devices in the healthcare industry is expected to remain the key growth driver for the medical power supply equipments during the period of study.
Geographically, North America dominated the medical power supply equipment market driven by best in class healthcare infrastructure with advanced equipments and higher spending on healthcare by citizens in the region. North America was followed by Europe and Asia-Pacific as second and third largest market for medical power supply equipment market. Asia Pacific is projected to have the fastest growth, owing to rapidly developing medical infrastructure, increasing spending healthcare and growing medical tourism in developing nations such as China and India in this region.
This report identifies the medical power supply equipment market size for the years 2014-2016, and forecast of the same till the year 2022. It also highlights the market drivers, restraints, growth indicators, challenges, and other key aspects with respect to global medical power supply equipment market.
This report segments the medical power supply equipment market on the basis of technology, application, type and regional market as follows:
Sample Companies profiled in this Report are:
Geographically, North America dominated the medical power supply equipment market driven by best in class healthcare infrastructure with advanced equipments and higher spending on healthcare by citizens in the region. North America was followed by Europe and Asia-Pacific as second and third largest market for medical power supply equipment market. Asia Pacific is projected to have the fastest growth, owing to rapidly developing medical infrastructure, increasing spending healthcare and growing medical tourism in developing nations such as China and India in this region.
This report identifies the medical power supply equipment market size for the years 2014-2016, and forecast of the same till the year 2022. It also highlights the market drivers, restraints, growth indicators, challenges, and other key aspects with respect to global medical power supply equipment market.
This report segments the medical power supply equipment market on the basis of technology, application, type and regional market as follows:
- Medical power supply equipment market research report is classified on the basis of technology. Some of the major technologies covered in this report are as follows: AC-DC & DC-DC Power Supply
- Medical power supply equipment market research report is classified on the basis of application. Some of the major applications covered in this report are as follows: MRI, X-ray, CT, Ultrasound, EEG, ECG, Blood Pressure Monitor, Ventilator, PAP, VAD
- Medical power supply equipment market research report is classified on the basis of type. Some of the major types covered in this report are as follows: External, Enclosed, Configurable, Encapsulated
- This report has been further segmented into major regions, which includes detailed analysis of each region such as: North America, Europe, Asia-Pacific (APAC), and Rest of the World (RoW) covering all the major country level markets in each of the region
Sample Companies profiled in this Report are:
- Astrodyne Corporation
- CUI, Inc. (Subsidiary Of CUI Global, Inc.)
- Delta Electronics, Inc.
- Emerson Network Power, Inc. (Subsidiary Of Emerson Electric Co.)
- Excelsys Technologies Ltd
- 10+.
1. Medical power supply equipment Market – Overview
2. Executive Summary
3. Medical power supply equipment Market Landscape
3.1. Market Share Analysis
3.2. Comparative Analysis
3.3. Product Benchmarking
3.4. End User Profiling
3.5. Top 5 Financials Analysis
4. Medical power supply equipment Market– Forces
4.1. Drivers
4.1.1. Rise In High Efficiency And Digitally Controlled Power Supplies
4.1.2. Emerging Economies And Rising Trend Of Private Medical Treatment
4.1.3. Advancement In Medical Device Technology
4.1.4. Shift Towards Portable Medical Equipment
4.2. Restraints
4.3. Opportunities
4.4. Challenges
4.5. Porter’s Five Forces Analysis
4.5.1. Bargaining Power of Suppliers
4.5.2. Bargaining Power of Buyers
4.5.3. Threat of New Entrants
4.5.4. Threat of Substitutes
4.5.5. Degree of Competition
5. Medical power supply equipment Market– Strategic Analysis
5.1. Value Chain Analysis
5.2. Pricing Analysis
5.3. Opportunities Analysis
5.4. Product/Market Life Cycle Analysis
5.5. Suppliers and Distributors
6. Medical power supply equipment Market, By Technology
6.1. AC-DC Power Supply
6.2. DC-DC Power Supply
7. Medical power supply equipment Market, By Type
7.1. External
7.2. Enclosed
7.3. Configurable
7.4. Encapsulated
8. Medical power supply equipment Market, By Application
8.1. MRI
8.2. X-ray
8.3. CT
8.4. Ultrasound
8.5. EEG
8.6. ECG
8.7. Blood Pressure Monitor
8.8. Ventilator
8.9. Positive Airway Pressure (PAP)
8.10. Ventricular Assist Device (VAD)
8.11. Dialysis Service
8.12. Portable Suction Device
8.13. Portable Nebulizers
8.14. Others
9. Medical power supply equipment Market, By Geography
9.1. Europe
9.1.1. Germany
9.1.2. France
9.1.3. Italy
9.1.4. Spain
9.1.5. Russia
9.1.6. U.K.
9.1.7. Rest of Europe
9.2. Asia Pacific
9.2.1. China
9.2.2. India
9.2.3. Japan
9.2.4. South Korea
9.2.5. Rest of Asia-Pacific
9.3. North America
9.3.1. U.S.
9.3.2. Canada
9.3.3. Mexico
9.4. Rest of the World (RoW)
9.4.1. Brazil
9.4.2. Rest of RoW
10. Medical power supply equipment Market – Entropy
10.1. Expansion
10.2. Technological Developments
10.3. Merger & Acquisitions, and Joint Ventures
10.4. Supply- Contract
11. Company Profiles (Overview, Financials, SWOT Analysis, Developments, Product Portfolio)
11.1. Astrodyne Corporation
11.2. CUI, Inc. (Subsidiary Of CUI Global, Inc.)
11.3. Delta Electronics, Inc.
11.4. Emerson Network Power, Inc. (Subsidiary Of Emerson Electric Co.)
11.5. Excelsys Technologies Ltd.
11.6. Friwo Gerätebau Gmbh
11.7. Globtek Inc.
11.8. Iccnexergy Inc.
11.9. Mean Well
11.10. Powerbox International AB
11.11. SL Power Electronics Corporation (Subsidiary Of SL Industries, Inc.)
*More than 10 Companies are profiled in this Research Report*
"*Financials would be provided on a best efforts basis for private companies"
12. Appendix
12.1. Abbreviations
12.2. Sources
12.3. Research Methodology
12.4. Bibliography
12.5. Compilation of Expert Insights
12.6. Disclaimer
List of Tables
Table 1: Medical Power Supply Equipment Market Overview 2021-2026
Table 2: Medical Power Supply Equipment Market Leader Analysis 2018-2019 (US$)
Table 3: Medical Power Supply Equipment Market Product Analysis 2018-2019 (US$)
Table 4: Medical Power Supply Equipment Market End User Analysis 2018-2019 (US$)
Table 5: Medical Power Supply Equipment Market Patent Analysis 2013-2018* (US$)
Table 6: Medical Power Supply Equipment Market Financial Analysis 2018-2019 (US$)
Table 7: Medical Power Supply Equipment Market Driver Analysis 2018-2019 (US$)
Table 8: Medical Power Supply Equipment Market Challenges Analysis 2018-2019 (US$)
Table 9: Medical Power Supply Equipment Market Constraint Analysis 2018-2019 (US$)
Table 10: Medical Power Supply Equipment Market Supplier Bargaining Power Analysis 2018-2019 (US$)
Table 11: Medical Power Supply Equipment Market Buyer Bargaining Power Analysis 2018-2019 (US$)
Table 12: Medical Power Supply Equipment Market Threat of Substitutes Analysis 2018-2019 (US$)
Table 13: Medical Power Supply Equipment Market Threat of New Entrants Analysis 2018-2019 (US$)
Table 14: Medical Power Supply Equipment Market Degree of Competition Analysis 2018-2019 (US$)
Table 15: Medical Power Supply Equipment Market Value Chain Analysis 2018-2019 (US$)
Table 16: Medical Power Supply Equipment Market Pricing Analysis 2021-2026 (US$)
Table 17: Medical Power Supply Equipment Market Opportunities Analysis 2021-2026 (US$)
Table 18: Medical Power Supply Equipment Market Product Life Cycle Analysis 2021-2026 (US$)
Table 19: Medical Power Supply Equipment Market Supplier Analysis 2018-2019 (US$)
Table 20: Medical Power Supply Equipment Market Distributor Analysis 2018-2019 (US$)
Table 21: Medical Power Supply Equipment Market Trend Analysis 2018-2019 (US$)
Table 22: Medical Power Supply Equipment Market Size 2018 (US$)
Table 23: Medical Power Supply Equipment Market Forecast Analysis 2021-2026 (US$)
Table 24: Medical Power Supply Equipment Market Sales Forecast Analysis 2021-2026 (Units)
Table 25: Medical Power Supply Equipment Market, Revenue & Volume, By Type, 2021-2026 ($)
Table 26: Medical Power Supply Equipment Market By Type, Revenue & Volume, By External, 2021-2026 ($)
Table 27: Medical Power Supply Equipment Market By Type, Revenue & Volume, By Enclosed, 2021-2026 ($)
Table 28: Medical Power Supply Equipment Market By Type, Revenue & Volume, By Configurable, 2021-2026 ($)
Table 29: Medical Power Supply Equipment Market By Type, Revenue & Volume, By Encapsulated, 2021-2026 ($)
Table 30: Medical Power Supply Equipment Market, Revenue & Volume, By Technology, 2021-2026 ($)
Table 31: Medical Power Supply Equipment Market By Technology, Revenue & Volume, By AC-DC Power Supply, 2021-2026 ($)
Table 32: Medical Power Supply Equipment Market By Technology, Revenue & Volume, By DC-DC Power Supply, 2021-2026 ($)
Table 33: Medical Power Supply Equipment Market, Revenue & Volume, By Application, 2021-2026 ($)
Table 34: Medical Power Supply Equipment Market By Application, Revenue & Volume, By MRI, 2021-2026 ($)
Table 35: Medical Power Supply Equipment Market By Application, Revenue & Volume, By X-ray, 2021-2026 ($)
Table 36: Medical Power Supply Equipment Market By Application, Revenue & Volume, By CT, 2021-2026 ($)
Table 37: Medical Power Supply Equipment Market By Application, Revenue & Volume, By Ultrasound, 2021-2026 ($)
Table 38: Medical Power Supply Equipment Market By Application, Revenue & Volume, By EEG, 2021-2026 ($)
Table 39: North America Medical Power Supply Equipment Market, Revenue & Volume, By Type, 2021-2026 ($)
Table 40: North America Medical Power Supply Equipment Market, Revenue & Volume, By Technology, 2021-2026 ($)
Table 41: North America Medical Power Supply Equipment Market, Revenue & Volume, By Application, 2021-2026 ($)
Table 42: South america Medical Power Supply Equipment Market, Revenue & Volume, By Type, 2021-2026 ($)
Table 43: South america Medical Power Supply Equipment Market, Revenue & Volume, By Technology, 2021-2026 ($)
Table 44: South america Medical Power Supply Equipment Market, Revenue & Volume, By Application, 2021-2026 ($)
Table 45: Europe Medical Power Supply Equipment Market, Revenue & Volume, By Type, 2021-2026 ($)
Table 46: Europe Medical Power Supply Equipment Market, Revenue & Volume, By Technology, 2021-2026 ($)
Table 47: Europe Medical Power Supply Equipment Market, Revenue & Volume, By Application, 2021-2026 ($)
Table 48: APAC Medical Power Supply Equipment Market, Revenue & Volume, By Type, 2021-2026 ($)
Table 49: APAC Medical Power Supply Equipment Market, Revenue & Volume, By Technology, 2021-2026 ($)
Table 50: APAC Medical Power Supply Equipment Market, Revenue & Volume, By Application, 2021-2026 ($)
Table 51: Middle East & Africa Medical Power Supply Equipment Market, Revenue & Volume, By Type, 2021-2026 ($)
Table 52: Middle East & Africa Medical Power Supply Equipment Market, Revenue & Volume, By Technology, 2021-2026 ($)
Table 53: Middle East & Africa Medical Power Supply Equipment Market, Revenue & Volume, By Application, 2021-2026 ($)
Table 54: Russia Medical Power Supply Equipment Market, Revenue & Volume, By Type, 2021-2026 ($)
Table 55: Russia Medical Power Supply Equipment Market, Revenue & Volume, By Technology, 2021-2026 ($)
Table 56: Russia Medical Power Supply Equipment Market, Revenue & Volume, By Application, 2021-2026 ($)
Table 57: Israel Medical Power Supply Equipment Market, Revenue & Volume, By Type, 2021-2026 ($)
Table 58: Israel Medical Power Supply Equipment Market, Revenue & Volume, By Technology, 2021-2026 ($)
Table 59: Israel Medical Power Supply Equipment Market, Revenue & Volume, By Application, 2021-2026 ($)
Table 60: Top Companies 2018 (US$)Medical Power Supply Equipment Market, Revenue & Volume
Table 61: Product Launch 2018-2019Medical Power Supply Equipment Market, Revenue & Volume
Table 62: Mergers & Acquistions 2018-2019Medical Power Supply Equipment Market, Revenue & Volume
List of Figures
Figure 1: Overview of Medical Power Supply Equipment Market 2021-2026
Figure 2: Market Share Analysis for Medical Power Supply Equipment Market 2018 (US$)
Figure 3: Product Comparison in Medical Power Supply Equipment Market 2018-2019 (US$)
Figure 4: End User Profile for Medical Power Supply Equipment Market 2018-2019 (US$)
Figure 5: Patent Application and Grant in Medical Power Supply Equipment Market 2013-2018* (US$)
Figure 6: Top 5 Companies Financial Analysis in Medical Power Supply Equipment Market 2018-2019 (US$)
Figure 7: Market Entry Strategy in Medical Power Supply Equipment Market 2018-2019
Figure 8: Ecosystem Analysis in Medical Power Supply Equipment Market 2018
Figure 9: Average Selling Price in Medical Power Supply Equipment Market 2021-2026
Figure 10: Top Opportunites in Medical Power Supply Equipment Market 2018-2019
Figure 11: Market Life Cycle Analysis in Medical Power Supply Equipment Market
Figure 12: GlobalBy TypeMedical Power Supply Equipment Market Revenue, 2021-2026 ($)
Figure 13: GlobalBy TechnologyMedical Power Supply Equipment Market Revenue, 2021-2026 ($)
Figure 14: GlobalBy ApplicationMedical Power Supply Equipment Market Revenue, 2021-2026 ($)
Figure 15: Global Medical Power Supply Equipment Market - By Geography
Figure 16: Global Medical Power Supply Equipment Market Value & Volume, By Geography, 2021-2026 ($)
Figure 17: Global Medical Power Supply Equipment Market CAGR, By Geography, 2021-2026 (%)
Figure 18: North America Medical Power Supply Equipment Market Value & Volume, 2021-2026 ($)
Figure 19: US Medical Power Supply Equipment Market Value & Volume, 2021-2026 ($)
Figure 20: US GDP and Population, 2018-2019 ($)
Figure 21: US GDP – Composition of 2018, By Sector of Origin
Figure 22: US Export and Import Value & Volume, 2018-2019 ($)
Figure 23: Canada Medical Power Supply Equipment Market Value & Volume, 2021-2026 ($)
Figure 24: Canada GDP and Population, 2018-2019 ($)
Figure 25: Canada GDP – Composition of 2018, By Sector of Origin
Figure 26: Canada Export and Import Value & Volume, 2018-2019 ($)
Figure 27: Mexico Medical Power Supply Equipment Market Value & Volume, 2021-2026 ($)
Figure 28: Mexico GDP and Population, 2018-2019 ($)
Figure 29: Mexico GDP – Composition of 2018, By Sector of Origin
Figure 30: Mexico Export and Import Value & Volume, 2018-2019 ($)
Figure 31: South America Medical Power Supply Equipment Market Value & Volume, 2021-2026 ($)
Figure 32: Brazil Medical Power Supply Equipment Market Value & Volume, 2021-2026 ($)
Figure 33: Brazil GDP and Population, 2018-2019 ($)
Figure 34: Brazil GDP – Composition of 2018, By Sector of Origin
Figure 35: Brazil Export and Import Value & Volume, 2018-2019 ($)
Figure 36: Venezuela Medical Power Supply Equipment Market Value & Volume, 2021-2026 ($)
Figure 37: Venezuela GDP and Population, 2018-2019 ($)
Figure 38: Venezuela GDP – Composition of 2018, By Sector of Origin
Figure 39: Venezuela Export and Import Value & Volume, 2018-2019 ($)
Figure 40: Argentina Medical Power Supply Equipment Market Value & Volume, 2021-2026 ($)
Figure 41: Argentina GDP and Population, 2018-2019 ($)
Figure 42: Argentina GDP – Composition of 2018, By Sector of Origin
Figure 43: Argentina Export and Import Value & Volume, 2018-2019 ($)
Figure 44: Ecuador Medical Power Supply Equipment Market Value & Volume, 2021-2026 ($)
Figure 45: Ecuador GDP and Population, 2018-2019 ($)
Figure 46: Ecuador GDP – Composition of 2018, By Sector of Origin
Figure 47: Ecuador Export and Import Value & Volume, 2018-2019 ($)
Figure 48: Peru Medical Power Supply Equipment Market Value & Volume, 2021-2026 ($)
Figure 49: Peru GDP and Population, 2018-2019 ($)
Figure 50: Peru GDP – Composition of 2018, By Sector of Origin
Figure 51: Peru Export and Import Value & Volume, 2018-2019 ($)
Figure 52: Colombia Medical Power Supply Equipment Market Value & Volume, 2021-2026 ($)
Figure 53: Colombia GDP and Population, 2018-2019 ($)
Figure 54: Colombia GDP – Composition of 2018, By Sector of Origin
Figure 55: Colombia Export and Import Value & Volume, 2018-2019 ($)
Figure 56: Costa Rica Medical Power Supply Equipment Market Value & Volume, 2021-2026 ($)
Figure 57: Costa Rica GDP and Population, 2018-2019 ($)
Figure 58: Costa Rica GDP – Composition of 2018, By Sector of Origin
Figure 59: Costa Rica Export and Import Value & Volume, 2018-2019 ($)
Figure 60: Europe Medical Power Supply Equipment Market Value & Volume, 2021-2026 ($)
Figure 61: U.K Medical Power Supply Equipment Market Value & Volume, 2021-2026 ($)
Figure 62: U.K GDP and Population, 2018-2019 ($)
Figure 63: U.K GDP – Composition of 2018, By Sector of Origin
Figure 64: U.K Export and Import Value & Volume, 2018-2019 ($)
Figure 65: Germany Medical Power Supply Equipment Market Value & Volume, 2021-2026 ($)
Figure 66: Germany GDP and Population, 2018-2019 ($)
Figure 67: Germany GDP – Composition of 2018, By Sector of Origin
Figure 68: Germany Export and Import Value & Volume, 2018-2019 ($)
Figure 69: Italy Medical Power Supply Equipment Market Value & Volume, 2021-2026 ($)
Figure 70: Italy GDP and Population, 2018-2019 ($)
Figure 71: Italy GDP – Composition of 2018, By Sector of Origin
Figure 72: Italy Export and Import Value & Volume, 2018-2019 ($)
Figure 73: France Medical Power Supply Equipment Market Value & Volume, 2021-2026 ($)
Figure 74: France GDP and Population, 2018-2019 ($)
Figure 75: France GDP – Composition of 2018, By Sector of Origin
Figure 76: France Export and Import Value & Volume, 2018-2019 ($)
Figure 77: Netherlands Medical Power Supply Equipment Market Value & Volume, 2021-2026 ($)
Figure 78: Netherlands GDP and Population, 2018-2019 ($)
Figure 79: Netherlands GDP – Composition of 2018, By Sector of Origin
Figure 80: Netherlands Export and Import Value & Volume, 2018-2019 ($)
Figure 81: Belgium Medical Power Supply Equipment Market Value & Volume, 2021-2026 ($)
Figure 82: Belgium GDP and Population, 2018-2019 ($)
Figure 83: Belgium GDP – Composition of 2018, By Sector of Origin
Figure 84: Belgium Export and Import Value & Volume, 2018-2019 ($)
Figure 85: Spain Medical Power Supply Equipment Market Value & Volume, 2021-2026 ($)
Figure 86: Spain GDP and Population, 2018-2019 ($)
Figure 87: Spain GDP – Composition of 2018, By Sector of Origin
Figure 88: Spain Export and Import Value & Volume, 2018-2019 ($)
Figure 89: Denmark Medical Power Supply Equipment Market Value & Volume, 2021-2026 ($)
Figure 90: Denmark GDP and Population, 2018-2019 ($)
Figure 91: Denmark GDP – Composition of 2018, By Sector of Origin
Figure 92: Denmark Export and Import Value & Volume, 2018-2019 ($)
Figure 93: APAC Medical Power Supply Equipment Market Value & Volume, 2021-2026 ($)
Figure 94: China Medical Power Supply Equipment Market Value & Volume, 2021-2026
Figure 95: China GDP and Population, 2018-2019 ($)
Figure 96: China GDP – Composition of 2018, By Sector of Origin
Figure 97: China Export and Import Value & Volume, 2018-2019 ($)Medical Power Supply Equipment Market China Export and Import Value & Volume, 2018-2019 ($)
Figure 98: Australia Medical Power Supply Equipment Market Value & Volume, 2021-2026 ($)
Figure 99: Australia GDP and Population, 2018-2019 ($)
Figure 100: Australia GDP – Composition of 2018, By Sector of Origin
Figure 101: Australia Export and Import Value & Volume, 2018-2019 ($)
Figure 102: South Korea Medical Power Supply Equipment Market Value & Volume, 2021-2026 ($)
Figure 103: South Korea GDP and Population, 2018-2019 ($)
Figure 104: South Korea GDP – Composition of 2018, By Sector of Origin
Figure 105: South Korea Export and Import Value & Volume, 2018-2019 ($)
Figure 106: India Medical Power Supply Equipment Market Value & Volume, 2021-2026 ($)
Figure 107: India GDP and Population, 2018-2019 ($)
Figure 108: India GDP – Composition of 2018, By Sector of Origin
Figure 109: India Export and Import Value & Volume, 2018-2019 ($)
Figure 110: Taiwan Medical Power Supply Equipment Market Value & Volume, 2021-2026 ($)
Figure 111: Taiwan GDP and Population, 2018-2019 ($)
Figure 112: Taiwan GDP – Composition of 2018, By Sector of Origin
Figure 113: Taiwan Export and Import Value & Volume, 2018-2019 ($)
Figure 114: Malaysia Medical Power Supply Equipment Market Value & Volume, 2021-2026 ($)
Figure 115: Malaysia GDP and Population, 2018-2019 ($)
Figure 116: Malaysia GDP – Composition of 2018, By Sector of Origin
Figure 117: Malaysia Export and Import Value & Volume, 2018-2019 ($)
Figure 118: Hong Kong Medical Power Supply Equipment Market Value & Volume, 2021-2026 ($)
Figure 119: Hong Kong GDP and Population, 2018-2019 ($)
Figure 120: Hong Kong GDP – Composition of 2018, By Sector of Origin
Figure 121: Hong Kong Export and Import Value & Volume, 2018-2019 ($)
Figure 122: Middle East & Africa Medical Power Supply Equipment Market Middle East & Africa 3D Printing Market Value & Volume, 2021-2026 ($)
Figure 123: Russia Medical Power Supply Equipment Market Value & Volume, 2021-2026 ($)
Figure 124: Russia GDP and Population, 2018-2019 ($)
Figure 125: Russia GDP – Composition of 2018, By Sector of Origin
Figure 126: Russia Export and Import Value & Volume, 2018-2019 ($)
Figure 127: Israel Medical Power Supply Equipment Market Value & Volume, 2021-2026 ($)
Figure 128: Israel GDP and Population, 2018-2019 ($)
Figure 129: Israel GDP – Composition of 2018, By Sector of Origin
Figure 130: Israel Export and Import Value & Volume, 2018-2019 ($)
Figure 131: Entropy Share, By Strategies, 2018-2019* (%)Medical Power Supply Equipment Market
Figure 132: Developments, 2018-2019*Medical Power Supply Equipment Market
Figure 133: Company 1 Medical Power Supply Equipment Market Net Revenue, By Years, 2018-2019* ($)
Figure 134: Company 1 Medical Power Supply Equipment Market Net Revenue Share, By Business segments, 2018 (%)
Figure 135: Company 1 Medical Power Supply Equipment Market Net Sales Share, By Geography, 2018 (%)
Figure 136: Company 2 Medical Power Supply Equipment Market Net Revenue, By Years, 2018-2019* ($)
Figure 137: Company 2 Medical Power Supply Equipment Market Net Revenue Share, By Business segments, 2018 (%)
Figure 138: Company 2 Medical Power Supply Equipment Market Net Sales Share, By Geography, 2018 (%)
Figure 139: Company 3 Medical Power Supply Equipment Market Net Revenue, By Years, 2018-2019* ($)
Figure 140: Company 3 Medical Power Supply Equipment Market Net Revenue Share, By Business segments, 2018 (%)
Figure 141: Company 3 Medical Power Supply Equipment Market Net Sales Share, By Geography, 2018 (%)
Figure 142: Company 4 Medical Power Supply Equipment Market Net Revenue, By Years, 2018-2019* ($)
Figure 143: Company 4 Medical Power Supply Equipment Market Net Revenue Share, By Business segments, 2018 (%)
Figure 144: Company 4 Medical Power Supply Equipment Market Net Sales Share, By Geography, 2018 (%)
Figure 145: Company 5 Medical Power Supply Equipment Market Net Revenue, By Years, 2018-2019* ($)
Figure 146: Company 5 Medical Power Supply Equipment Market Net Revenue Share, By Business segments, 2018 (%)
Figure 147: Company 5 Medical Power Supply Equipment Market Net Sales Share, By Geography, 2018 (%)
Figure 148: Company 6 Medical Power Supply Equipment Market Net Revenue, By Years, 2018-2019* ($)
Figure 149: Company 6 Medical Power Supply Equipment Market Net Revenue Share, By Business segments, 2018 (%)
Figure 150: Company 6 Medical Power Supply Equipment Market Net Sales Share, By Geography, 2018 (%)
Figure 151: Company 7 Medical Power Supply Equipment Market Net Revenue, By Years, 2018-2019* ($)
Figure 152: Company 7 Medical Power Supply Equipment Market Net Revenue Share, By Business segments, 2018 (%)
Figure 153: Company 7 Medical Power Supply Equipment Market Net Sales Share, By Geography, 2018 (%)
Figure 154: Company 8 Medical Power Supply Equipment Market Net Revenue, By Years, 2018-2019* ($)
Figure 155: Company 8 Medical Power Supply Equipment Market Net Revenue Share, By Business segments, 2018 (%)
Figure 156: Company 8 Medical Power Supply Equipment Market Net Sales Share, By Geography, 2018 (%)
Figure 157: Company 9 Medical Power Supply Equipment Market Net Revenue, By Years, 2018-2019* ($)
Figure 158: Company 9 Medical Power Supply Equipment Market Net Revenue Share, By Business segments, 2018 (%)
Figure 159: Company 9 Medical Power Supply Equipment Market Net Sales Share, By Geography, 2018 (%)
Figure 160: Company 10 Medical Power Supply Equipment Market Net Revenue, By Years, 2018-2019* ($)
Figure 161: Company 10 Medical Power Supply Equipment Market Net Revenue Share, By Business segments, 2018 (%)
Figure 162: Company 10 Medical Power Supply Equipment Market Net Sales Share, By Geography, 2018 (%)
Figure 163: Company 11 Medical Power Supply Equipment Market Net Revenue, By Years, 2018-2019* ($)
Figure 164: Company 11 Medical Power Supply Equipment Market Net Revenue Share, By Business segments, 2018 (%)
Figure 165: Company 11 Medical Power Supply Equipment Market Net Sales Share, By Geography, 2018 (%)
Figure 166: Company 12 Medical Power Supply Equipment Market Net Revenue, By Years, 2018-2019* ($)
Figure 167: Company 12 Medical Power Supply Equipment Market Net Revenue Share, By Business segments, 2018 (%)
Figure 168: Company 12 Medical Power Supply Equipment Market Net Sales Share, By Geography, 2018 (%)
Figure 169: Company 13 Medical Power Supply Equipment Market Net Revenue, By Years, 2018-2019* ($)
Figure 170: Company 13 Medical Power Supply Equipment Market Net Revenue Share, By Business segments, 2018 (%)
Figure 171: Company 13 Medical Power Supply Equipment Market Net Sales Share, By Geography, 2018 (%)
Figure 172: Company 14 Medical Power Supply Equipment Market Net Revenue, By Years, 2018-2019* ($)
Figure 173: Company 14 Medical Power Supply Equipment Market Net Revenue Share, By Business segments, 2018 (%)
Figure 174: Company 14 Medical Power Supply Equipment Market Net Sales Share, By Geography, 2018 (%)
Figure 175: Company 15 Medical Power Supply Equipment Market Net Revenue, By Years, 2018-2019* ($)
Figure 176: Company 15 Medical Power Supply Equipment Market Net Revenue Share, By Business segments, 2018 (%)
Figure 177: Company 15 Medical Power Supply Equipment Market Net Sales Share, By Geography, 2018 (%)