 Email
Email Print
Print


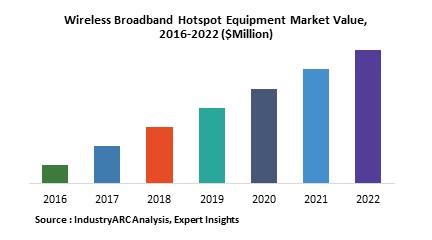
Wireless Broadband Hotspot Equipment Market - Forecast(2024 - 2030)
The rapid increase in the number of consumer electronics devices will introduce the need for wireless broadband hotspot equipment in the industry specific cloud applications. The market is growing exponentially from the past decades and is expected to increase its demand in the coming days. The need for continuous data connectivity in the current world and seeing its expansion the demand for wireless broadband hotspot equipment will increase and it will not lose its rapidity in future.
What is Wireless Broadband Hotspot Equipment?
Wireless Broadband hotspot equipment are wireless routers that acts as mobile Wi-Fi hotspot. Such type of devices are used to provide internet connectivity to the customers at public places using wireless network connectivity.
Market Research and Market Trends of Wireless Broadband Hotspot Equipment Market:
- Wireless broadband hotspot equipment is driven by higher technology penetration in daily life, higher number of internet users, tech savvy population and better network connectivity across the globe.
- The market has reached to its peak because most of the industries have incorporated the latest technology. With more portable devices hitting the market wireless hotspot equipment is growing its popularity, owing to this people are becoming ever more mobile.
Who are the Major Players in Wireless Broadband Hotspot Equipment Market?
The companies referred in the market research report are Huawei Technologies, NETGEAR, Novatel Wireless, TP-LINK Technologies and 10 other companies.
What is our report scope?
The report incorporates in-depth assessment of the competitive landscape, product market sizing, product benchmarking, market trends, product developments, financial analysis, strategic analysis and so on to gauge the impact forces and potential opportunities of the market. Apart from this the report also includes a study of major developments in the market such as product launches, agreements, acquisitions, collaborations, mergers and so on to comprehend the prevailing market dynamics at present and its impact during the forecast period 2018-2023.
All our reports are customizable to your company needs to a certain extent, we do provide 20 free consulting hours along with purchase of each report, and this will allow you to request any additional data to customize the report to your needs.
Key Takeaways from this Report
- Evaluate market potential through analyzing growth rates (CAGR %), Volume (Units) and Value ($M) data given at country level – for product types, end use applications and by different industry verticals.
- Understand the different dynamics influencing the market – key driving factors, challenges and hidden opportunities.
- Get in-depth insights on your competitor performance – market shares, strategies, financial benchmarking, product benchmarking, SWOT and more.
- Analyze the sales and distribution channels across key geographies to improve top-line revenues.
- Understand the industry supply chain with a deep-dive on the value augmentation at each step, in order to optimize value and bring efficiencies in your processes.
- Get a quick outlook on the market entropy – M&A’s, deals, partnerships, product launches of all key players for the past 4 years.
- Evaluate the supply-demand gaps, import-export statistics and regulatory landscape for more than top 20 countries globally for the market.
1. Wireless Broadband Hotspot Equipment Market - Overview
1.1. Definitions and Scope
2. Wireless Broadband Hotspot Equipment Market - Executive summary
2.1. Market Revenue, Market Size and Key Trends by Company
2.2. Key Trends by type of Application
2.3. Key Trends segmented by Geography
3. Wireless Broadband Hotspot Equipment Market
3.1. Comparative analysis
3.1.1. Product Benchmarking - Top 10 companies
3.1.2. Top 5 Financials Analysis
3.1.3. Market Value split by Top 10 companies
3.1.4. Patent Analysis - Top 10 companies
3.1.5. Pricing Analysis
4. Wireless Broadband Hotspot Equipment Market – Startup companies Scenario Premium
4.1. Top 10 startup company Analysis by
4.1.1. Investment
4.1.2. Revenue
4.1.3. Market Shares
4.1.4. Market Size and Application Analysis
4.1.5. Venture Capital and Funding Scenario
5. Wireless Broadband Hotspot Equipment Market – Industry Market Entry Scenario Premium
5.1. Regulatory Framework Overview
5.2. New Business and Ease of Doing business index
5.3. Case studies of successful ventures
5.4. Customer Analysis – Top 10 companies
6. Wireless Broadband Hotspot Equipment Market Forces
6.1. Drivers
6.2. Constraints
6.3. Challenges
6.4. Porters five force model
6.4.1. Bargaining power of suppliers
6.4.2. Bargaining powers of customers
6.4.3. Threat of new entrants
6.4.4. Rivalry among existing players
6.4.5. Threat of substitutes
7. Wireless Broadband Hotspot Equipment Market -Strategic analysis
7.1. Value chain analysis
7.2. Opportunities analysis
7.3. Product life cycle
7.4. Suppliers and distributors Market Share
8. Wireless Broadband Hotspot Equipment Market – By Service Type (Market Size -$Million / $Billion)
8.1. Market Size and Market Share Analysis
8.2. Application Revenue and Trend Research
8.3. Product Segment Analysis
8.3.1. Bundled
8.3.2. Standalone
9. Wireless Broadband Hotspot Equipment Market – By Technology (Market Size -$Million / $Billion)
9.1. IoT
9.2. 5G
9.3. Digital Transformation
10. Wireless Broadband Hotspot Equipment Market – By Devices (Market Size -$Million / $Billion)
10.1. Phones
10.2. Laptops
10.3. Tablets
10.4. Others
11. Wireless Broadband Hotspot Equipment – By End-User Type(Market Size -$Million / $Billion)
11.1. Segment type Size and Market Share Analysis
11.2. Application Revenue and Trends by type of Application
11.3. Application Segment Analysis by Type
11.3.1. Police Department
11.3.2. Fire Department
11.3.3. Emergency Medical Service Providers
12. Wireless Broadband Hotspot Equipment - By Geography (Market Size -$Million / $Billion)
12.1. Wireless Broadband Hotspot Equipment Market - North America Segment Research
12.2. North America Market Research (Million / $Billion)
12.2.1. Segment type Size and Market Size Analysis
12.2.2. Revenue and Trends
12.2.3. Application Revenue and Trends by type of Application
12.2.4. Company Revenue and Product Analysis
12.2.5. North America Product type and Application Market Size
12.2.5.1. U.S.
12.2.5.2. Canada
12.2.5.3. Mexico
12.2.5.4. Rest of North America
12.3. Wireless Broadband Hotspot Equipment - South America Segment Research
12.4. South America Market Research (Market Size -$Million / $Billion)
12.4.1. Segment type Size and Market Size Analysis
12.4.2. Revenue and Trends
12.4.3. Application Revenue and Trends by type of Application
12.4.4. Company Revenue and Product Analysis
12.4.5. South America Product type and Application Market Size
12.4.5.1. Brazil
12.4.5.2. Venezuela
12.4.5.3. Argentina
12.4.5.4. Ecuador
12.4.5.5. Peru
12.4.5.6. Colombia
12.4.5.7. Costa Rica
12.4.5.8. Rest of South America
12.5. Wireless Broadband Hotspot Equipment - Europe Segment Research
12.6. Europe Market Research (Market Size -$Million / $Billion)
12.6.1. Segment type Size and Market Size Analysis
12.6.2. Revenue and Trends
12.6.3. Application Revenue and Trends by type of Application
12.6.4. Company Revenue and Product Analysis
12.6.5. Europe Segment Product type and Application Market Size
12.6.5.1. U.K
12.6.5.2. Germany
12.6.5.3. Italy
12.6.5.4. France
12.6.5.5. Netherlands
12.6.5.6. Belgium
12.6.5.7. Spain
12.6.5.8. Denmark
12.6.5.9. Rest of Europe
12.7. Wireless Broadband Hotspot Equipment – APAC Segment Research
12.8. APAC Market Research (Market Size -$Million / $Billion)
12.8.1. Segment type Size and Market Size Analysis
12.8.2. Revenue and Trends
12.8.3. Application Revenue and Trends by type of Application
12.8.4. Company Revenue and Product Analysis
12.8.5. APAC Segment – Product type and Application Market Size
12.8.5.1. China
12.8.5.2. Australia
12.8.5.3. Japan
12.8.5.4. South Korea
12.8.5.5. India
12.8.5.6. Taiwan
12.8.5.7. Malaysia
13. Wireless Broadband Hotspot Equipment Market - Entropy
13.1. New product launches
13.2. M&A's, collaborations, JVs and partnerships
14. Wireless Broadband Hotspot Equipment Market – Industry / Segment Competition landscape Premium
14.1. Market Share Analysis
14.1.1. Market Share by Country- Top companies
14.1.2. Market Share by Region- Top 10 companies
14.1.3. Market Share by type of Application – Top 10 companies
14.1.4. Market Share by type of Product / Product category- Top 10 companies
14.1.5. Market Share at global level- Top 10 companies
14.1.6. Best Practises for companies
15. Wireless Broadband Hotspot Equipment Market – Key Company List by Country Premium
16. Wireless Broadband Hotspot Equipment Market Company Analysis
16.1. Market Share, Company Revenue, Products, M&A, Developments
16.2. Huawei Technologies
16.3. NETGEAR
16.4. Novatel Wireless
16.5. TP-LINK Technologies
16.6. Company 5
16.7. Company 6
16.8. Company 7
16.9. Company 8
16.10. Company 9
16.11. Company 10 and more
"*Financials would be provided on a best efforts basis for private companies"
17. Wireless Broadband Hotspot Equipment Market -Appendix
17.1. Abbreviations
17.2. Sources
18. Wireless Broadband Hotspot Equipment Market -Methodology Premium
18.1. Research Methodology
18.1.1. Company Expert Interviews
18.1.2. Industry Databases
18.1.3. Associations
18.1.4. Company News
18.1.5. Company Annual Reports
18.1.6. Application Trends
18.1.7. New Products and Product database
18.1.8. Company Transcripts
18.1.9. R&D Trends
18.1.10. Key Opinion Leaders Interviews
18.1.11. Supply and Demand Trends
List of Tables
Table 1: Wireless Broadband Hotspot Equipment Market Overview 2021-2026
Table 2: Wireless Broadband Hotspot Equipment Market Leader Analysis 2018-2019 (US$)
Table 3: Wireless Broadband Hotspot Equipment Market Product Analysis 2018-2019 (US$)
Table 4: Wireless Broadband Hotspot Equipment Market End User Analysis 2018-2019 (US$)
Table 5: Wireless Broadband Hotspot Equipment Market Patent Analysis 2013-2018* (US$)
Table 6: Wireless Broadband Hotspot Equipment Market Financial Analysis 2018-2019 (US$)
Table 7: Wireless Broadband Hotspot Equipment Market Driver Analysis 2018-2019 (US$)
Table 8: Wireless Broadband Hotspot Equipment Market Challenges Analysis 2018-2019 (US$)
Table 9: Wireless Broadband Hotspot Equipment Market Constraint Analysis 2018-2019 (US$)
Table 10: Wireless Broadband Hotspot Equipment Market Supplier Bargaining Power Analysis 2018-2019 (US$)
Table 11: Wireless Broadband Hotspot Equipment Market Buyer Bargaining Power Analysis 2018-2019 (US$)
Table 12: Wireless Broadband Hotspot Equipment Market Threat of Substitutes Analysis 2018-2019 (US$)
Table 13: Wireless Broadband Hotspot Equipment Market Threat of New Entrants Analysis 2018-2019 (US$)
Table 14: Wireless Broadband Hotspot Equipment Market Degree of Competition Analysis 2018-2019 (US$)
Table 15: Wireless Broadband Hotspot Equipment Market Value Chain Analysis 2018-2019 (US$)
Table 16: Wireless Broadband Hotspot Equipment Market Pricing Analysis 2021-2026 (US$)
Table 17: Wireless Broadband Hotspot Equipment Market Opportunities Analysis 2021-2026 (US$)
Table 18: Wireless Broadband Hotspot Equipment Market Product Life Cycle Analysis 2021-2026 (US$)
Table 19: Wireless Broadband Hotspot Equipment Market Supplier Analysis 2018-2019 (US$)
Table 20: Wireless Broadband Hotspot Equipment Market Distributor Analysis 2018-2019 (US$)
Table 21: Wireless Broadband Hotspot Equipment Market Trend Analysis 2018-2019 (US$)
Table 22: Wireless Broadband Hotspot Equipment Market Size 2018 (US$)
Table 23: Wireless Broadband Hotspot Equipment Market Forecast Analysis 2021-2026 (US$)
Table 24: Wireless Broadband Hotspot Equipment Market Sales Forecast Analysis 2021-2026 (Units)
Table 25: Wireless Broadband Hotspot Equipment Market, Revenue & Volume, By Type, 2021-2026 ($)
Table 26: Wireless Broadband Hotspot Equipment Market By Type, Revenue & Volume, By Bundled, 2021-2026 ($)
Table 27: Wireless Broadband Hotspot Equipment Market By Type, Revenue & Volume, By Standalone, 2021-2026 ($)
Table 28: Wireless Broadband Hotspot Equipment Market, Revenue & Volume, By End Use, 2021-2026 ($)
Table 29: Wireless Broadband Hotspot Equipment Market By End Use, Revenue & Volume, By Police Department, 2021-2026 ($)
Table 30: Wireless Broadband Hotspot Equipment Market By End Use, Revenue & Volume, By Fire Department, 2021-2026 ($)
Table 31: Wireless Broadband Hotspot Equipment Market By End Use, Revenue & Volume, By Emergency Medical Service Providers, 2021-2026 ($)
Table 32: Wireless Broadband Hotspot Equipment Market By End Use, Revenue & Volume, By Others, 2021-2026 ($)
Table 33: North America Wireless Broadband Hotspot Equipment Market, Revenue & Volume, By Type, 2021-2026 ($)
Table 34: North America Wireless Broadband Hotspot Equipment Market, Revenue & Volume, By End Use, 2021-2026 ($)
Table 35: South america Wireless Broadband Hotspot Equipment Market, Revenue & Volume, By Type, 2021-2026 ($)
Table 36: South america Wireless Broadband Hotspot Equipment Market, Revenue & Volume, By End Use, 2021-2026 ($)
Table 37: Europe Wireless Broadband Hotspot Equipment Market, Revenue & Volume, By Type, 2021-2026 ($)
Table 38: Europe Wireless Broadband Hotspot Equipment Market, Revenue & Volume, By End Use, 2021-2026 ($)
Table 39: APAC Wireless Broadband Hotspot Equipment Market, Revenue & Volume, By Type, 2021-2026 ($)
Table 40: APAC Wireless Broadband Hotspot Equipment Market, Revenue & Volume, By End Use, 2021-2026 ($)
Table 41: Middle East & Africa Wireless Broadband Hotspot Equipment Market, Revenue & Volume, By Type, 2021-2026 ($)
Table 42: Middle East & Africa Wireless Broadband Hotspot Equipment Market, Revenue & Volume, By End Use, 2021-2026 ($)
Table 43: Russia Wireless Broadband Hotspot Equipment Market, Revenue & Volume, By Type, 2021-2026 ($)
Table 44: Russia Wireless Broadband Hotspot Equipment Market, Revenue & Volume, By End Use, 2021-2026 ($)
Table 45: Israel Wireless Broadband Hotspot Equipment Market, Revenue & Volume, By Type, 2021-2026 ($)
Table 46: Israel Wireless Broadband Hotspot Equipment Market, Revenue & Volume, By End Use, 2021-2026 ($)
Table 47: Top Companies 2018 (US$)Wireless Broadband Hotspot Equipment Market, Revenue & Volume
Table 48: Product Launch 2018-2019Wireless Broadband Hotspot Equipment Market, Revenue & Volume
Table 49: Mergers & Acquistions 2018-2019Wireless Broadband Hotspot Equipment Market, Revenue & Volume
List of Figures
Figure 1: Overview of Wireless Broadband Hotspot Equipment Market 2021-2026
Figure 2: Market Share Analysis for Wireless Broadband Hotspot Equipment Market 2018 (US$)
Figure 3: Product Comparison in Wireless Broadband Hotspot Equipment Market 2018-2019 (US$)
Figure 4: End User Profile for Wireless Broadband Hotspot Equipment Market 2018-2019 (US$)
Figure 5: Patent Application and Grant in Wireless Broadband Hotspot Equipment Market 2013-2018* (US$)
Figure 6: Top 5 Companies Financial Analysis in Wireless Broadband Hotspot Equipment Market 2018-2019 (US$)
Figure 7: Market Entry Strategy in Wireless Broadband Hotspot Equipment Market 2018-2019
Figure 8: Ecosystem Analysis in Wireless Broadband Hotspot Equipment Market 2018
Figure 9: Average Selling Price in Wireless Broadband Hotspot Equipment Market 2021-2026
Figure 10: Top Opportunites in Wireless Broadband Hotspot Equipment Market 2018-2019
Figure 11: Market Life Cycle Analysis in Wireless Broadband Hotspot Equipment Market
Figure 12: GlobalBy TypeWireless Broadband Hotspot Equipment Market Revenue, 2021-2026 ($)
Figure 13: GlobalBy End UseWireless Broadband Hotspot Equipment Market Revenue, 2021-2026 ($)
Figure 14: Global Wireless Broadband Hotspot Equipment Market - By Geography
Figure 15: Global Wireless Broadband Hotspot Equipment Market Value & Volume, By Geography, 2021-2026 ($)
Figure 16: Global Wireless Broadband Hotspot Equipment Market CAGR, By Geography, 2021-2026 (%)
Figure 17: North America Wireless Broadband Hotspot Equipment Market Value & Volume, 2021-2026 ($)
Figure 18: US Wireless Broadband Hotspot Equipment Market Value & Volume, 2021-2026 ($)
Figure 19: US GDP and Population, 2018-2019 ($)
Figure 20: US GDP – Composition of 2018, By Sector of Origin
Figure 21: US Export and Import Value & Volume, 2018-2019 ($)
Figure 22: Canada Wireless Broadband Hotspot Equipment Market Value & Volume, 2021-2026 ($)
Figure 23: Canada GDP and Population, 2018-2019 ($)
Figure 24: Canada GDP – Composition of 2018, By Sector of Origin
Figure 25: Canada Export and Import Value & Volume, 2018-2019 ($)
Figure 26: Mexico Wireless Broadband Hotspot Equipment Market Value & Volume, 2021-2026 ($)
Figure 27: Mexico GDP and Population, 2018-2019 ($)
Figure 28: Mexico GDP – Composition of 2018, By Sector of Origin
Figure 29: Mexico Export and Import Value & Volume, 2018-2019 ($)
Figure 30: South America Wireless Broadband Hotspot Equipment Market Value & Volume, 2021-2026 ($)
Figure 31: Brazil Wireless Broadband Hotspot Equipment Market Value & Volume, 2021-2026 ($)
Figure 32: Brazil GDP and Population, 2018-2019 ($)
Figure 33: Brazil GDP – Composition of 2018, By Sector of Origin
Figure 34: Brazil Export and Import Value & Volume, 2018-2019 ($)
Figure 35: Venezuela Wireless Broadband Hotspot Equipment Market Value & Volume, 2021-2026 ($)
Figure 36: Venezuela GDP and Population, 2018-2019 ($)
Figure 37: Venezuela GDP – Composition of 2018, By Sector of Origin
Figure 38: Venezuela Export and Import Value & Volume, 2018-2019 ($)
Figure 39: Argentina Wireless Broadband Hotspot Equipment Market Value & Volume, 2021-2026 ($)
Figure 40: Argentina GDP and Population, 2018-2019 ($)
Figure 41: Argentina GDP – Composition of 2018, By Sector of Origin
Figure 42: Argentina Export and Import Value & Volume, 2018-2019 ($)
Figure 43: Ecuador Wireless Broadband Hotspot Equipment Market Value & Volume, 2021-2026 ($)
Figure 44: Ecuador GDP and Population, 2018-2019 ($)
Figure 45: Ecuador GDP – Composition of 2018, By Sector of Origin
Figure 46: Ecuador Export and Import Value & Volume, 2018-2019 ($)
Figure 47: Peru Wireless Broadband Hotspot Equipment Market Value & Volume, 2021-2026 ($)
Figure 48: Peru GDP and Population, 2018-2019 ($)
Figure 49: Peru GDP – Composition of 2018, By Sector of Origin
Figure 50: Peru Export and Import Value & Volume, 2018-2019 ($)
Figure 51: Colombia Wireless Broadband Hotspot Equipment Market Value & Volume, 2021-2026 ($)
Figure 52: Colombia GDP and Population, 2018-2019 ($)
Figure 53: Colombia GDP – Composition of 2018, By Sector of Origin
Figure 54: Colombia Export and Import Value & Volume, 2018-2019 ($)
Figure 55: Costa Rica Wireless Broadband Hotspot Equipment Market Value & Volume, 2021-2026 ($)
Figure 56: Costa Rica GDP and Population, 2018-2019 ($)
Figure 57: Costa Rica GDP – Composition of 2018, By Sector of Origin
Figure 58: Costa Rica Export and Import Value & Volume, 2018-2019 ($)
Figure 59: Europe Wireless Broadband Hotspot Equipment Market Value & Volume, 2021-2026 ($)
Figure 60: U.K Wireless Broadband Hotspot Equipment Market Value & Volume, 2021-2026 ($)
Figure 61: U.K GDP and Population, 2018-2019 ($)
Figure 62: U.K GDP – Composition of 2018, By Sector of Origin
Figure 63: U.K Export and Import Value & Volume, 2018-2019 ($)
Figure 64: Germany Wireless Broadband Hotspot Equipment Market Value & Volume, 2021-2026 ($)
Figure 65: Germany GDP and Population, 2018-2019 ($)
Figure 66: Germany GDP – Composition of 2018, By Sector of Origin
Figure 67: Germany Export and Import Value & Volume, 2018-2019 ($)
Figure 68: Italy Wireless Broadband Hotspot Equipment Market Value & Volume, 2021-2026 ($)
Figure 69: Italy GDP and Population, 2018-2019 ($)
Figure 70: Italy GDP – Composition of 2018, By Sector of Origin
Figure 71: Italy Export and Import Value & Volume, 2018-2019 ($)
Figure 72: France Wireless Broadband Hotspot Equipment Market Value & Volume, 2021-2026 ($)
Figure 73: France GDP and Population, 2018-2019 ($)
Figure 74: France GDP – Composition of 2018, By Sector of Origin
Figure 75: France Export and Import Value & Volume, 2018-2019 ($)
Figure 76: Netherlands Wireless Broadband Hotspot Equipment Market Value & Volume, 2021-2026 ($)
Figure 77: Netherlands GDP and Population, 2018-2019 ($)
Figure 78: Netherlands GDP – Composition of 2018, By Sector of Origin
Figure 79: Netherlands Export and Import Value & Volume, 2018-2019 ($)
Figure 80: Belgium Wireless Broadband Hotspot Equipment Market Value & Volume, 2021-2026 ($)
Figure 81: Belgium GDP and Population, 2018-2019 ($)
Figure 82: Belgium GDP – Composition of 2018, By Sector of Origin
Figure 83: Belgium Export and Import Value & Volume, 2018-2019 ($)
Figure 84: Spain Wireless Broadband Hotspot Equipment Market Value & Volume, 2021-2026 ($)
Figure 85: Spain GDP and Population, 2018-2019 ($)
Figure 86: Spain GDP – Composition of 2018, By Sector of Origin
Figure 87: Spain Export and Import Value & Volume, 2018-2019 ($)
Figure 88: Denmark Wireless Broadband Hotspot Equipment Market Value & Volume, 2021-2026 ($)
Figure 89: Denmark GDP and Population, 2018-2019 ($)
Figure 90: Denmark GDP – Composition of 2018, By Sector of Origin
Figure 91: Denmark Export and Import Value & Volume, 2018-2019 ($)
Figure 92: APAC Wireless Broadband Hotspot Equipment Market Value & Volume, 2021-2026 ($)
Figure 93: China Wireless Broadband Hotspot Equipment Market Value & Volume, 2021-2026
Figure 94: China GDP and Population, 2018-2019 ($)
Figure 95: China GDP – Composition of 2018, By Sector of Origin
Figure 96: China Export and Import Value & Volume, 2018-2019 ($)Wireless Broadband Hotspot Equipment Market China Export and Import Value & Volume, 2018-2019 ($)
Figure 97: Australia Wireless Broadband Hotspot Equipment Market Value & Volume, 2021-2026 ($)
Figure 98: Australia GDP and Population, 2018-2019 ($)
Figure 99: Australia GDP – Composition of 2018, By Sector of Origin
Figure 100: Australia Export and Import Value & Volume, 2018-2019 ($)
Figure 101: South Korea Wireless Broadband Hotspot Equipment Market Value & Volume, 2021-2026 ($)
Figure 102: South Korea GDP and Population, 2018-2019 ($)
Figure 103: South Korea GDP – Composition of 2018, By Sector of Origin
Figure 104: South Korea Export and Import Value & Volume, 2018-2019 ($)
Figure 105: India Wireless Broadband Hotspot Equipment Market Value & Volume, 2021-2026 ($)
Figure 106: India GDP and Population, 2018-2019 ($)
Figure 107: India GDP – Composition of 2018, By Sector of Origin
Figure 108: India Export and Import Value & Volume, 2018-2019 ($)
Figure 109: Taiwan Wireless Broadband Hotspot Equipment Market Value & Volume, 2021-2026 ($)
Figure 110: Taiwan GDP and Population, 2018-2019 ($)
Figure 111: Taiwan GDP – Composition of 2018, By Sector of Origin
Figure 112: Taiwan Export and Import Value & Volume, 2018-2019 ($)
Figure 113: Malaysia Wireless Broadband Hotspot Equipment Market Value & Volume, 2021-2026 ($)
Figure 114: Malaysia GDP and Population, 2018-2019 ($)
Figure 115: Malaysia GDP – Composition of 2018, By Sector of Origin
Figure 116: Malaysia Export and Import Value & Volume, 2018-2019 ($)
Figure 117: Hong Kong Wireless Broadband Hotspot Equipment Market Value & Volume, 2021-2026 ($)
Figure 118: Hong Kong GDP and Population, 2018-2019 ($)
Figure 119: Hong Kong GDP – Composition of 2018, By Sector of Origin
Figure 120: Hong Kong Export and Import Value & Volume, 2018-2019 ($)
Figure 121: Middle East & Africa Wireless Broadband Hotspot Equipment Market Middle East & Africa 3D Printing Market Value & Volume, 2021-2026 ($)
Figure 122: Russia Wireless Broadband Hotspot Equipment Market Value & Volume, 2021-2026 ($)
Figure 123: Russia GDP and Population, 2018-2019 ($)
Figure 124: Russia GDP – Composition of 2018, By Sector of Origin
Figure 125: Russia Export and Import Value & Volume, 2018-2019 ($)
Figure 126: Israel Wireless Broadband Hotspot Equipment Market Value & Volume, 2021-2026 ($)
Figure 127: Israel GDP and Population, 2018-2019 ($)
Figure 128: Israel GDP – Composition of 2018, By Sector of Origin
Figure 129: Israel Export and Import Value & Volume, 2018-2019 ($)
Figure 130: Entropy Share, By Strategies, 2018-2019* (%)Wireless Broadband Hotspot Equipment Market
Figure 131: Developments, 2018-2019*Wireless Broadband Hotspot Equipment Market
Figure 132: Company 1 Wireless Broadband Hotspot Equipment Market Net Revenue, By Years, 2018-2019* ($)
Figure 133: Company 1 Wireless Broadband Hotspot Equipment Market Net Revenue Share, By Business segments, 2018 (%)
Figure 134: Company 1 Wireless Broadband Hotspot Equipment Market Net Sales Share, By Geography, 2018 (%)
Figure 135: Company 2 Wireless Broadband Hotspot Equipment Market Net Revenue, By Years, 2018-2019* ($)
Figure 136: Company 2 Wireless Broadband Hotspot Equipment Market Net Revenue Share, By Business segments, 2018 (%)
Figure 137: Company 2 Wireless Broadband Hotspot Equipment Market Net Sales Share, By Geography, 2018 (%)
Figure 138: Company 3 Wireless Broadband Hotspot Equipment Market Net Revenue, By Years, 2018-2019* ($)
Figure 139: Company 3 Wireless Broadband Hotspot Equipment Market Net Revenue Share, By Business segments, 2018 (%)
Figure 140: Company 3 Wireless Broadband Hotspot Equipment Market Net Sales Share, By Geography, 2018 (%)
Figure 141: Company 4 Wireless Broadband Hotspot Equipment Market Net Revenue, By Years, 2018-2019* ($)
Figure 142: Company 4 Wireless Broadband Hotspot Equipment Market Net Revenue Share, By Business segments, 2018 (%)
Figure 143: Company 4 Wireless Broadband Hotspot Equipment Market Net Sales Share, By Geography, 2018 (%)
Figure 144: Company 5 Wireless Broadband Hotspot Equipment Market Net Revenue, By Years, 2018-2019* ($)
Figure 145: Company 5 Wireless Broadband Hotspot Equipment Market Net Revenue Share, By Business segments, 2018 (%)
Figure 146: Company 5 Wireless Broadband Hotspot Equipment Market Net Sales Share, By Geography, 2018 (%)
Figure 147: Company 6 Wireless Broadband Hotspot Equipment Market Net Revenue, By Years, 2018-2019* ($)
Figure 148: Company 6 Wireless Broadband Hotspot Equipment Market Net Revenue Share, By Business segments, 2018 (%)
Figure 149: Company 6 Wireless Broadband Hotspot Equipment Market Net Sales Share, By Geography, 2018 (%)
Figure 150: Company 7 Wireless Broadband Hotspot Equipment Market Net Revenue, By Years, 2018-2019* ($)
Figure 151: Company 7 Wireless Broadband Hotspot Equipment Market Net Revenue Share, By Business segments, 2018 (%)
Figure 152: Company 7 Wireless Broadband Hotspot Equipment Market Net Sales Share, By Geography, 2018 (%)
Figure 153: Company 8 Wireless Broadband Hotspot Equipment Market Net Revenue, By Years, 2018-2019* ($)
Figure 154: Company 8 Wireless Broadband Hotspot Equipment Market Net Revenue Share, By Business segments, 2018 (%)
Figure 155: Company 8 Wireless Broadband Hotspot Equipment Market Net Sales Share, By Geography, 2018 (%)
Figure 156: Company 9 Wireless Broadband Hotspot Equipment Market Net Revenue, By Years, 2018-2019* ($)
Figure 157: Company 9 Wireless Broadband Hotspot Equipment Market Net Revenue Share, By Business segments, 2018 (%)
Figure 158: Company 9 Wireless Broadband Hotspot Equipment Market Net Sales Share, By Geography, 2018 (%)
Figure 159: Company 10 Wireless Broadband Hotspot Equipment Market Net Revenue, By Years, 2018-2019* ($)
Figure 160: Company 10 Wireless Broadband Hotspot Equipment Market Net Revenue Share, By Business segments, 2018 (%)
Figure 161: Company 10 Wireless Broadband Hotspot Equipment Market Net Sales Share, By Geography, 2018 (%)
Figure 162: Company 11 Wireless Broadband Hotspot Equipment Market Net Revenue, By Years, 2018-2019* ($)
Figure 163: Company 11 Wireless Broadband Hotspot Equipment Market Net Revenue Share, By Business segments, 2018 (%)
Figure 164: Company 11 Wireless Broadband Hotspot Equipment Market Net Sales Share, By Geography, 2018 (%)
Figure 165: Company 12 Wireless Broadband Hotspot Equipment Market Net Revenue, By Years, 2018-2019* ($)
Figure 166: Company 12 Wireless Broadband Hotspot Equipment Market Net Revenue Share, By Business segments, 2018 (%)
Figure 167: Company 12 Wireless Broadband Hotspot Equipment Market Net Sales Share, By Geography, 2018 (%)
Figure 168: Company 13 Wireless Broadband Hotspot Equipment Market Net Revenue, By Years, 2018-2019* ($)
Figure 169: Company 13 Wireless Broadband Hotspot Equipment Market Net Revenue Share, By Business segments, 2018 (%)
Figure 170: Company 13 Wireless Broadband Hotspot Equipment Market Net Sales Share, By Geography, 2018 (%)
Figure 171: Company 14 Wireless Broadband Hotspot Equipment Market Net Revenue, By Years, 2018-2019* ($)
Figure 172: Company 14 Wireless Broadband Hotspot Equipment Market Net Revenue Share, By Business segments, 2018 (%)
Figure 173: Company 14 Wireless Broadband Hotspot Equipment Market Net Sales Share, By Geography, 2018 (%)
Figure 174: Company 15 Wireless Broadband Hotspot Equipment Market Net Revenue, By Years, 2018-2019* ($)
Figure 175: Company 15 Wireless Broadband Hotspot Equipment Market Net Revenue Share, By Business segments, 2018 (%)
Figure 176: Company 15 Wireless Broadband Hotspot Equipment Market Net Sales Share, By Geography, 2018 (%)