 Email
Email Print
Print


Augmented Reality & Virtual Reality Market for Retail Industry - Forecast(2024 - 2030)
Augmented Reality & Virtual Reality Market for Retail Industry Overview
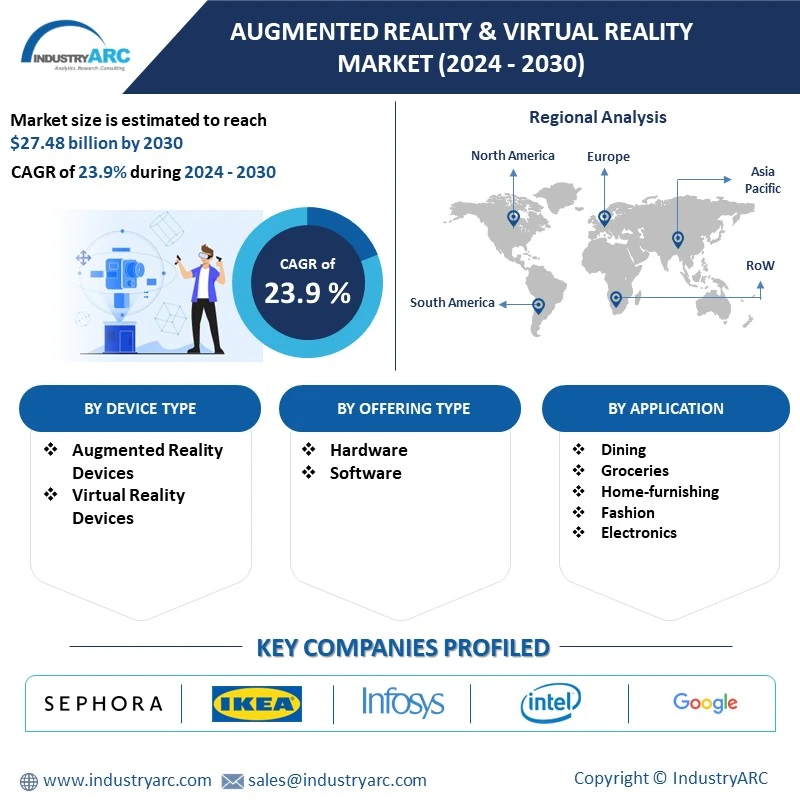
Augmented Reality & Virtual Reality Market for Retail Industry size is estimated to reach USD 27.48 Billion by 2030, after growing at a CAGR of 23.9% during 2024-2030. The Augmented Reality (AR) and Virtual Reality (VR) market in the retail industry is experiencing significant growth, driven by technological advancements and changing consumer preferences. AR and VR technologies are revolutionizing the shopping experience, offering retailers innovative ways to engage customers and enhance their overall journey. In the retail sector, AR is commonly used to provide consumers with an interactive and immersive experience. Retailers leverage AR applications for virtual try-ons, allowing customers to visualize products before making a purchase. Virtual showrooms and interactive displays powered by AR enhance the in-store experience, making it more engaging and personalized. On the other hand, VR is finding applications in virtual shopping environments, enabling consumers to explore products and make purchases from the comfort of their homes. VR is also being employed for employee training, improving efficiency, and customer service within the retail sector. The adoption of AR and VR in the retail industry is fuelled by a growing demand for seamless and personalized shopping experiences. These technologies not only attract customers but also contribute to increased sales and brand loyalty. As the technology continues to mature, the cost of AR and VR devices is expected to decrease, further accelerating their integration into the retail landscape. As a result, AR and VR in retail have grown due to tech advancements and consumer desire for immersive shopping. Continued expansion is imminent with personalized experiences driving demand in the forecast period.
Market Snapshot:
Report Coverage
The Report “Augmented Reality & Virtual Reality Market for Retail Industry– Forecast (2024-2030)”, by IndustryARC, covers an in-depth analysis of the following segments of the Augmented Reality & Virtual Reality Market for Retail Industry.
By Device Type: Augmented Reality Devices (Head-Mounted Displays, Head-Up Displays (HUD), Handheld Devices), Virtual Reality Devices (Head-Mounted Displays (HMD), Gesture Control Devices, Data Gloves, Others)
By Offering Type: Hardware, and Software
By Application: Groceries, Dining, Home-furnishing, Fashion, Electronics, Others
By Geography: North America, South America, Europe, Asia Pacific, and Row
Key Takeaways
• The Asia Pacific region dominating the Augmented Reality & Virtual Reality Market for Retail Industry share of 38.5% in 2023. The Asia Pacific region's retail sector is driving robust demand for Augmented Reality (AR) and Virtual Reality (VR) technologies, revolutionizing the shopping experience. AR/VR in retail enhances customer engagement, boosts in-store interactions, and transforms the industry by seamlessly integrating digital and physical realms for an immersive shopping journey.
• Growing consumer interest, desire for unique shopping experiences, and technological advancements drive demand for AR and VR in retail, enhancing engagement and revolutionizing the customer shopping journey.
• Integration with other emerging technologies like 5G, artificial intelligence (AI), and the Internet of Things (IoT) is contributing to the expansion of AR and VR use cases.

Application - Segment Analysis
The AR device segment held a significant share in the augmented Reality and Virtual Reality Market for the Retail Industry market in 2023. The demand for AR technology in retail is driven by its ability to enhance the customer shopping experience, providing immersive and interactive elements. AR devices, such as smart glasses and mobile applications, play a pivotal role in bridging the gap between physical and digital retail spaces. Retailers leverage AR to offer virtual try-on experiences, product information overlays, and interactive in-store navigation, creating a more engaging and personalized shopping environment. As consumer expectations evolve, the adoption of AR in retail is propelled by its capacity to blend the online and offline retail realms seamlessly. This transformative technology not only boosts customer satisfaction but also empowers retailers to stay competitive in an increasingly digital landscape.
Application - Segment Analysis
The fashion segment held a significant share of the Augmented Reality and Virtual Reality Market for the Retail Industry in 2023. Fashion leads in AR and VR retail adoption, with virtual try-ons for apparel, eyewear, footwear, jewelry, and cosmetics. Seamless integration revolutionizes the customer experience and boosts sales. This transformative capability revolutionizes the traditional retail landscape, offering consumers the opportunity to virtually experiment with various styles and products before making a purchase. Major players in the fashion industry, such as Sephora, Nike, and Adidas, have spearheaded the utilization of AR in retail, amplifying the overall customer experience. Virtual try-on applications for clothing, shoes, and accessories have gained remarkable traction, enabling consumers to make informed and confident decisions while enhancing engagement with brands. The demand for AR and VR in the fashion sector is driven by the desire for immersive, personalized, and interactive shopping experiences, positioning this segment as a dominant force shaping the future of retail technology. As technology continues to advance, the fashion industry is poised to further capitalize on AR and VR innovations, elevating the consumer retail journey to new heights.
Geography - Segment Analysis
Asia Pacific held the largest Ammonium Acetate Market share of up to 38.5% in 2023. The Asia Pacific Augmented Reality (AR) and Virtual Reality (VR) market in the retail industry is witnessing a surge in demand, primarily fueled by the increasing adoption of smart devices. The proliferation of smartphones, in particular, is playing a pivotal role in driving this demand. As consumers increasingly rely on smartphones, these devices become a ubiquitous platform for accessing AR and VR experiences. The seamless integration of AR and VR solutions with smartphones enhances accessibility, making these technologies more user-friendly and widely adopted in the retail sector. Moreover, the demand is further propelled by the immersive and interactive experiences that AR and VR offer, revolutionizing the way consumers engage with products and services. Retailers are leveraging these technologies to create innovative and personalized shopping experiences, thereby enhancing customer engagement and satisfaction. The growing reliance on smart devices establishes a strong foundation for the continued expansion of AR and VR solutions in the Asia Pacific retail industry.
Drivers – Augmented Reality & Virtual Reality Market for Retail Industry
Growing the Demand for E-Commerce Integration with Augmented Reality (AR) and Virtual Reality
The surging demand for E-Commerce Integration of Augmented Reality (AR) and Virtual Reality (VR) in the retail industry is fueled by the transformative experience it offers. AR enables virtual product placements, letting users visualize items in their surroundings through smartphone cameras, enhancing the pre-purchase decision process. This immersive technology bridges the gap between online and offline retail, providing a realistic preview that boosts consumer confidence and drives engagement. As a result, the retail sector is witnessing a heightened desire for AR and VR integration, propelling the evolution of e-commerce into a dynamic and interactive shopping experience.
Innovative Marketing Campaigns driving the demand for Augmented Reality (AR) and Virtual Reality (VR) technologies in the retail industry
The demand for Augmented Reality (AR) and Virtual Reality (VR) technologies in the retail industry is surging as innovative marketing campaigns gain traction. AR enhances interactive advertising, generating excitement for product launches and fostering consumer engagement. Meanwhile, VR facilitates immersive storytelling, elevating brand awareness and leaving a lasting impact on consumers. The retail sector is increasingly recognizing the potential of these technologies to create unique and memorable customer experiences. As a result, the AR and VR market for the retail industry is witnessing robust growth, driven by the industry's eagerness to leverage these advanced technologies for enhancing marketing strategies and staying ahead in a competitive landscape.
Challenges – Augmented Reality & Virtual Reality Market for Retail Industry
Data Security and Privacy Concerns Hampering Augmented Reality & Virtual Reality Market Growth in the Retail Industry
The rapid growth of Augmented Reality (AR) and Virtual Reality (VR) technology in the retail industry has been hindered by concerns over data security and privacy. As AR and VR solutions involve collecting and processing customer data, businesses must prioritize implementing robust security measures and complying with privacy regulations. This includes safeguarding sensitive information such as personal details, payment data, and browsing history. Failure to address these concerns can lead to a loss of consumer trust and potential legal repercussions. To overcome these challenges, retailers need to invest in advanced data encryption techniques, conduct regular security audits, and establish transparent privacy policies. By prioritizing data security and privacy, the retail industry can fully harness the potential of AR and VR technology while ensuring customer trust and confidence.
Market Landscape
Technology launches, acquisitions, and R&D activities are key strategies adopted by players in the Augmented Reality & Virtual Reality Market for the Retail Industry. Major players in the Augmented Reality & Virtual Reality Market for the Retail Industry are Ikea, Sephora, Google LLC, Infosys Ltd, Intel Corporation, Microsoft Corporation, PTC Inc., Qualcomm Technologies, Inc., BMW, Samsung Electronics Co., and others.
Recent Developments
- In February 2022, Infosys unveiled the Infosys Metaverse Foundry, aiming to simplify and expedite enterprises' engagement with the metaverse. The platform facilitates the exploration of virtual and augmented environments for enhanced customer experiences, workplace integration, and operational advancements.
- In November 2022, Samsung is intensifying its focus on augmented and virtual reality, evident through recent trademarks and partnerships. The company seems poised for multiple device launches, signaling a significant commitment to advancing AR technologies and expanding its product lineup
For more Information and Communications Technology Market reports, please click here
1. Augmented Reality & Virtual Reality Market for Retail Industry - Overview
1.1 Definitions and Scope
2. Augmented Reality & Virtual Reality Market for Retail Industry - Executive Summary
2.1 Key Trends by Application
2.2 Key Trends by End Users
2.3 Key Trends by Geography
3. Augmented Reality & Virtual Reality Market for Retail Industry - Comparative Analysis
3.1 Company Benchmarking
3.2 Global Financial Analysis
3.3 Market Share Analysis
3.4 Patent Analysis
3.5 Pricing Analysis
4. Augmented Reality & Virtual Reality Market for Retail Industry - Start-up Companies Scenario (Premium)
4.1 Key Start-up Company Analysis by
4.1.1 Investment
4.1.2 Revenue
4.1.3 Venture Capital and Funding Scenario
5. Augmented Reality & Virtual Reality Market for Retail Industry – Market Entry Scenario Premium (Premium)
5.1 Regulatory Framework Overview
5.2 New Business and Ease of Doing Business Index
5.3 Case Studies of Successful Ventures
6. Augmented Reality & Virtual Reality Market for Retail Industry - Forces
6.1 Market Drivers
6.2 Market Constraints/Challenges
6.3 Porter’s Five Force Model
6.3.1 Bargaining power of suppliers
6.3.2 Bargaining powers of customers
6.3.3 Threat of new entrants
6.3.4 Rivalry among existing players
6.3.5 Threat of substitutes
7. Augmented Reality & Virtual Reality Market for Retail Industry – Strategic Analysis
7.1 Value Chain Analysis
7.2 Opportunities Analysis
7.3 Market Life Cycle
8. Augmented Reality & Virtual Reality Market for Retail Industry – By Device Type (Market Size -$Million/Billion)
8.1 Augmented Reality Devices
8.1.1 Head-Mounted Displays
8.1.2 Head-Up Display (HUD)
8.1.3 Handheld Device
8.2 Virtual Reality Devices
8.2.1 Head-Mounted Display (HMD)
8.2.2 Gesture Control Device
8.2.3 Data Gloves
8.2.4 Others
9. Augmented Reality & Virtual Reality Market for Retail Industry - By Offering Type (Market Size-$Million/Billion)
9.1 Hardware
9.2 Software
10. Augmented Reality & Virtual Reality Market for Retail Industry - By Application (Market Size-$Million/Billion)
10.1 Dining
10.2 Groceries
10.3 Home-furnishing
10.4 Fashion
10.4.1 Apparel
10.4.2 Eyewear
10.4.3 Footwear
10.4.4 Jewelry
10.4.5 Cosmetics
10.5 Electronics
10.6 Others
11. Augmented Reality & Virtual Reality Market for Retail Industry – by Geography (Market Size - $Million/$Billion)
11.1 North America
11.1.1 U.S.
11.1.2 Canada
11.1.3 Mexico
11.2 Europe
11.2.1 U.K.
11.2.2 Germany
11.2.3 France
11.2.4 Italy
11.2.5 Netherlands
11.2.6 Spain
11.2.7 Rest of Europe
11.3 Asia-Pacific
11.3.1 China
11.3.2 Japan
11.3.3 India
11.3.4 South Korea
11.3.5 Australia & New Zealand
11.3.6 Rest of Asia-Pacific
11.4 South America
11.4.1 Brazil
11.4.2 Argentina
11.4.3 Chile
11.4.4 Colombia
11.4.5 Rest of South America
11.5 Rest of The World
11.5.1 Middle East
11.5.2 Africa
12. Augmented Reality & Virtual Reality Market for Retail Industry - Entropy
13. Augmented Reality & Virtual Reality Market for Retail Industry – Industry/Segment Competition Landscape (Premium)
13.1 Market Share Analysis
13.1.1 Global Market Share – Key Companies
13.1.2 Market Share by Region – Key Companies
13.1.3 Market Share by Countries – Key Companies
13.2 Competition Matrix
13.3 Best Practices for Companies
14. Augmented Reality & Virtual Reality Market for Retail Industry – Key Company List by Country Premium (Premium)
15. Augmented Reality & Virtual Reality Market for Retail Industry - Company Analysis
15.1 Ikea
15.2 Sephora
15.3 Google LLC
15.4 Infosys Ltd
15.5 Intel Corporation
15.6 Microsoft Corporation
15.7 PTC Inc.
15.8 Qualcomm Technologies, Inc.
15.9 BMW
15.10 Samsung Electronics Co.
* "Financials would be provided to private companies on best-efforts basis."
Connect with our experts to get customized reports that best suit your requirements. Our reports include global-level data, niche markets and competitive landscape
List of Tables
Table 1: Augmented Reality & Virtual Reality Market for Retail Industry Overview 2021-2026
Table 2: Augmented Reality & Virtual Reality Market for Retail Industry Leader Analysis 2018-2019 (US$)
Table 3: Augmented Reality & Virtual Reality Market for Retail Industry Product Analysis 2018-2019 (US$)
Table 4: Augmented Reality & Virtual Reality Market for Retail Industry End User Analysis 2018-2019 (US$)
Table 5: Augmented Reality & Virtual Reality Market for Retail Industry Patent Analysis 2013-2018* (US$)
Table 6: Augmented Reality & Virtual Reality Market for Retail Industry Financial Analysis 2018-2019 (US$)
Table 7: Augmented Reality & Virtual Reality Market for Retail Industry Driver Analysis 2018-2019 (US$)
Table 8: Augmented Reality & Virtual Reality Market for Retail Industry Challenges Analysis 2018-2019 (US$)
Table 9: Augmented Reality & Virtual Reality Market for Retail Industry Constraint Analysis 2018-2019 (US$)
Table 10: Augmented Reality & Virtual Reality Market for Retail Industry Supplier Bargaining Power Analysis 2018-2019 (US$)
Table 11: Augmented Reality & Virtual Reality Market for Retail Industry Buyer Bargaining Power Analysis 2018-2019 (US$)
Table 12: Augmented Reality & Virtual Reality Market for Retail Industry Threat of Substitutes Analysis 2018-2019 (US$)
Table 13: Augmented Reality & Virtual Reality Market for Retail Industry Threat of New Entrants Analysis 2018-2019 (US$)
Table 14: Augmented Reality & Virtual Reality Market for Retail Industry Degree of Competition Analysis 2018-2019 (US$)
Table 15: Augmented Reality & Virtual Reality Market for Retail Industry Value Chain Analysis 2018-2019 (US$)
Table 16: Augmented Reality & Virtual Reality Market for Retail Industry Pricing Analysis 2021-2026 (US$)
Table 17: Augmented Reality & Virtual Reality Market for Retail Industry Opportunities Analysis 2021-2026 (US$)
Table 18: Augmented Reality & Virtual Reality Market for Retail Industry Product Life Cycle Analysis 2021-2026 (US$)
Table 19: Augmented Reality & Virtual Reality Market for Retail Industry Supplier Analysis 2018-2019 (US$)
Table 20: Augmented Reality & Virtual Reality Market for Retail Industry Distributor Analysis 2018-2019 (US$)
Table 21: Augmented Reality & Virtual Reality Market for Retail Industry Trend Analysis 2018-2019 (US$)
Table 22: Augmented Reality & Virtual Reality Market for Retail Industry Size 2018 (US$)
Table 23: Augmented Reality & Virtual Reality Market for Retail Industry Forecast Analysis 2021-2026 (US$)
Table 24: Augmented Reality & Virtual Reality Market for Retail Industry Sales Forecast Analysis 2021-2026 (Units)
Table 25: Augmented Reality & Virtual Reality Market for Retail Industry, Revenue & Volume, By Device, 2021-2026 ($)
Table 26: Augmented Reality & Virtual Reality Market for Retail Industry By Device, Revenue & Volume, By Augmented Reality Devices, 2021-2026 ($)
Table 27: Augmented Reality & Virtual Reality Market for Retail Industry By Device, Revenue & Volume, By Virtual Reality Devices, 2021-2026 ($)
Table 28: Augmented Reality & Virtual Reality Market for Retail Industry By Device, Revenue & Volume, By Head-Mounted Displays, 2021-2026 ($)
Table 29: Augmented Reality & Virtual Reality Market for Retail Industry By Device, Revenue & Volume, By Head-Up Display, 2021-2026 ($)
Table 30: Augmented Reality & Virtual Reality Market for Retail Industry By Device, Revenue & Volume, By Handheld Device, 2021-2026 ($)
Table 31: Augmented Reality & Virtual Reality Market for Retail Industry, Revenue & Volume, By Application, 2021-2026 ($)
Table 32: Augmented Reality & Virtual Reality Market for Retail Industry By Application, Revenue & Volume, By Beauty & Cosmetics, 2021-2026 ($)
Table 33: Augmented Reality & Virtual Reality Market for Retail Industry By Application, Revenue & Volume, By Jewel Toning, 2021-2026 ($)
Table 34: Augmented Reality & Virtual Reality Market for Retail Industry By Application, Revenue & Volume, By Apparel Fitting, 2021-2026 ($)
Table 35: Augmented Reality & Virtual Reality Market for Retail Industry By Application, Revenue & Volume, By Furniture & Lighting, 2021-2026 ($)
Table 36: Augmented Reality & Virtual Reality Market for Retail Industry By Application, Revenue & Volume, By Grocery Shopping, 2021-2026 ($)
Table 37: North America Augmented Reality & Virtual Reality Market for Retail Industry, Revenue & Volume, By Device, 2021-2026 ($)
Table 38: North America Augmented Reality & Virtual Reality Market for Retail Industry, Revenue & Volume, By Application, 2021-2026 ($)
Table 39: South america Augmented Reality & Virtual Reality Market for Retail Industry, Revenue & Volume, By Device, 2021-2026 ($)
Table 40: South america Augmented Reality & Virtual Reality Market for Retail Industry, Revenue & Volume, By Application, 2021-2026 ($)
Table 41: Europe Augmented Reality & Virtual Reality Market for Retail Industry, Revenue & Volume, By Device, 2021-2026 ($)
Table 42: Europe Augmented Reality & Virtual Reality Market for Retail Industry, Revenue & Volume, By Application, 2021-2026 ($)
Table 43: APAC Augmented Reality & Virtual Reality Market for Retail Industry, Revenue & Volume, By Device, 2021-2026 ($)
Table 44: APAC Augmented Reality & Virtual Reality Market for Retail Industry, Revenue & Volume, By Application, 2021-2026 ($)
Table 45: Middle East & Africa Augmented Reality & Virtual Reality Market for Retail Industry, Revenue & Volume, By Device, 2021-2026 ($)
Table 46: Middle East & Africa Augmented Reality & Virtual Reality Market for Retail Industry, Revenue & Volume, By Application, 2021-2026 ($)
Table 47: Russia Augmented Reality & Virtual Reality Market for Retail Industry, Revenue & Volume, By Device, 2021-2026 ($)
Table 48: Russia Augmented Reality & Virtual Reality Market for Retail Industry, Revenue & Volume, By Application, 2021-2026 ($)
Table 49: Israel Augmented Reality & Virtual Reality Market for Retail Industry, Revenue & Volume, By Device, 2021-2026 ($)
Table 50: Israel Augmented Reality & Virtual Reality Market for Retail Industry, Revenue & Volume, By Application, 2021-2026 ($)
Table 51: Top Companies 2018 (US$) Augmented Reality & Virtual Reality Market for Retail Industry, Revenue & Volume
Table 52: Product Launch 2018-2019 Augmented Reality & Virtual Reality Market for Retail Industry, Revenue & Volume
Table 53: Mergers & Acquistions 2018-2019 Augmented Reality & Virtual Reality Market for Retail Industry, Revenue & Volume
List of Figures
Figure 1: Overview of Augmented Reality & Virtual Reality Market for Retail Industry 2021-2026
Figure 2: Market Share Analysis for Augmented Reality & Virtual Reality Market for Retail Industry 2018 (US$)
Figure 3: Product Comparison in Augmented Reality & Virtual Reality Market for Retail Industry 2018-2019 (US$)
Figure 4: End User Profile for Augmented Reality & Virtual Reality Market for Retail Industry 2018-2019 (US$)
Figure 5: Patent Application and Grant in Augmented Reality & Virtual Reality Market for Retail Industry 2013-2018* (US$)
Figure 6: Top 5 Companies Financial Analysis in Augmented Reality & Virtual Reality Market for Retail Industry 2018-2019 (US$)
Figure 7: Market Entry Strategy in Augmented Reality & Virtual Reality Market for Retail Industry 2018-2019
Figure 8: Ecosystem Analysis in Augmented Reality & Virtual Reality Market for Retail Industry 2018
Figure 9: Average Selling Price in Augmented Reality & Virtual Reality Market for Retail Industry 2021-2026
Figure 10: Top Opportunites in Augmented Reality & Virtual Reality Market for Retail Industry 2018-2019
Figure 11: Market Life Cycle Analysis in Augmented Reality & Virtual Reality Market for Retail Industry
Figure 12: GlobalBy Device Augmented Reality & Virtual Reality Market for Retail Industry Revenue, 2021-2026 ($)
Figure 13: GlobalBy Application Augmented Reality & Virtual Reality Market for Retail Industry Revenue, 2021-2026 ($)
Figure 14: Global Augmented Reality & Virtual Reality Market for Retail Industry - By Geography
Figure 15: Global Augmented Reality & Virtual Reality Market for Retail Industry Value & Volume, By Geography, 2021-2026 ($)Â
Figure 16: Global Augmented Reality & Virtual Reality Market for Retail Industry CAGR, By Geography, 2021-2026 (%)
Figure 17: North America Augmented Reality & Virtual Reality Market for Retail Industry Value & Volume, 2021-2026 ($)
Figure 18: US Augmented Reality & Virtual Reality Market for Retail Industry Value & Volume, 2021-2026 ($)
Figure 19: US GDP and Population, 2018-2019 ($)
Figure 20: US GDP – Composition of 2018, By Sector of Origin
Figure 21: US Export and Import Value & Volume, 2018-2019 ($)
Figure 22: Canada Augmented Reality & Virtual Reality Market for Retail Industry Value & Volume, 2021-2026 ($)
Figure 23: Canada GDP and Population, 2018-2019 ($)
Figure 24: Canada GDP – Composition of 2018, By Sector of Origin
Figure 25: Canada Export and Import Value & Volume, 2018-2019 ($)
Figure 26: Mexico Augmented Reality & Virtual Reality Market for Retail Industry Value & Volume, 2021-2026 ($)
Figure 27: Mexico GDP and Population, 2018-2019 ($)
Figure 28: Mexico GDP – Composition of 2018, By Sector of Origin
Figure 29: Mexico Export and Import Value & Volume, 2018-2019 ($)
Figure 30: South America Augmented Reality & Virtual Reality Market for Retail Industry Value & Volume, 2021-2026 ($)
Figure 31: Brazil Augmented Reality & Virtual Reality Market for Retail Industry Value & Volume, 2021-2026 ($)
Figure 32: Brazil GDP and Population, 2018-2019 ($)
Figure 33: Brazil GDP – Composition of 2018, By Sector of Origin
Figure 34: Brazil Export and Import Value & Volume, 2018-2019 ($)
Figure 35: Venezuela Augmented Reality & Virtual Reality Market for Retail Industry Value & Volume, 2021-2026 ($)
Figure 36: Venezuela GDP and Population, 2018-2019 ($)
Figure 37: Venezuela GDP – Composition of 2018, By Sector of Origin
Figure 38: Venezuela Export and Import Value & Volume, 2018-2019 ($)
Figure 39: Argentina Augmented Reality & Virtual Reality Market for Retail Industry Value & Volume, 2021-2026 ($)
Figure 40: Argentina GDP and Population, 2018-2019 ($)
Figure 41: Argentina GDP – Composition of 2018, By Sector of Origin
Figure 42: Argentina Export and Import Value & Volume, 2018-2019 ($)
Figure 43: Ecuador Augmented Reality & Virtual Reality Market for Retail Industry Value & Volume, 2021-2026 ($)
Figure 44: Ecuador GDP and Population, 2018-2019 ($)
Figure 45: Ecuador GDP – Composition of 2018, By Sector of Origin
Figure 46: Ecuador Export and Import Value & Volume, 2018-2019 ($)
Figure 47: Peru Augmented Reality & Virtual Reality Market for Retail Industry Value & Volume, 2021-2026 ($)
Figure 48: Peru GDP and Population, 2018-2019 ($)
Figure 49: Peru GDP – Composition of 2018, By Sector of Origin
Figure 50: Peru Export and Import Value & Volume, 2018-2019 ($)
Figure 51: Colombia Augmented Reality & Virtual Reality Market for Retail Industry Value & Volume, 2021-2026 ($)
Figure 52: Colombia GDP and Population, 2018-2019 ($)
Figure 53: Colombia GDP – Composition of 2018, By Sector of Origin
Figure 54: Colombia Export and Import Value & Volume, 2018-2019 ($)
Figure 55: Costa Rica Augmented Reality & Virtual Reality Market for Retail Industry Value & Volume, 2021-2026 ($)
Figure 56: Costa Rica GDP and Population, 2018-2019 ($)
Figure 57: Costa Rica GDP – Composition of 2018, By Sector of Origin
Figure 58: Costa Rica Export and Import Value & Volume, 2018-2019 ($)
Figure 59: Europe Augmented Reality & Virtual Reality Market for Retail Industry Value & Volume, 2021-2026 ($)
Figure 60: U.K Augmented Reality & Virtual Reality Market for Retail Industry Value & Volume, 2021-2026 ($)
Figure 61: U.K GDP and Population, 2018-2019 ($)
Figure 62: U.K GDP – Composition of 2018, By Sector of Origin
Figure 63: U.K Export and Import Value & Volume, 2018-2019 ($)
Figure 64: Germany Augmented Reality & Virtual Reality Market for Retail Industry Value & Volume, 2021-2026 ($)
Figure 65: Germany GDP and Population, 2018-2019 ($)
Figure 66: Germany GDP – Composition of 2018, By Sector of Origin
Figure 67: Germany Export and Import Value & Volume, 2018-2019 ($)
Figure 68: Italy Augmented Reality & Virtual Reality Market for Retail Industry Value & Volume, 2021-2026 ($)
Figure 69: Italy GDP and Population, 2018-2019 ($)
Figure 70: Italy GDP – Composition of 2018, By Sector of Origin
Figure 71: Italy Export and Import Value & Volume, 2018-2019 ($)
Figure 72: France Augmented Reality & Virtual Reality Market for Retail Industry Value & Volume, 2021-2026 ($)
Figure 73: France GDP and Population, 2018-2019 ($)
Figure 74: France GDP – Composition of 2018, By Sector of Origin
Figure 75: France Export and Import Value & Volume, 2018-2019 ($)
Figure 76: Netherlands Augmented Reality & Virtual Reality Market for Retail Industry Value & Volume, 2021-2026 ($)
Figure 77: Netherlands GDP and Population, 2018-2019 ($)
Figure 78: Netherlands GDP – Composition of 2018, By Sector of Origin
Figure 79: Netherlands Export and Import Value & Volume, 2018-2019 ($)
Figure 80: Belgium Augmented Reality & Virtual Reality Market for Retail Industry Value & Volume, 2021-2026 ($)
Figure 81: Belgium GDP and Population, 2018-2019 ($)
Figure 82: Belgium GDP – Composition of 2018, By Sector of Origin
Figure 83: Belgium Export and Import Value & Volume, 2018-2019 ($)
Figure 84: Spain Augmented Reality & Virtual Reality Market for Retail Industry Value & Volume, 2021-2026 ($)
Figure 85: Spain GDP and Population, 2018-2019 ($)
Figure 86: Spain GDP – Composition of 2018, By Sector of Origin
Figure 87: Spain Export and Import Value & Volume, 2018-2019 ($)
Figure 88: Denmark Augmented Reality & Virtual Reality Market for Retail Industry Value & Volume, 2021-2026 ($)
Figure 89: Denmark GDP and Population, 2018-2019 ($)
Figure 90: Denmark GDP – Composition of 2018, By Sector of Origin
Figure 91: Denmark Export and Import Value & Volume, 2018-2019 ($)
Figure 92: APAC Augmented Reality & Virtual Reality Market for Retail Industry Value & Volume, 2021-2026 ($)
Figure 93: China Augmented Reality & Virtual Reality Market for Retail Industry Value & Volume, 2021-2026
Figure 94: China GDP and Population, 2018-2019 ($)
Figure 95: China GDP – Composition of 2018, By Sector of Origin
Figure 96: China Export and Import Value & Volume, 2018-2019 ($) Augmented Reality & Virtual Reality Market for Retail Industry China Export and Import Value & Volume, 2018-2019 ($)
Figure 97: Australia Augmented Reality & Virtual Reality Market for Retail Industry Value & Volume, 2021-2026 ($)
Figure 98: Australia GDP and Population, 2018-2019 ($)
Figure 99: Australia GDP – Composition of 2018, By Sector of Origin
Figure 100: Australia Export and Import Value & Volume, 2018-2019 ($)
Figure 101: South Korea Augmented Reality & Virtual Reality Market for Retail Industry Value & Volume, 2021-2026 ($)
Figure 102: South Korea GDP and Population, 2018-2019 ($)
Figure 103: South Korea GDP – Composition of 2018, By Sector of Origin
Figure 104: South Korea Export and Import Value & Volume, 2018-2019 ($)
Figure 105: India Augmented Reality & Virtual Reality Market for Retail Industry Value & Volume, 2021-2026 ($)
Figure 106: India GDP and Population, 2018-2019 ($)
Figure 107: India GDP – Composition of 2018, By Sector of Origin
Figure 108: India Export and Import Value & Volume, 2018-2019 ($)
Figure 109: Taiwan Augmented Reality & Virtual Reality Market for Retail Industry Value & Volume, 2021-2026 ($)
Figure 110: Taiwan GDP and Population, 2018-2019 ($)
Figure 111: Taiwan GDP – Composition of 2018, By Sector of Origin
Figure 112: Taiwan Export and Import Value & Volume, 2018-2019 ($)
Figure 113: Malaysia Augmented Reality & Virtual Reality Market for Retail Industry Value & Volume, 2021-2026 ($)
Figure 114: Malaysia GDP and Population, 2018-2019 ($)
Figure 115: Malaysia GDP – Composition of 2018, By Sector of Origin
Figure 116: Malaysia Export and Import Value & Volume, 2018-2019 ($)
Figure 117: Hong Kong Augmented Reality & Virtual Reality Market for Retail Industry Value & Volume, 2021-2026 ($)
Figure 118: Hong Kong GDP and Population, 2018-2019 ($)
Figure 119: Hong Kong GDP – Composition of 2018, By Sector of Origin
Figure 120: Hong Kong Export and Import Value & Volume, 2018-2019 ($)
Figure 121: Middle East & Africa Augmented Reality & Virtual Reality Market for Retail Industry Middle East & Africa 3D Printing Market Value & Volume, 2021-2026 ($)
Figure 122: Russia Augmented Reality & Virtual Reality Market for Retail Industry Value & Volume, 2021-2026 ($)
Figure 123: Russia GDP and Population, 2018-2019 ($)
Figure 124: Russia GDP – Composition of 2018, By Sector of Origin
Figure 125: Russia Export and Import Value & Volume, 2018-2019 ($)
Figure 126: Israel Augmented Reality & Virtual Reality Market for Retail Industry Value & Volume, 2021-2026 ($)
Figure 127: Israel GDP and Population, 2018-2019 ($)
Figure 128: Israel GDP – Composition of 2018, By Sector of Origin
Figure 129: Israel Export and Import Value & Volume, 2018-2019 ($)
Figure 130: Entropy Share, By Strategies, 2018-2019* (%) Augmented Reality & Virtual Reality Market for Retail Industry
Figure 131: Developments, 2018-2019* Augmented Reality & Virtual Reality Market for Retail Industry
Figure 132: Company 1 Augmented Reality & Virtual Reality Market for Retail Industry Net Revenue, By Years, 2018-2019* ($)
Figure 133: Company 1 Augmented Reality & Virtual Reality Market for Retail Industry Net Revenue Share, By Business segments, 2018 (%)
Figure 134: Company 1 Augmented Reality & Virtual Reality Market for Retail Industry Net Sales Share, By Geography, 2018 (%)
Figure 135: Company 2 Augmented Reality & Virtual Reality Market for Retail Industry Net Revenue, By Years, 2018-2019* ($)
Figure 136: Company 2 Augmented Reality & Virtual Reality Market for Retail Industry Net Revenue Share, By Business segments, 2018 (%)
Figure 137: Company 2 Augmented Reality & Virtual Reality Market for Retail Industry Net Sales Share, By Geography, 2018 (%)
Figure 138: Company 3 Augmented Reality & Virtual Reality Market for Retail Industry Net Revenue, By Years, 2018-2019* ($)
Figure 139: Company 3 Augmented Reality & Virtual Reality Market for Retail Industry Net Revenue Share, By Business segments, 2018 (%)
Figure 140: Company 3 Augmented Reality & Virtual Reality Market for Retail Industry Net Sales Share, By Geography, 2018 (%)
Figure 141: Company 4 Augmented Reality & Virtual Reality Market for Retail Industry Net Revenue, By Years, 2018-2019* ($)
Figure 142: Company 4 Augmented Reality & Virtual Reality Market for Retail Industry Net Revenue Share, By Business segments, 2018 (%)
Figure 143: Company 4 Augmented Reality & Virtual Reality Market for Retail Industry Net Sales Share, By Geography, 2018 (%)
Figure 144: Company 5 Augmented Reality & Virtual Reality Market for Retail Industry Net Revenue, By Years, 2018-2019* ($)
Figure 145: Company 5 Augmented Reality & Virtual Reality Market for Retail Industry Net Revenue Share, By Business segments, 2018 (%)
Figure 146: Company 5 Augmented Reality & Virtual Reality Market for Retail Industry Net Sales Share, By Geography, 2018 (%)
Figure 147: Company 6 Augmented Reality & Virtual Reality Market for Retail Industry Net Revenue, By Years, 2018-2019* ($)
Figure 148: Company 6 Augmented Reality & Virtual Reality Market for Retail Industry Net Revenue Share, By Business segments, 2018 (%)
Figure 149: Company 6 Augmented Reality & Virtual Reality Market for Retail Industry Net Sales Share, By Geography, 2018 (%)
Figure 150: Company 7 Augmented Reality & Virtual Reality Market for Retail Industry Net Revenue, By Years, 2018-2019* ($)
Figure 151: Company 7 Augmented Reality & Virtual Reality Market for Retail Industry Net Revenue Share, By Business segments, 2018 (%)
Figure 152: Company 7 Augmented Reality & Virtual Reality Market for Retail Industry Net Sales Share, By Geography, 2018 (%)
Figure 153: Company 8 Augmented Reality & Virtual Reality Market for Retail Industry Net Revenue, By Years, 2018-2019* ($)
Figure 154: Company 8 Augmented Reality & Virtual Reality Market for Retail Industry Net Revenue Share, By Business segments, 2018 (%)
Figure 155: Company 8 Augmented Reality & Virtual Reality Market for Retail Industry Net Sales Share, By Geography, 2018 (%)
Figure 156: Company 9 Augmented Reality & Virtual Reality Market for Retail Industry Net Revenue, By Years, 2018-2019* ($)
Figure 157: Company 9 Augmented Reality & Virtual Reality Market for Retail Industry Net Revenue Share, By Business segments, 2018 (%)
Figure 158: Company 9 Augmented Reality & Virtual Reality Market for Retail Industry Net Sales Share, By Geography, 2018 (%)
Figure 159: Company 10 Augmented Reality & Virtual Reality Market for Retail Industry Net Revenue, By Years, 2018-2019* ($)
Figure 160: Company 10 Augmented Reality & Virtual Reality Market for Retail Industry Net Revenue Share, By Business segments, 2018 (%)
Figure 161: Company 10 Augmented Reality & Virtual Reality Market for Retail Industry Net Sales Share, By Geography, 2018 (%)
Figure 162: Company 11 Augmented Reality & Virtual Reality Market for Retail Industry Net Revenue, By Years, 2018-2019* ($)
Figure 163: Company 11 Augmented Reality & Virtual Reality Market for Retail Industry Net Revenue Share, By Business segments, 2018 (%)
Figure 164: Company 11 Augmented Reality & Virtual Reality Market for Retail Industry Net Sales Share, By Geography, 2018 (%)
Figure 165: Company 12 Augmented Reality & Virtual Reality Market for Retail Industry Net Revenue, By Years, 2018-2019* ($)
Figure 166: Company 12 Augmented Reality & Virtual Reality Market for Retail Industry Net Revenue Share, By Business segments, 2018 (%)
Figure 167: Company 12 Augmented Reality & Virtual Reality Market for Retail Industry Net Sales Share, By Geography, 2018 (%)
Figure 168: Company 13 Augmented Reality & Virtual Reality Market for Retail Industry Net Revenue, By Years, 2018-2019* ($)
Figure 169: Company 13 Augmented Reality & Virtual Reality Market for Retail Industry Net Revenue Share, By Business segments, 2018 (%)
Figure 170: Company 13 Augmented Reality & Virtual Reality Market for Retail Industry Net Sales Share, By Geography, 2018 (%)
Figure 171: Company 14 Augmented Reality & Virtual Reality Market for Retail Industry Net Revenue, By Years, 2018-2019* ($)
Figure 172: Company 14 Augmented Reality & Virtual Reality Market for Retail Industry Net Revenue Share, By Business segments, 2018 (%)
Figure 173: Company 14 Augmented Reality & Virtual Reality Market for Retail Industry Net Sales Share, By Geography, 2018 (%)
Figure 174: Company 15 Augmented Reality & Virtual Reality Market for Retail Industry Net Revenue, By Years, 2018-2019* ($)
Figure 175: Company 15 Augmented Reality & Virtual Reality Market for Retail Industry Net Revenue Share, By Business segments, 2018 (%)
Figure 176: Company 15 Augmented Reality & Virtual Reality Market for Retail Industry Net Sales Share, By Geography, 2018 (%)