 Email
Email Print
Print


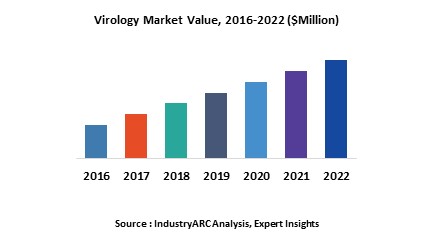
The global virology market is estimated at $1693 million in 2017 and is estimated to grow at a CAGR of 5.4% during the forecast period 2018-2023. North America is the leading market holder driven by world class healthcare substructure with technological advancement practice. Asia-Pacific is likely attaining highest growth due to growing healthcare tourism in the nations of China and India. Hospitals and the Laboratories are the most dominating end-use segments
What is virology?
Virology is the scientific discipline concerned with the study of the microbiological or pathological science which involves the study of viruses and viral diseases, including the distribution, biochemistry, disease producing properties, physiology, molecular biology, ecology, cultivation, evolution, genetics and clinical aspects of viruses. Virology explain about the interaction with host organism physiology and immunity, the diseases they cause, the techniques to isolate and culture them, ways to infect and exploit host cells for reproduction, and their use in research and therapy.
Market Research and Market Trends of virology market
- Notable advances in nanotechnology, nanostructure-based electrical sensors have been emerged as promising platforms for real-time, sensitive detection of numerous bioanalytes. Using Nanopore-Based Resistive-Pulse Sensing Techniques, scientists are determining both the dimensions and the number of viruses. So, this provides important complementary information and detect all viruses and virus related particles.
- Microbiology testing considered as one of the most rapidly growing segments in the diagnostics industry. The major driving forces for this include continuous spread of HIV, which is the world's major health threat and is a key factor contributing to the rise in opportunistic infections, bioterrorism, advances in molecular diagnostic technologies, and a wider availability of immune suppressive drug.
- Awareness programs about various viruses such as Ebola virus, Flu, Zika virus, STD’s, AIDS are the key factor increasing people awareness and eventually increasing the market growth by employing the virology applications.
Who are the Major Players in virology market?
The companies referred in the market research report includes GlaxoSmithKline plc, Abbott Laboratories, Boehringer Ingelheim Corporation, Merck and Co. Inc., Novartis International AG.
What is our report scope?
The report incorporates in-depth assessment of the competitive landscape, product market sizing, product benchmarking, market trends, product developments, financial analysis, strategic analysis and so on to gauge the impact forces and potential opportunities of the market. Apart from this the report also includes a study of major developments in the market such as product launches, agreements, acquisitions, collaborations, mergers and so on to comprehend the prevailing market dynamics at present and its impact during the forecast period 2018-2024.
All our reports are customizable to your company needs to a certain extent, we do provide 20 free consulting hours along with purchase of each report, and this will allow you to request any additional data to customize the report to your needs.
Key Takeaways from this Report
- Evaluate market potential through analyzing growth rates (CAGR %), Volume (Units) and Value ($M) data given at country level – for product types, end use applications and by different industry verticals.
- Understand the different dynamics influencing the market – key driving factors, challenges and hidden opportunities.
- Get in-depth insights on your competitor performance – market shares, strategies, financial benchmarking, product benchmarking, SWOT and more.
- Analyze the sales and distribution channels across key geographies to improve top-line revenues.
- Understand the industry supply chain with a deep-dive on the value augmentation at each step, in order to optimize value and bring efficiencies in your processes.
- Get a quick outlook on the market entropy – M&A’s, deals, partnerships, product launches of all key players for the past 4 years.
- Evaluate the supply-demand gaps, import-export statistics and regulatory landscape for more than top 20 countries globally for the market.
1. Virology Market - Overview
1.1. Definitions and Scope
2. Virology Market - Executive summary
2.1. Market Revenue, Market Size and Key Trends by Company
2.2. Key Trends by type of Application
2.3. Key Trends segmented by Geography
3. Virology Market
3.1. Comparative analysis
3.1.1. Product Benchmarking - Top 10 companies
3.1.2. Top 5 Financials Analysis
3.1.3. Market Value split by Top 10 companies
3.1.4. Patent Analysis - Top 10 companies
3.1.5. Pricing Analysis
4. Virology Market – Startup companies Scenario Premium
4.1. Top 10 startup company Analysis by
4.1.1. Investment
4.1.2. Revenue
4.1.3. Market Shares
4.1.4. Market Size and Application Analysis
4.1.5. Venture Capital and Funding Scenario
5. Virology Market – Industry Market Entry Scenario Premium
5.1. Regulatory Framework Overview
5.2. New Business and Ease of Doing business index
5.3. Case studies of successful ventures
5.4. Customer Analysis – Top 10 companies
6. Virology Market Forces
6.1. Drivers
6.2. Constraints
6.3. Challenges
6.4. Porters five force model
6.4.1. Bargaining power of suppliers
6.4.2. Bargaining powers of customers
6.4.3. Threat of new entrants
6.4.4. Rivalry among existing players
6.4.5. Threat of substitutes
7. Virology Market -Strategic analysis
7.1. Value chain analysis
7.2. Opportunities analysis
7.3. Product life cycle
7.4. Suppliers and distributors Market Share
8. Virology Market – By type (Market Size -$Million / $Billion)
8.1. Market Size and Market Share Analysis
8.2. Application Revenue and Trend Research
8.3. Product Segment Analysis
8.3.1. Introduction
8.3.2. Diagnosing Test
8.3.2.1. DNA viruses
8.3.2.2. RNA viruses
8.3.2.3. Prions diagnostic test
8.3.2.4. Others
8.3.3. Viral Infection Controlling Methods
8.3.3.1. Passive Prophylaxis
8.3.3.2. Immunoprophylaxis
8.3.3.3. Active Prophylaxis (Vaccines)
8.3.4. Antiviral Chemotherapy
8.3.4.1. Antiviral Agents
8.3.4.2. Immunomodulators
8.3.4.3. Virucidal Agents
8.3.5. Interferon
8.3.5.1. Cytokines
9. Virology Market – By application (Market Size -$Million / $Billion)
9.1. Skin and Soft Tissue Infections
9.2. Respiratory Tract Infections
9.3. GI Tract Infections
9.4. Urinary Tract Infections
9.5. Eye Infections
9.6. CNS Infections
9.7. CNS Infections
9.8. Perinatal Infections
10. Virology – By End-users(Market Size -$Million / $Billion)
10.1. Segment type Size and Market Share Analysis
10.2. Application Revenue and Trends by type of Application
10.3. Application Segment Analysis by Type
10.3.1. Hospitals
10.3.2. Clinics
10.3.3. Laboratories
10.3.4. Diagnostic Centers
10.3.5. Blood Banks
10.3.6. Pharmacies
11. Virology - By Geography (Market Size -$Million / $Billion)
11.1. Virology Market - North America Segment Research
11.2. North America Market Research (Million / $Billion)
11.2.1. Segment type Size and Market Size Analysis
11.2.2. Revenue and Trends
11.2.3. Application Revenue and Trends by type of Application
11.2.4. Company Revenue and Product Analysis
11.2.5. North America Product type and Application Market Size
11.2.5.1. U.S.
11.2.5.2. Canada
11.2.5.3. Mexico
11.2.5.4. Rest of North America
11.3. Virology - South America Segment Research
11.4. South America Market Research (Market Size -$Million / $Billion)
11.4.1. Segment type Size and Market Size Analysis
11.4.2. Revenue and Trends
11.4.3. Application Revenue and Trends by type of Application
11.4.4. Company Revenue and Product Analysis
11.4.5. South America Product type and Application Market Size
11.4.5.1. Brazil
11.4.5.2. Venezuela
11.4.5.3. Argentina
11.4.5.4. Ecuador
11.4.5.5. Peru
11.4.5.6. Colombia
11.4.5.7. Costa Rica
11.4.5.8. Rest of South America
11.5. Virology - Europe Segment Research
11.6. Europe Market Research (Market Size -$Million / $Billion)
11.6.1. Segment type Size and Market Size Analysis
11.6.2. Revenue and Trends
11.6.3. Application Revenue and Trends by type of Application
11.6.4. Company Revenue and Product Analysis
11.6.5. Europe Segment Product type and Application Market Size
11.6.5.1. U.K
11.6.5.2. Germany
11.6.5.3. Italy
11.6.5.4. France
11.6.5.5. Netherlands
11.6.5.6. Belgium
11.6.5.7. Spain
11.6.5.8. Denmark
11.6.5.9. Rest of Europe
11.7. Virology – APAC Segment Research
11.8. APAC Market Research (Market Size -$Million / $Billion)
11.8.1. Segment type Size and Market Size Analysis
11.8.2. Revenue and Trends
11.8.3. Application Revenue and Trends by type of Application
11.8.4. Company Revenue and Product Analysis
11.8.5. APAC Segment – Product type and Application Market Size
11.8.5.1. China
11.8.5.2. Australia
11.8.5.3. Japan
11.8.5.4. South Korea
11.8.5.5. India
11.8.5.6. Taiwan
11.8.5.7. Malaysia
12. Virology Market - Entropy
12.1. New product launches
12.2. M&A's, collaborations, JVs and partnerships
13. Virology Market – Industry / Segment Competition landscape Premium
13.1. Market Share Analysis
13.1.1. Market Share by Country- Top companies
13.1.2. Market Share by Region- Top 10 companies
13.1.3. Market Share by type of Application – Top 10 companies
13.1.4. Market Share by type of Product / Product category- Top 10 companies
13.1.5. Market Share at global level- Top 10 companies
13.1.6. Best Practises for companies
14. Virology Market – Key Company List by Country Premium
15. Virology Market Company Analysis
15.1. Market Share, Company Revenue, Products, M&A, Developments
15.2. GlaxoSmithKline plc
15.3. Abbott Laboratories
15.4. Boehringer Ingelheim Corporation
15.5. Merck and Co. Inc.
15.6. Novartis International AG
15.7. Company 6
15.8. Company 7
15.9. Company 8
15.10. Company 9
15.11. Company 10 and more
"*Financials would be provided on a best efforts basis for private companies"
16. Virology Market -Appendix
16.1. Abbreviations
16.2. Sources
17. Virology Market -Methodology Premium
17.1. Research Methodology
17.1.1. Company Expert Interviews
17.1.2. Industry Databases
17.1.3. Associations
17.1.4. Company News
17.1.5. Company Annual Reports
17.1.6. Application Trends
17.1.7. New Products and Product database
17.1.8. Company Transcripts
17.1.9. R&D Trends
17.1.10. Key Opinion Leaders Interviews
17.1.11. Supply and Demand Trends
List of Tables
Table 1 Virology Market Overview 2021-2026
Table 2 Virology Market Leader Analysis 2018-2019 (US$)
Table 3 Virology Market Product Analysis 2018-2019 (US$)
Table 4 Virology Market End User Analysis 2018-2019 (US$)
Table 5 Virology Market Patent Analysis 2013-2018* (US$)
Table 6 Virology Market Financial Analysis 2018-2019 (US$)
Table 7 Virology Market Driver Analysis 2018-2019 (US$)
Table 8 Virology Market Challenges Analysis 2018-2019 (US$)
Table 9 Virology Market Constraint Analysis 2018-2019 (US$)
Table 10 Virology Market Supplier Bargaining Power Analysis 2018-2019 (US$)
Table 11 Virology Market Buyer Bargaining Power Analysis 2018-2019 (US$)
Table 12 Virology Market Threat of Substitutes Analysis 2018-2019 (US$)
Table 13 Virology Market Threat of New Entrants Analysis 2018-2019 (US$)
Table 14 Virology Market Degree of Competition Analysis 2018-2019 (US$)
Table 15 Virology Market Value Chain Analysis 2018-2019 (US$)
Table 16 Virology Market Pricing Analysis 2021-2026 (US$)
Table 17 Virology Market Opportunities Analysis 2021-2026 (US$)
Table 18 Virology Market Product Life Cycle Analysis 2021-2026 (US$)
Table 19 Virology Market Supplier Analysis 2018-2019 (US$)
Table 20 Virology Market Distributor Analysis 2018-2019 (US$)
Table 21 Virology Market Trend Analysis 2018-2019 (US$)
Table 22 Virology Market Size 2018 (US$)
Table 23 Virology Market Forecast Analysis 2021-2026 (US$)
Table 24 Virology Market Sales Forecast Analysis 2021-2026 (Units)
Table 25 Virology Market, Revenue & Volume,By Type, 2021-2026 ($)
Table 26 Virology Market By Type, Revenue & Volume,By Diagnosing Test, 2021-2026 ($)
Table 27 Virology Market By Type, Revenue & Volume,By Viral Infection Controlling Methods, 2021-2026 ($)
Table 28 Virology Market By Type, Revenue & Volume,By Antiviral Chemotherapy, 2021-2026 ($)
Table 29 Virology Market By Type, Revenue & Volume,By Interferons, 2021-2026 ($)
Table 30 Virology Market, Revenue & Volume,By Application, 2021-2026 ($)
Table 31 Virology Market By Application, Revenue & Volume,By Skin and Soft Tissue Infections, 2021-2026 ($)
Table 32 Virology Market By Application, Revenue & Volume,By Respiratory Tract Infections, 2021-2026 ($)
Table 33 Virology Market By Application, Revenue & Volume,By GI Tract Infections, 2021-2026 ($)
Table 34 Virology Market By Application, Revenue & Volume,By Urinary Tract Infections, 2021-2026 ($)
Table 35 Virology Market By Application, Revenue & Volume,By Eye Infections, 2021-2026 ($)
Table 36 Virology Market, Revenue & Volume,By End Use, 2021-2026 ($)
Table 37 Virology Market By End Use, Revenue & Volume,By Hospitals, 2021-2026 ($)
Table 38 Virology Market By End Use, Revenue & Volume,By Clinics, 2021-2026 ($)
Table 39 Virology Market By End Use, Revenue & Volume,By Laboratories, 2021-2026 ($)
Table 40 Virology Market By End Use, Revenue & Volume,By Diagnostic Centres, 2021-2026 ($)
Table 41 Virology Market By End Use, Revenue & Volume,By Blood Banks, 2021-2026 ($)
Table 42 North America Virology Market, Revenue & Volume,By Type, 2021-2026 ($)
Table 43 North America Virology Market, Revenue & Volume,By Application, 2021-2026 ($)
Table 44 North America Virology Market, Revenue & Volume,By End Use, 2021-2026 ($)
Table 45 South america Virology Market, Revenue & Volume,By Type, 2021-2026 ($)
Table 46 South america Virology Market, Revenue & Volume,By Application, 2021-2026 ($)
Table 47 South america Virology Market, Revenue & Volume,By End Use, 2021-2026 ($)
Table 48 Europe Virology Market, Revenue & Volume,By Type, 2021-2026 ($)
Table 49 Europe Virology Market, Revenue & Volume,By Application, 2021-2026 ($)
Table 50 Europe Virology Market, Revenue & Volume,By End Use, 2021-2026 ($)
Table 51 APAC Virology Market, Revenue & Volume,By Type, 2021-2026 ($)
Table 52 APAC Virology Market, Revenue & Volume,By Application, 2021-2026 ($)
Table 53 APAC Virology Market, Revenue & Volume,By End Use, 2021-2026 ($)
Table 54 Middle East & Africa Virology Market, Revenue & Volume,By Type, 2021-2026 ($)
Table 55 Middle East & Africa Virology Market, Revenue & Volume,By Application, 2021-2026 ($)
Table 56 Middle East & Africa Virology Market, Revenue & Volume,By End Use, 2021-2026 ($)
Table 57 Russia Virology Market, Revenue & Volume,By Type, 2021-2026 ($)
Table 58 Russia Virology Market, Revenue & Volume,By Application, 2021-2026 ($)
Table 59 Russia Virology Market, Revenue & Volume,By End Use, 2021-2026 ($)
Table 60 Israel Virology Market, Revenue & Volume,By Type, 2021-2026 ($)
Table 61 Israel Virology Market, Revenue & Volume,By Application, 2021-2026 ($)
Table 62 Israel Virology Market, Revenue & Volume,By End Use, 2021-2026 ($)
Table 63 Top Companies 2018 (US$)Virology Market, Revenue & Volume,
Table 64 Product Launch 2018-2019Virology Market, Revenue & Volume,
Table 65 Mergers & Acquistions 2018-2019Virology Market, Revenue & Volume,
List of Figures
Figure 1 Overview of Virology Market 2021-2026
Figure 2 Market Share Analysis for Virology Market 2018 (US$)
Figure 3 Product Comparison in Virology Market 2018-2019 (US$)
Figure 4 End User Profile for Virology Market 2018-2019 (US$)
Figure 5 Patent Application and Grant in Virology Market 2013-2018* (US$)
Figure 6 Top 5 Companies Financial Analysis in Virology Market 2018-2019 (US$)
Figure 7 Market Entry Strategy in Virology Market 2018-2019
Figure 8 Ecosystem Analysis in Virology Market 2018
Figure 9 Average Selling Price in Virology Market 2021-2026
Figure 10 Top Opportunites in Virology Market 2018-2019
Figure 11 Market Life Cycle Analysis in Virology Market
Figure 12 GlobalBy TypeVirology Market Revenue, 2021-2026 ($)
Figure 13 GlobalBy ApplicationVirology Market Revenue, 2021-2026 ($)
Figure 14 GlobalBy End UseVirology Market Revenue, 2021-2026 ($)
Figure 15 Global Virology Market - By Geography
Figure 16 Global Virology Market Value & Volume, By Geography, 2021-2026 ($)
Figure 17 Global Virology Market CAGR, By Geography, 2021-2026 (%)
Figure 18 North America Virology Market Value & Volume, 2021-2026 ($)
Figure 19 US Virology Market Value & Volume, 2021-2026 ($)
Figure 20 US GDP and Population, 2018-2019 ($)
Figure 21 US GDP – Composition of 2018, By Sector of Origin
Figure 22 US Export and Import Value & Volume, 2018-2019 ($)
Figure 23 Canada Virology Market Value & Volume, 2021-2026 ($)
Figure 24 Canada GDP and Population, 2018-2019 ($)
Figure 25 Canada GDP – Composition of 2018, By Sector of Origin
Figure 26 Canada Export and Import Value & Volume, 2018-2019 ($)
Figure 27 Mexico Virology Market Value & Volume, 2021-2026 ($)
Figure 28 Mexico GDP and Population, 2018-2019 ($)
Figure 29 Mexico GDP – Composition of 2018, By Sector of Origin
Figure 30 Mexico Export and Import Value & Volume, 2018-2019 ($)
Figure 31 South America Virology Market Value & Volume, 2021-2026 ($)
Figure 32 Brazil Virology Market Value & Volume, 2021-2026 ($)
Figure 33 Brazil GDP and Population, 2018-2019 ($)
Figure 34 Brazil GDP – Composition of 2018, By Sector of Origin
Figure 35 Brazil Export and Import Value & Volume, 2018-2019 ($)
Figure 36 Venezuela Virology Market Value & Volume, 2021-2026 ($)
Figure 37 Venezuela GDP and Population, 2018-2019 ($)
Figure 38 Venezuela GDP – Composition of 2018, By Sector of Origin
Figure 39 Venezuela Export and Import Value & Volume, 2018-2019 ($)
Figure 40 Argentina Virology Market Value & Volume, 2021-2026 ($)
Figure 41 Argentina GDP and Population, 2018-2019 ($)
Figure 42 Argentina GDP – Composition of 2018, By Sector of Origin
Figure 43 Argentina Export and Import Value & Volume, 2018-2019 ($)
Figure 44 Ecuador Virology Market Value & Volume, 2021-2026 ($)
Figure 45 Ecuador GDP and Population, 2018-2019 ($)
Figure 46 Ecuador GDP – Composition of 2018, By Sector of Origin
Figure 47 Ecuador Export and Import Value & Volume, 2018-2019 ($)
Figure 48 Peru Virology Market Value & Volume, 2021-2026 ($)
Figure 49 Peru GDP and Population, 2018-2019 ($)
Figure 50 Peru GDP – Composition of 2018, By Sector of Origin
Figure 51 Peru Export and Import Value & Volume, 2018-2019 ($)
Figure 52 Colombia Virology Market Value & Volume, 2021-2026 ($)
Figure 53 Colombia GDP and Population, 2018-2019 ($)
Figure 54 Colombia GDP – Composition of 2018, By Sector of Origin
Figure 55 Colombia Export and Import Value & Volume, 2018-2019 ($)
Figure 56 Costa Rica Virology Market Value & Volume, 2021-2026 ($)
Figure 57 Costa Rica GDP and Population, 2018-2019 ($)
Figure 58 Costa Rica GDP – Composition of 2018, By Sector of Origin
Figure 59 Costa Rica Export and Import Value & Volume, 2018-2019 ($)
Figure 60 Europe Virology Market Value & Volume, 2021-2026 ($)
Figure 61 U.K Virology Market Value & Volume, 2021-2026 ($)
Figure 62 U.K GDP and Population, 2018-2019 ($)
Figure 63 U.K GDP – Composition of 2018, By Sector of Origin
Figure 64 U.K Export and Import Value & Volume, 2018-2019 ($)
Figure 65 Germany Virology Market Value & Volume, 2021-2026 ($)
Figure 66 Germany GDP and Population, 2018-2019 ($)
Figure 67 Germany GDP – Composition of 2018, By Sector of Origin
Figure 68 Germany Export and Import Value & Volume, 2018-2019 ($)
Figure 69 Italy Virology Market Value & Volume, 2021-2026 ($)
Figure 70 Italy GDP and Population, 2018-2019 ($)
Figure 71 Italy GDP – Composition of 2018, By Sector of Origin
Figure 72 Italy Export and Import Value & Volume, 2018-2019 ($)
Figure 73 France Virology Market Value & Volume, 2021-2026 ($)
Figure 74 France GDP and Population, 2018-2019 ($)
Figure 75 France GDP – Composition of 2018, By Sector of Origin
Figure 76 France Export and Import Value & Volume, 2018-2019 ($)
Figure 77 Netherlands Virology Market Value & Volume, 2021-2026 ($)
Figure 78 Netherlands GDP and Population, 2018-2019 ($)
Figure 79 Netherlands GDP – Composition of 2018, By Sector of Origin
Figure 80 Netherlands Export and Import Value & Volume, 2018-2019 ($)
Figure 81 Belgium Virology Market Value & Volume, 2021-2026 ($)
Figure 82 Belgium GDP and Population, 2018-2019 ($)
Figure 83 Belgium GDP – Composition of 2018, By Sector of Origin
Figure 84 Belgium Export and Import Value & Volume, 2018-2019 ($)
Figure 85 Spain Virology Market Value & Volume, 2021-2026 ($)
Figure 86 Spain GDP and Population, 2018-2019 ($)
Figure 87 Spain GDP – Composition of 2018, By Sector of Origin
Figure 88 Spain Export and Import Value & Volume, 2018-2019 ($)
Figure 89 Denmark Virology Market Value & Volume, 2021-2026 ($)
Figure 90 Denmark GDP and Population, 2018-2019 ($)
Figure 91 Denmark GDP – Composition of 2018, By Sector of Origin
Figure 92 Denmark Export and Import Value & Volume, 2018-2019 ($)
Figure 93 APAC Virology Market Value & Volume, 2021-2026 ($)
Figure 94 China Virology Market Value & Volume, 2021-2026
Figure 95 China GDP and Population, 2018-2019 ($)
Figure 96 China GDP – Composition of 2018, By Sector of Origin
Figure 97 China Export and Import Value & Volume, 2018-2019 ($)Virology Market China Export and Import Value & Volume, 2018-2019 ($)
Figure 98 Australia Virology Market Value & Volume, 2021-2026 ($)
Figure 99 Australia GDP and Population, 2018-2019 ($)
Figure 100 Australia GDP – Composition of 2018, By Sector of Origin
Figure 101 Australia Export and Import Value & Volume, 2018-2019 ($)
Figure 102 South Korea Virology Market Value & Volume, 2021-2026 ($)
Figure 103 South Korea GDP and Population, 2018-2019 ($)
Figure 104 South Korea GDP – Composition of 2018, By Sector of Origin
Figure 105 South Korea Export and Import Value & Volume, 2018-2019 ($)
Figure 106 India Virology Market Value & Volume, 2021-2026 ($)
Figure 107 India GDP and Population, 2018-2019 ($)
Figure 108 India GDP – Composition of 2018, By Sector of Origin
Figure 109 India Export and Import Value & Volume, 2018-2019 ($)
Figure 110 Taiwan Virology Market Value & Volume, 2021-2026 ($)
Figure 111 Taiwan GDP and Population, 2018-2019 ($)
Figure 112 Taiwan GDP – Composition of 2018, By Sector of Origin
Figure 113 Taiwan Export and Import Value & Volume, 2018-2019 ($)
Figure 114 Malaysia Virology Market Value & Volume, 2021-2026 ($)
Figure 115 Malaysia GDP and Population, 2018-2019 ($)
Figure 116 Malaysia GDP – Composition of 2018, By Sector of Origin
Figure 117 Malaysia Export and Import Value & Volume, 2018-2019 ($)
Figure 118 Hong Kong Virology Market Value & Volume, 2021-2026 ($)
Figure 119 Hong Kong GDP and Population, 2018-2019 ($)
Figure 120 Hong Kong GDP – Composition of 2018, By Sector of Origin
Figure 121 Hong Kong Export and Import Value & Volume, 2018-2019 ($)
Figure 122 Middle East & Africa Virology Market Middle East & Africa 3D Printing Market Value & Volume, 2021-2026 ($)
Figure 123 Russia Virology Market Value & Volume, 2021-2026 ($)
Figure 124 Russia GDP and Population, 2018-2019 ($)
Figure 125 Russia GDP – Composition of 2018, By Sector of Origin
Figure 126 Russia Export and Import Value & Volume, 2018-2019 ($)
Figure 127 Israel Virology Market Value & Volume, 2021-2026 ($)
Figure 128 Israel GDP and Population, 2018-2019 ($)
Figure 129 Israel GDP – Composition of 2018, By Sector of Origin
Figure 130 Israel Export and Import Value & Volume, 2018-2019 ($)
Figure 131 Entropy Share, By Strategies, 2018-2019* (%)Virology Market
Figure 132 Developments, 2018-2019*Virology Market
Figure 133 Company 1 Virology Market Net Revenue, By Years, 2018-2019* ($)
Figure 134 Company 1 Virology Market Net Revenue Share, By Business segments, 2018 (%)
Figure 135 Company 1 Virology Market Net Sales Share, By Geography, 2018 (%)
Figure 136 Company 2 Virology Market Net Revenue, By Years, 2018-2019* ($)
Figure 137 Company 2 Virology Market Net Revenue Share, By Business segments, 2018 (%)
Figure 138 Company 2 Virology Market Net Sales Share, By Geography, 2018 (%)
Figure 139 Company 3Virology Market Net Revenue, By Years, 2018-2019* ($)
Figure 140 Company 3Virology Market Net Revenue Share, By Business segments, 2018 (%)
Figure 141 Company 3Virology Market Net Sales Share, By Geography, 2018 (%)
Figure 142 Company 4 Virology Market Net Revenue, By Years, 2018-2019* ($)
Figure 143 Company 4 Virology Market Net Revenue Share, By Business segments, 2018 (%)
Figure 144 Company 4 Virology Market Net Sales Share, By Geography, 2018 (%)
Figure 145 Company 5 Virology Market Net Revenue, By Years, 2018-2019* ($)
Figure 146 Company 5 Virology Market Net Revenue Share, By Business segments, 2018 (%)
Figure 147 Company 5 Virology Market Net Sales Share, By Geography, 2018 (%)
Figure 148 Company 6 Virology Market Net Revenue, By Years, 2018-2019* ($)
Figure 149 Company 6 Virology Market Net Revenue Share, By Business segments, 2018 (%)
Figure 150 Company 6 Virology Market Net Sales Share, By Geography, 2018 (%)
Figure 151 Company 7 Virology Market Net Revenue, By Years, 2018-2019* ($)
Figure 152 Company 7 Virology Market Net Revenue Share, By Business segments, 2018 (%)
Figure 153 Company 7 Virology Market Net Sales Share, By Geography, 2018 (%)
Figure 154 Company 8 Virology Market Net Revenue, By Years, 2018-2019* ($)
Figure 155 Company 8 Virology Market Net Revenue Share, By Business segments, 2018 (%)
Figure 156 Company 8 Virology Market Net Sales Share, By Geography, 2018 (%)
Figure 157 Company 9 Virology Market Net Revenue, By Years, 2018-2019* ($)
Figure 158 Company 9 Virology Market Net Revenue Share, By Business segments, 2018 (%)
Figure 159 Company 9 Virology Market Net Sales Share, By Geography, 2018 (%)
Figure 160 Company 10 Virology Market Net Revenue, By Years, 2018-2019* ($)
Figure 161 Company 10 Virology Market Net Revenue Share, By Business segments, 2018 (%)
Figure 162 Company 10 Virology Market Net Sales Share, By Geography, 2018 (%)
Figure 163 Company 11 Virology Market Net Revenue, By Years, 2018-2019* ($)
Figure 164 Company 11 Virology Market Net Revenue Share, By Business segments, 2018 (%)
Figure 165 Company 11 Virology Market Net Sales Share, By Geography, 2018 (%)
Figure 166 Company 12 Virology Market Net Revenue, By Years, 2018-2019* ($)
Figure 167 Company 12 Virology Market Net Revenue Share, By Business segments, 2018 (%)
Figure 168 Company 12 Virology Market Net Sales Share, By Geography, 2018 (%)
Figure 169 Company 13Virology Market Net Revenue, By Years, 2018-2019* ($)
Figure 170 Company 13Virology Market Net Revenue Share, By Business segments, 2018 (%)
Figure 171 Company 13Virology Market Net Sales Share, By Geography, 2018 (%)
Figure 172 Company 14 Virology Market Net Revenue, By Years, 2018-2019* ($)
Figure 173 Company 14 Virology Market Net Revenue Share, By Business segments, 2018 (%)
Figure 174 Company 14 Virology Market Net Sales Share, By Geography, 2018 (%)
Figure 175 Company 15 Virology Market Net Revenue, By Years, 2018-2019* ($)
Figure 176 Company 15 Virology Market Net Revenue Share, By Business segments, 2018 (%)
Figure 177 Company 15 Virology Market Net Sales Share, By Geography, 2018 (%)