Isobutyl Stearate Market - Forecast(2024 - 2030)

Report Code: CMR 0614 Report Format: PDF + Excel

Isobutyl Stearate Market Overview

The Isobutyl Stearate Market size is estimated to reach US$191.6 billion by 2027, after growing at a CAGR of 4.8% during the forecast period 2022-2027. Isobutyl stearates are stearate esters that are waxy solids or oily liquids and are known by various chemical names such as isobutyl ester, octadecanoic acid, 2-methyl propyl ester and Kessco IBS. The growing textile & apparel sector is driving the isobutyl stearate market growth, to be utilized as inks and dyes for printing and staining the yarns. For instance, the Indian technical textile market is expected to expand by US$23.3 billion by 2027, according to the report 'Technical Textiles: Emerging Opportunities and Investments' released by the Federation of Indian Chambers of Commerce and Industry (F.I.C.C.). Moreover, the increasing requirement for isobutyl stearate in polishes, face creams and other applications in the personal care & cosmetics industry is anticipated to upsurge the growth of the isobutyl stearate industry during the forecast period. The global economic downturn caused by the COVID-19 pandemic resulted in a huge drop in textile, cosmetics & personal care and other end-use industries all across the world, which had a significant impact on the growth of the isobutyl stearate market size.

Report Coverage

The “Isobutyl Stearate Market Report – Forecast (2022 - 2027)” by IndustryARC, covers an in-depth analysis of the following segments in the isobutyl stearate industry.

By Application: Lubricants, Ink, Soaps, Coatings, Polishes, Ointments and Others.
By End-use Industry: Metalworking, Personal Care & Cosmetics, Plastic Processing, Pharmaceutical & Healthcare, Textile & Apparel and Others
By Geography: North America (the USA, Canada and Mexico), Europe (UK, Germany, France, Italy, Netherlands, Spain, Belgium and the Rest of Europe), Asia-Pacific (China, Japan, India, South Korea, Australia and New Zealand, Indonesia, Taiwan, Malaysia and Rest of APAC), South America (Brazil, Argentina, Colombia, Chile and Rest of South America), Rest of the World (the Middle East and Africa)

Key Takeaways

  • The Asia-Pacific region dominates the Isobutyl Stearate market owing to the increasing investments in the textile & apparel industry. For instance, according to the Government of Canada, in 2021, the Minister of Innovation, Science and Industry announced an investment of US$28.99 million in Meltech Innovation Canada Inc., this investment will support a US$38.754 million project, which includes the manufacturing of the specialized textiles.
  • Rapidly rising demand for Isobutyl Stearate in the personal care & cosmetics industry for the formulation of makeup has driven the growth of the isobutyl stearate market.
  • The increasing demand for Isobutyl Stearate in the pharmaceutical & healthcare sector, due to its usage in the topical pharmaceutical such as creams and ointments, has been a critical factor driving the growth of the isobutyl stearate market in the upcoming years.
  • However, the availability of alternates to isobutyl stearates such as lauric acid, palmitic acid, stearic acid and others can hinder the growth of the isobutyl stearate market.

Figure: Isobutyl Stearate Market Revenue Share by Geography, 2021 (%)
Isobutyl Stearate Market
For More Details on This Report - Request for Sample

Isobutyl Stearate Market Segment Analysis – by Application

The lubricants segment held the largest Isobutyl Stearate Market share in 2021 and is estimated to grow at a CAGR of 4.9% during the forecast period 2022-2027, due to the increasing utilization of isobutyl stearate as a lubricant in cosmetics and personal care items. Isobutyl stearate esters are widely used as lubricants on the skin surface due to their waxy and oily characteristics. It provides a soft and smooth appearance to the skin. Isobutyl stearate forms a thin coating on application to the skin in the form of skin cosmetics. Therefore, acting as a skin-lubricating agent. Thus, all these exhibit characteristics of lubricants make it a preferred choice over the other applications of isobutyl stearate that are driving its segmental growth.

Isobutyl Stearate Market Segment Analysis – by End-use Industry

Personal care & cosmetics held the largest Isobutyl Stearate Market share in 2021 and is estimated to grow at a CAGR of 5.2% during the forecast period 2022-2027. In the personal care & cosmetics industry, isobutyl stearate is utilized in face creams, polishes, rouges, ointments and other items. They are applied in skincare as skin conditioning agents and are most frequently used in the formulation of eye and skin makeup, lipstick and in other cosmetic products. Additionally, in personal care products, isobutyl stearate is also used in personal care items such as soap, shampoo, lotions and other items. The personal care & cosmetics industry is growing, for instance, the total local production, in Mexico, of personal care and cosmetic products, is estimated to rise to US$7.15 billion in 2021, from US$7.14 billion in 2020. Thus, with the growth of the personal care and cosmetics industry, the market for isobutyl stearate will further rise over the forecast period.

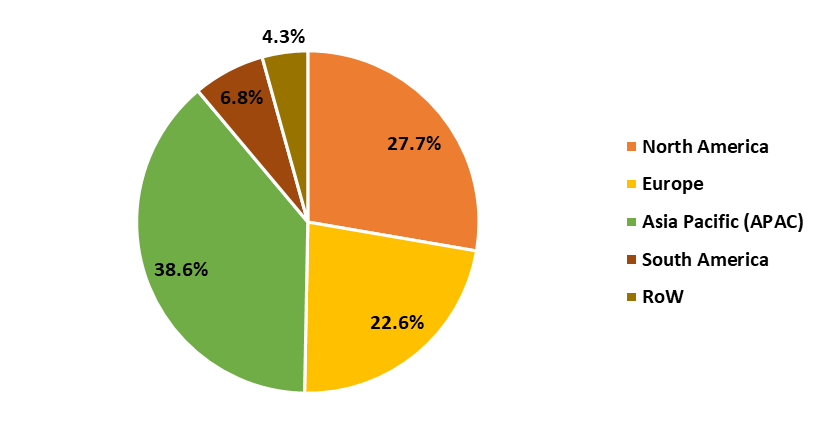
Isobutyl Stearate Market Segment Analysis – by Geography

Asia-Pacific region held the largest Isobutyl Stearate market share in 2021 up to 38.6%, due to the increasing requirement for isobutyl stearate in developing countries such as China, Japan, India, Indonesia and South Korea. Indonesia is expected to continue its dominance in isobutyl stearates such as in face creams, polishes, inks, rouges, ointments and other items, during the forecast period. This is due to the growth of the personal care & cosmetics industry in the country. For instance, according to the International Trade Administration, in Indonesia, in 2021, the revenues in the personal care & cosmetics industry are projected to reach US$7.5 billion and is estimated to rise by a 6.5 percent compound annual growth rate through 2025. Moreover, in 2022, the personal care & cosmetics sector in India is valued at US$26.8 billion and is poised to reach US$37.2 billion by 2025. Such an increasing personal care & cosmetics sector in the APAC countries is anticipated to raise the demand for isobutyl stearate in the forecasted period and is proving to be a market booster for the isobutyl stearate market size in this region. 

Isobutyl Stearate Market Drivers

Increasing Pharmaceutical & Healthcare Sector:

The pharmaceutical & healthcare sector utilizes Isobutyl Stearate in topical pharmaceuticals for application to body surfaces such as the mucous membranes to treat ailments in the form of creams, gels, foams, lotions and ointments. The pharmaceutical & healthcare sector is growing, for instance, in China, by 2030, the size of the pharmaceuticals & healthcare industry is expected to reach 16 trillion RMB (US$ 2.3 Million), according to the staff research report on the "US-China Economic and Security Review Commission." Additionally, according to the European Federation of Pharmaceutical Industries and Associations (EFPIA), the total local production of pharmaceuticals reached US$340,898.7 Million in 2020 from US$322,407.6 Million in 2019. Thus, the growing pharmaceutical & healthcare sector will increase the demand for isobutyl stearate as a topical pharmaceutical and is anticipated to drive the growth of the market over the forecast period.

Surging Textile and Apparel Industry:

The textile & apparel industry uses Isobutyl Stearate as inks or dyes for staining and printing the yarns of cellulosic fibers such as wool, cotton, viscose rayon and leather, by using a reducing agent to make the dye soluble. Growth in the distribution and production of textiles is increasing the need for isobutyl stearate. The demand for textiles is in direct proportion to the rise in the standard of living in emerging countries. The textile and apparel industry is growing, for instance, according to the Indian Brand Equity Foundation, from April 2000 to March 2021, the textiles industry captivated Foreign Direct Investment (FDI), amounting to US$3.75 billion. Additionally, in 2021, in Africa, Ghanaian businesswoman and entrepreneur Roberta Annan launched a €100 million (US$110.15 million) fund to channel investment into small and medium African textile & apparel enterprises. Thus, the rising demand for inks in the textile & apparel sector is estimated to drive isobutyl stearate industry growth.

Isobutyl Stearate Market Challenge

Availability of Substitute to Isobutyl Stearate:

There are a number of alternative solutions to Isobutyl Stearate such as lauric acid, palmitic acid, stearic acid, oleic acid, myristic acid, coconut fatty acid and others can replace isobutyl stearate. Since these alternates possess large availability in the market due to the lower prices as compared to isobutyl stearate. For instance, according to TCI Chemical PVT. LTD., 25gm isobutyl stearate costs US$26.79 and stearic acid costs US$24.11. Also, these alternates find more usage in pharmaceutical & healthcare, textile & apparel and chemical industries, as compared to isobutyl stearate. Thus, the availability of alternates to isobutyl stearate will create hurdles for market growth.

Isobutyl Stearate Industry Outlook

Technology launches, acquisitions and R&D activities are key strategies players adopt in the isobutyl stearate markets. The top 10 companies in the isobutyl Stearate market are:

  1. Emery Oleochemicals
  2. Oleon NV.
  3. Allan Chemical Corporation
  4. A&A Fratelli Parodi Spa
  5. Industrial Quimica Lasem
  6. Huntsman Corporation
  7. Hangzhou Dayangchem Co. Ltd.
  8. Mosselman s.a.
  9. Dow
  10. 3M Co.

Relevant Reports

Isobutyl Benzene Market – Industry Analysis, Market Size, Share, Trends, Application Analysis, Growth and Forecast Analysis

Report Code: CMR 1110

Methyl Isobutyl Carbinol Market - Industry Analysis, Market Size, Share, Trends, Application Analysis, Growth and Forecast Analysis

Report Code: CMR 34241

Isobutanol Market – Industry Analysis, Market Size, Share, Trends, Application Analysis, Growth and Forecast Analysis 

Report Code: CMR 0524

For more Chemicals and Materials Market reports, please click here

1. Isobutyl Stearate Market - Market Overview
    1.1 Definitions and Scope
2. Isobutyl Stearate Market - Executive Summary
    2.1 Key Trends by Application
    2.2 Key Trends by End-use Industry
    2.3 Key Trends by Geography
3. Isobutyl Stearate Market – Comparative analysis
    3.1 Market Share Analysis - Major Companies
    3.2 Product Benchmarking - Major Companies
    3.3 Top 5 Financials Analysis
    3.4 Patent Analysis- Major Companies
    3.5 Pricing Analysis (ASPs will be provided)
4. Isobutyl Stearate Market - Startup Companies Scenario Premium
    4.1 Major startup company analysis:
        4.1.1 Investment
        4.1.2 Revenue
        4.1.3 Product portfolio
        4.1.4 Venture Capital and Funding Scenario
5. Isobutyl Stearate Market – Industry Market Entry Scenario Premium Premium
    5.1 Regulatory Framework Overview
    5.2 New Business and Ease of Doing Business Index
    5.3 Successful Venture Profiles
    5.4 Customer Analysis – Major companies
6. Isobutyl Stearate Market - Market Forces
    6.1 Market Drivers
    6.2 Market Constraints
    6.3 Porters Five Force Model
        6.3.1 Bargaining Power of Suppliers
        6.3.2 Bargaining Powers of Buyers
        6.3.3 Threat of New Entrants
        6.3.4 Competitive Rivalry
        6.3.5 Threat of Substitutes
7. Isobutyl Stearate Market – Strategic Analysis
    7.1 Value/Supply Chain Analysis
    7.2 Opportunity Analysis
    7.3 Product/Market Life Cycle
    7.4 Distributor Analysis – Major Companies
8. Isobutyl Stearate Market – by Application (Market Size - US$ Million/Billion)
    8.1 Lubricants
    8.2 Ink
    8.3 Soaps
    8.4 Coatings
    8.5 Polishes
    8.6 Ointments
    8.7 Others
9. Isobutyl Stearate Market – by End-use Industry (Market Size - US$ Million/Billion)
    9.1 Metalworking
    9.2 Personal Care & Cosmetics
    9.3 Plastic Processing
    9.4 Pharmaceutical & Healthcare
    9.5 Textile & Apparel
    9.6 Others
10. Isobutyl Stearate Market - by Geography (Market Size - US$ Million/Billion)
    10.1 North America
        10.1.1 the USA
        10.1.2 Canada
        10.1.3 Mexico
    10.2 Europe
        10.2.1 the UK
        10.2.2 Germany
        10.2.3 France
        10.2.4 Italy
        10.2.5 the Netherlands
        10.2.6 Spain
        10.2.7 Belgium
        10.2.8 Rest of Europe
    10.3 Asia-Pacific
        10.3.1 China
        10.3.2 Japan
        10.3.3 India
        10.3.4 South Korea
        10.3.5 Australia and New Zeeland
        10.3.6 Indonesia
        10.3.7 Taiwan
        10.3.8 Malaysia
        10.3.9 Rest of APAC
    10.4 South America
        10.4.1 Brazil
        10.4.2 Argentina
        10.4.3 Colombia
        10.4.4 Chile
        10.4.5 Rest of South America
    10.5 Rest of the World
        10.5.1 the Middle East
            10.5.1.1 Saudi Arabia
            10.5.1.2 UAE
            10.5.1.3 Israel
            10.5.1.4 Rest of the Middle East
        10.5.2 Africa
            10.5.2.1 South Africa
            10.5.2.2 Nigeria
            10.5.2.3 Rest of Africa
11. Isobutyl Stearate Market – Entropy
    11.1 New Product Launches
    11.2 M&As, Collaborations, JVs and Partnerships
12. Isobutyl Stearate Market – Industry/Segment Competition Landscape Premium
    12.1 Company Benchmarking Matrix – Major Companies
    12.2 Market Share at Global Level - Major companies
    12.3 Market Share at Country Level - Major companies
    12.4 Market Share by Key Geography - Major companies
    12.5 Market Share by Key Application - Major companies
    12.6 Market Share by Key Product - Major companies
13. Isobutyl Stearate Market – Key Company List by Country Premium Premium
14. Isobutyl Stearate Market Company Analysis - Business Overview, Product Portfolio, Financials and Developments
    14.1 Company 1
    14.2 Company 2
    14.3 Company 3
    14.4 Company 4
    14.5 Company 5
    14.6 Company 6
    14.7 Company 7
    14.8 Company 8
    14.9 Company 9
    14.10 Company 10 and more
* "Financials would be provided to private companies on best-efforts basis."
Connect with our experts to get customized reports that best suit your requirements. Our reports include global-level data, niche markets and competitive landscape.
List of Tables:

Table 1: Isobutyl Stearate Market Overview 2021-2026
Table 2: Isobutyl Stearate Market Leader Analysis 2018-2019 (US$)
Table 3: Isobutyl Stearate Market Product Analysis 2018-2019 (US$)
Table 4: Isobutyl Stearate Market End User Analysis 2018-2019 (US$)
Table 5: Isobutyl Stearate Market Patent Analysis 2013-2018* (US$)
Table 6: Isobutyl Stearate Market Financial Analysis 2018-2019 (US$)
Table 7: Isobutyl Stearate Market Driver Analysis 2018-2019 (US$)
Table 8: Isobutyl Stearate Market Challenges Analysis 2018-2019 (US$)
Table 9: Isobutyl Stearate Market Constraint Analysis 2018-2019 (US$)
Table 10: Isobutyl Stearate Market Supplier Bargaining Power Analysis 2018-2019 (US$)
Table 11: Isobutyl Stearate Market Buyer Bargaining Power Analysis 2018-2019 (US$)
Table 12: Isobutyl Stearate Market Threat of Substitutes Analysis 2018-2019 (US$)
Table 13: Isobutyl Stearate Market Threat of New Entrants Analysis 2018-2019 (US$)
Table 14: Isobutyl Stearate Market Degree of Competition Analysis 2018-2019 (US$)
Table 15: Isobutyl Stearate Market Value Chain Analysis 2018-2019 (US$)
Table 16: Isobutyl Stearate Market Pricing Analysis 2021-2026 (US$)
Table 17: Isobutyl Stearate Market Opportunities Analysis 2021-2026 (US$)
Table 18: Isobutyl Stearate Market Product Life Cycle Analysis 2021-2026 (US$)
Table 19: Isobutyl Stearate Market Supplier Analysis 2018-2019 (US$)
Table 20: Isobutyl Stearate Market Distributor Analysis 2018-2019 (US$)
Table 21: Isobutyl Stearate Market Trend Analysis 2018-2019 (US$)
Table 22: Isobutyl Stearate Market Size 2018 (US$)
Table 23: Isobutyl Stearate Market Forecast Analysis 2021-2026 (US$)
Table 24: Isobutyl Stearate Market Sales Forecast Analysis 2021-2026 (Units)
Table 25: Isobutyl Stearate Market, Revenue & Volume,By Applications, 2021-2026 ($)
Table 26: Isobutyl Stearate Market By Applications, Revenue & Volume,By Metal Working, 2021-2026 ($)
Table 27: Isobutyl Stearate Market By Applications, Revenue & Volume,By Personal Care, 2021-2026 ($)
Table 28: Isobutyl Stearate Market By Applications, Revenue & Volume,By Industrial, 2021-2026 ($)
Table 29: North America Isobutyl Stearate Market, Revenue & Volume,By Applications, 2021-2026 ($)
Table 30: South america Isobutyl Stearate Market, Revenue & Volume,By Applications, 2021-2026 ($)
Table 31: Europe Isobutyl Stearate Market, Revenue & Volume,By Applications, 2021-2026 ($)
Table 32: APAC Isobutyl Stearate Market, Revenue & Volume,By Applications, 2021-2026 ($)
Table 33: Middle East & Africa Isobutyl Stearate Market, Revenue & Volume,By Applications, 2021-2026 ($)
Table 34: Russia Isobutyl Stearate Market, Revenue & Volume,By Applications, 2021-2026 ($)
Table 35: Israel Isobutyl Stearate Market, Revenue & Volume,By Applications, 2021-2026 ($)
Table 36: Top Companies 2018 (US$)Isobutyl Stearate Market, Revenue & Volume
Table 37: Product Launch 2018-2019Isobutyl Stearate Market, Revenue & Volume
Table 38: Mergers & Acquistions 2018-2019Isobutyl Stearate Market, Revenue & Volume

List of Figures:

Figure 1: Overview of Isobutyl Stearate Market 2021-2026
Figure 2: Market Share Analysis for Isobutyl Stearate Market 2018 (US$)
Figure 3: Product Comparison in Isobutyl Stearate Market 2018-2019 (US$)
Figure 4: End User Profile for Isobutyl Stearate Market 2018-2019 (US$)
Figure 5: Patent Application and Grant in Isobutyl Stearate Market 2013-2018* (US$)
Figure 6: Top 5 Companies Financial Analysis in Isobutyl Stearate Market 2018-2019 (US$)
Figure 7: Market Entry Strategy in Isobutyl Stearate Market 2018-2019
Figure 8: Ecosystem Analysis in Isobutyl Stearate Market 2018
Figure 9: Average Selling Price in Isobutyl Stearate Market 2021-2026
Figure 10: Top Opportunites in Isobutyl Stearate Market 2018-2019
Figure 11: Market Life Cycle Analysis in Isobutyl Stearate Market
Figure 12: GlobalBy ApplicationsIsobutyl Stearate Market Revenue, 2021-2026 ($)
Figure 13: Global Isobutyl Stearate Market - By Geography
Figure 14: Global Isobutyl Stearate Market Value & Volume, By Geography, 2021-2026 ($) 
Figure 15: Global Isobutyl Stearate Market CAGR, By Geography, 2021-2026 (%)
Figure 16: North America Isobutyl Stearate Market Value & Volume, 2021-2026 ($)
Figure 17: US Isobutyl Stearate Market Value & Volume, 2021-2026 ($)
Figure 18: US GDP and Population, 2018-2019 ($)
Figure 19: US GDP – Composition of 2018, By Sector of Origin
Figure 20: US Export and Import Value & Volume, 2018-2019 ($)
Figure 21: Canada Isobutyl Stearate Market Value & Volume, 2021-2026 ($)
Figure 22: Canada GDP and Population, 2018-2019 ($)
Figure 23: Canada GDP – Composition of 2018, By Sector of Origin
Figure 24: Canada Export and Import Value & Volume, 2018-2019 ($)
Figure 25: Mexico Isobutyl Stearate Market Value & Volume, 2021-2026 ($)
Figure 26: Mexico GDP and Population, 2018-2019 ($)
Figure 27: Mexico GDP – Composition of 2018, By Sector of Origin
Figure 28: Mexico Export and Import Value & Volume, 2018-2019 ($)
Figure 29: South America Isobutyl Stearate Market Value & Volume, 2021-2026 ($)
Figure 30: Brazil Isobutyl Stearate Market Value & Volume, 2021-2026 ($)
Figure 31: Brazil GDP and Population, 2018-2019 ($)
Figure 32: Brazil GDP – Composition of 2018, By Sector of Origin
Figure 33: Brazil Export and Import Value & Volume, 2018-2019 ($)
Figure 34: Venezuela Isobutyl Stearate Market Value & Volume, 2021-2026 ($)
Figure 35: Venezuela GDP and Population, 2018-2019 ($)
Figure 36: Venezuela GDP – Composition of 2018, By Sector of Origin
Figure 37: Venezuela Export and Import Value & Volume, 2018-2019 ($)
Figure 38: Argentina Isobutyl Stearate Market Value & Volume, 2021-2026 ($)
Figure 39: Argentina GDP and Population, 2018-2019 ($)
Figure 40: Argentina GDP – Composition of 2018, By Sector of Origin
Figure 41: Argentina Export and Import Value & Volume, 2018-2019 ($)
Figure 42: Ecuador Isobutyl Stearate Market Value & Volume, 2021-2026 ($)
Figure 43: Ecuador GDP and Population, 2018-2019 ($)
Figure 44: Ecuador GDP – Composition of 2018, By Sector of Origin
Figure 45: Ecuador Export and Import Value & Volume, 2018-2019 ($)
Figure 46: Peru Isobutyl Stearate Market Value & Volume, 2021-2026 ($)
Figure 47: Peru GDP and Population, 2018-2019 ($)
Figure 48: Peru GDP – Composition of 2018, By Sector of Origin
Figure 49: Peru Export and Import Value & Volume, 2018-2019 ($)
Figure 50: Colombia Isobutyl Stearate Market Value & Volume, 2021-2026 ($)
Figure 51: Colombia GDP and Population, 2018-2019 ($)
Figure 52: Colombia GDP – Composition of 2018, By Sector of Origin
Figure 53: Colombia Export and Import Value & Volume, 2018-2019 ($)
Figure 54: Costa Rica Isobutyl Stearate Market Value & Volume, 2021-2026 ($)
Figure 55: Costa Rica GDP and Population, 2018-2019 ($)
Figure 56: Costa Rica GDP – Composition of 2018, By Sector of Origin
Figure 57: Costa Rica Export and Import Value & Volume, 2018-2019 ($)
Figure 58: Europe Isobutyl Stearate Market Value & Volume, 2021-2026 ($)
Figure 59: U.K Isobutyl Stearate Market Value & Volume, 2021-2026 ($)
Figure 60: U.K GDP and Population, 2018-2019 ($)
Figure 61: U.K GDP – Composition of 2018, By Sector of Origin
Figure 62: U.K Export and Import Value & Volume, 2018-2019 ($)
Figure 63: Germany Isobutyl Stearate Market Value & Volume, 2021-2026 ($)
Figure 64: Germany GDP and Population, 2018-2019 ($)
Figure 65: Germany GDP – Composition of 2018, By Sector of Origin
Figure 66: Germany Export and Import Value & Volume, 2018-2019 ($)
Figure 67: Italy Isobutyl Stearate Market Value & Volume, 2021-2026 ($)
Figure 68: Italy GDP and Population, 2018-2019 ($)
Figure 69: Italy GDP – Composition of 2018, By Sector of Origin
Figure 70: Italy Export and Import Value & Volume, 2018-2019 ($)
Figure 71: France Isobutyl Stearate Market Value & Volume, 2021-2026 ($)
Figure 72: France GDP and Population, 2018-2019 ($)
Figure 73: France GDP – Composition of 2018, By Sector of Origin
Figure 74: France Export and Import Value & Volume, 2018-2019 ($)
Figure 75: Netherlands Isobutyl Stearate Market Value & Volume, 2021-2026 ($)
Figure 76: Netherlands GDP and Population, 2018-2019 ($)
Figure 77: Netherlands GDP – Composition of 2018, By Sector of Origin
Figure 78: Netherlands Export and Import Value & Volume, 2018-2019 ($)
Figure 79: Belgium Isobutyl Stearate Market Value & Volume, 2021-2026 ($)
Figure 80: Belgium GDP and Population, 2018-2019 ($)
Figure 81: Belgium GDP – Composition of 2018, By Sector of Origin
Figure 82: Belgium Export and Import Value & Volume, 2018-2019 ($)
Figure 83: Spain Isobutyl Stearate Market Value & Volume, 2021-2026 ($)
Figure 84: Spain GDP and Population, 2018-2019 ($)
Figure 85: Spain GDP – Composition of 2018, By Sector of Origin
Figure 86: Spain Export and Import Value & Volume, 2018-2019 ($)
Figure 87: Denmark Isobutyl Stearate Market Value & Volume, 2021-2026 ($)
Figure 88: Denmark GDP and Population, 2018-2019 ($)
Figure 89: Denmark GDP – Composition of 2018, By Sector of Origin
Figure 90: Denmark Export and Import Value & Volume, 2018-2019 ($)
Figure 91: APAC Isobutyl Stearate Market Value & Volume, 2021-2026 ($)
Figure 92: China Isobutyl Stearate Market Value & Volume, 2021-2026
Figure 93: China GDP and Population, 2018-2019 ($)
Figure 94: China GDP – Composition of 2018, By Sector of Origin
Figure 95: China Export and Import Value & Volume, 2018-2019 ($)Isobutyl Stearate Market China Export and Import Value & Volume, 2018-2019 ($)
Figure 96: Australia Isobutyl Stearate Market Value & Volume, 2021-2026 ($)
Figure 97: Australia GDP and Population, 2018-2019 ($)
Figure 98: Australia GDP – Composition of 2018, By Sector of Origin
Figure 99: Australia Export and Import Value & Volume, 2018-2019 ($)
Figure 100: South Korea Isobutyl Stearate Market Value & Volume, 2021-2026 ($)
Figure 101: South Korea GDP and Population, 2018-2019 ($)
Figure 102: South Korea GDP – Composition of 2018, By Sector of Origin
Figure 103: South Korea Export and Import Value & Volume, 2018-2019 ($)
Figure 104: India Isobutyl Stearate Market Value & Volume, 2021-2026 ($)
Figure 105: India GDP and Population, 2018-2019 ($)
Figure 106: India GDP – Composition of 2018, By Sector of Origin
Figure 107: India Export and Import Value & Volume, 2018-2019 ($)
Figure 108: Taiwan Isobutyl Stearate Market Value & Volume, 2021-2026 ($)
Figure 109: Taiwan GDP and Population, 2018-2019 ($)
Figure 110: Taiwan GDP – Composition of 2018, By Sector of Origin
Figure 111: Taiwan Export and Import Value & Volume, 2018-2019 ($)
Figure 112: Malaysia Isobutyl Stearate Market Value & Volume, 2021-2026 ($)
Figure 113: Malaysia GDP and Population, 2018-2019 ($)
Figure 114: Malaysia GDP – Composition of 2018, By Sector of Origin
Figure 115: Malaysia Export and Import Value & Volume, 2018-2019 ($)
Figure 116: Hong Kong Isobutyl Stearate Market Value & Volume, 2021-2026 ($)
Figure 117: Hong Kong GDP and Population, 2018-2019 ($)
Figure 118: Hong Kong GDP – Composition of 2018, By Sector of Origin
Figure 119: Hong Kong Export and Import Value & Volume, 2018-2019 ($)
Figure 120: Middle East & Africa Isobutyl Stearate Market Middle East & Africa 3D Printing Market Value & Volume, 2021-2026 ($)
Figure 121: Russia Isobutyl Stearate Market Value & Volume, 2021-2026 ($)
Figure 122: Russia GDP and Population, 2018-2019 ($)
Figure 123: Russia GDP – Composition of 2018, By Sector of Origin
Figure 124: Russia Export and Import Value & Volume, 2018-2019 ($)
Figure 125: Israel Isobutyl Stearate Market Value & Volume, 2021-2026 ($)
Figure 126: Israel GDP and Population, 2018-2019 ($)
Figure 127: Israel GDP – Composition of 2018, By Sector of Origin
Figure 128: Israel Export and Import Value & Volume, 2018-2019 ($)
Figure 129: Entropy Share, By Strategies, 2018-2019* (%)Isobutyl Stearate Market 
Figure 130: Developments, 2018-2019*Isobutyl Stearate Market 
Figure 131: Company 1 Isobutyl Stearate Market Net Revenue, By Years, 2018-2019* ($)
Figure 132: Company 1 Isobutyl Stearate Market Net Revenue Share, By Business segments, 2018 (%)
Figure 133: Company 1 Isobutyl Stearate Market Net Sales Share, By Geography, 2018 (%)
Figure 134: Company 2 Isobutyl Stearate Market Net Revenue, By Years, 2018-2019* ($)
Figure 135: Company 2 Isobutyl Stearate Market Net Revenue Share, By Business segments, 2018 (%)
Figure 136: Company 2 Isobutyl Stearate Market Net Sales Share, By Geography, 2018 (%)
Figure 137: Company 3Isobutyl Stearate Market Net Revenue, By Years, 2018-2019* ($)
Figure 138: Company 3Isobutyl Stearate Market Net Revenue Share, By Business segments, 2018 (%)
Figure 139: Company 3Isobutyl Stearate Market Net Sales Share, By Geography, 2018 (%)
Figure 140: Company 4 Isobutyl Stearate Market Net Revenue, By Years, 2018-2019* ($)
Figure 141: Company 4 Isobutyl Stearate Market Net Revenue Share, By Business segments, 2018 (%)
Figure 142: Company 4 Isobutyl Stearate Market Net Sales Share, By Geography, 2018 (%)
Figure 143: Company 5 Isobutyl Stearate Market Net Revenue, By Years, 2018-2019* ($)
Figure 144: Company 5 Isobutyl Stearate Market Net Revenue Share, By Business segments, 2018 (%)
Figure 145: Company 5 Isobutyl Stearate Market Net Sales Share, By Geography, 2018 (%)
Figure 146: Company 6 Isobutyl Stearate Market Net Revenue, By Years, 2018-2019* ($)
Figure 147: Company 6 Isobutyl Stearate Market Net Revenue Share, By Business segments, 2018 (%)
Figure 148: Company 6 Isobutyl Stearate Market Net Sales Share, By Geography, 2018 (%)
Figure 149: Company 7 Isobutyl Stearate Market Net Revenue, By Years, 2018-2019* ($)
Figure 150: Company 7 Isobutyl Stearate Market Net Revenue Share, By Business segments, 2018 (%)
Figure 151: Company 7 Isobutyl Stearate Market Net Sales Share, By Geography, 2018 (%)
Figure 152: Company 8 Isobutyl Stearate Market Net Revenue, By Years, 2018-2019* ($)
Figure 153: Company 8 Isobutyl Stearate Market Net Revenue Share, By Business segments, 2018 (%)
Figure 154: Company 8 Isobutyl Stearate Market Net Sales Share, By Geography, 2018 (%)
Figure 155: Company 9 Isobutyl Stearate Market Net Revenue, By Years, 2018-2019* ($)
Figure 156: Company 9 Isobutyl Stearate Market Net Revenue Share, By Business segments, 2018 (%)
Figure 157: Company 9 Isobutyl Stearate Market Net Sales Share, By Geography, 2018 (%)
Figure 158: Company 10 Isobutyl Stearate Market Net Revenue, By Years, 2018-2019* ($)
Figure 159: Company 10 Isobutyl Stearate Market Net Revenue Share, By Business segments, 2018 (%)
Figure 160: Company 10 Isobutyl Stearate Market Net Sales Share, By Geography, 2018 (%)
Figure 161: Company 11 Isobutyl Stearate Market Net Revenue, By Years, 2018-2019* ($)
Figure 162: Company 11 Isobutyl Stearate Market Net Revenue Share, By Business segments, 2018 (%)
Figure 163: Company 11 Isobutyl Stearate Market Net Sales Share, By Geography, 2018 (%)
Figure 164: Company 12 Isobutyl Stearate Market Net Revenue, By Years, 2018-2019* ($)
Figure 165: Company 12 Isobutyl Stearate Market Net Revenue Share, By Business segments, 2018 (%)
Figure 166: Company 12 Isobutyl Stearate Market Net Sales Share, By Geography, 2018 (%)
Figure 167: Company 13Isobutyl Stearate Market Net Revenue, By Years, 2018-2019* ($)
Figure 168: Company 13Isobutyl Stearate Market Net Revenue Share, By Business segments, 2018 (%)
Figure 169: Company 13Isobutyl Stearate Market Net Sales Share, By Geography, 2018 (%)
Figure 170: Company 14 Isobutyl Stearate Market Net Revenue, By Years, 2018-2019* ($)
Figure 171: Company 14 Isobutyl Stearate Market Net Revenue Share, By Business segments, 2018 (%)
Figure 172: Company 14 Isobutyl Stearate Market Net Sales Share, By Geography, 2018 (%)
Figure 173: Company 15 Isobutyl Stearate Market Net Revenue, By Years, 2018-2019* ($)
Figure 174: Company 15 Isobutyl Stearate Market Net Revenue Share, By Business segments, 2018 (%)
Figure 175: Company 15 Isobutyl Stearate Market Net Sales Share, By Geography, 2018 (%)