 Email
Email Print
Print


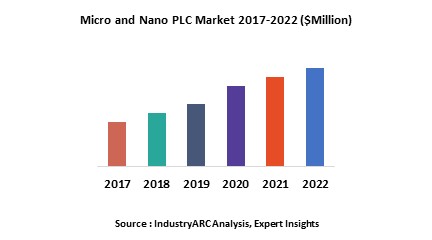
Micro and Nano PLCs are the programmable logic controllers which provides easy and economical solutions to basic control needs for simple machines ranging from relay replacement to simple control timing and logic and helps in automating the overall process. Globally growing trends of automations is expected to remain one of the key growth drivers for micro and nano PLCs during the period of study.
This report identifies the Micro and Nano PLC market size in for the year 2015-2017, and forecast of the same for year 2022. It also highlights the potential growth opportunities in the coming years, while also reviewing the market drivers, restraints, growth indicators, challenges, market dynamics, competitive landscape, and other key aspects with respect to Micro and Nano PLC market.
Geographically North America dominated the Micro and Nano PLC market owing to technological advancement and higher rate of automation in various applications as against any other regions. North America was followed by Asia-Pacific and Europe as the second and third largest markets for micro and nano PLC. However Asia-Pacific is expected to remain the fastest growing market during the period of study driven by rapidly expanding industrial base, up gradation of infrastructure and growing adoption of smart manufacturing process across the industries.
This report segments Micro and Nano PLC market on the basis of offering, type, architecture and industry and regional market as follows:
- On the basis of offerings this report on Micro and Nano PLC market is segmented as follows, covering all offerings in the micro and nano PLC as follows: Hardware, Software and Services
- This report on Micro and Nano PLC also covers in detail various architectures of micro and nano PLC, some of the major architectures covered in the report are Fixed PLC and Modular PLC
- This report on Micro and Nano PLC also covers in detail various types of micro and nano PLC, some of the major types covered in the report are Micro PLC and Nano PLC
- This report on Micro and Nano PLC also covers in detail various end use industries of micro and nano PLC, some of the major end use industries covered in the report are energy & power, chemical & fertilisers, paper & pulp, metal & mining, automotive, food & beverages, oil & gas, home & building automation
- This report on micro and nano PLC has been further segmented into major regions, which includes detailed analysis of each region such as: North America, Europe, Asia-Pacific (APAC), and Rest of the World (RoW) covering all the major country level markets in each of the region
Sample Companies Profiled in this Report are:
- Mitsubishi Electric Corporation
- Rockwell Automation Inc.
- Schneider Electric SE
- Siemens AG
- Robert Bosch GmbH (Bosch Rexroth AG)
- 30+.
1. Micro and Nano PLC Market - Overview
1.1. Definitions and Scope
2. Micro and Nano PLC Market - Executive summary
2.1. Market Revenue, Market Size and Key Trends by Company
2.2. Key Trends by type of Application
2.3. Key Trends segmented by Geography
3. Micro and Nano PLC Market
3.1. Comparative analysis
3.1.1. Product Benchmarking - Top 10 companies
3.1.2. Top 5 Financials Analysis
3.1.3. Market Value split by Top 10 companies
3.1.4. Patent Analysis - Top 10 companies
3.1.5. Pricing Analysis
4. Micro and Nano PLC Market – Startup companies Scenario Premium
4.1. Top 10 startup company Analysis by
4.1.1. Investment
4.1.2. Revenue
4.1.3. Market Shares
4.1.4. Market Size and Application Analysis
4.1.5. Venture Capital and Funding Scenario
5. Micro and Nano PLC Market – Industry Market Entry Scenario Premium
5.1. Regulatory Framework Overview
5.2. New Business and Ease of Doing business index
5.3. Case studies of successful ventures
5.4. Customer Analysis – Top 10 companies
6. Micro and Nano PLC Market Forces
6.1. Drivers
6.2. Constraints
6.3. Challenges
6.4. Porters five force model
6.4.1. Bargaining power of suppliers
6.4.2. Bargaining powers of customers
6.4.3. Threat of new entrants
6.4.4. Rivalry among existing players
6.4.5. Threat of substitutes
7. Micro and Nano PLC Market -Strategic analysis
7.1. Value chain analysis
7.2. Opportunities analysis
7.3. Product life cycle
7.4. Suppliers and distributors Market Share
8. Micro and Nano PLC Market – By Type (Market Size -$Million / $Billion)
8.1. Market Size and Market Share Analysis
8.2. Application Revenue and Trend Research
8.3. Product Segment Analysis
8.3.1. Micro PLC
8.3.2. Nano PLC
9. Micro and Nano PLC Market – By Offering (Market Size -$Million / $Billion)
9.1. Hardware
9.1.1. CPU
9.1.2. Memory
9.1.3. Input/Output Modules
9.1.4. Power Supply Unit
9.1.5. Programing Devices
9.2. Software
9.2.1. Programming Software
9.2.2. Simulation Software
9.2.3. Motion Control Software
9.2.4. Redundancy Software
9.3. Services
9.3.1. Installation
9.3.2. Software Upgradation
9.3.3. Training
9.3.4. Maintenance
10. Micro and Nano PLC Market – By Architecture (Market Size -$Million / $Billion)
10.1. Fixed PLC
10.2. Modular PLC
11. Micro and Nano PLC – By End Use Industry(Market Size -$Million / $Billion)
11.1. Segment type Size and Market Share Analysis
11.2. Application Revenue and Trends by type of Application
11.3. Application Segment Analysis by Type
11.3.1. Chemical & Fertilizers
11.3.1.1. Batch Process Controlling
11.3.2. Automotive
11.3.2.1. General Assembly Line
11.3.2.2. Painting
11.3.3. Food & Beverages
11.3.3.1. Conveyor Control
11.3.3.2. Separator Control and Monitoring
11.3.3.3. Bottling Unit Control
11.3.3.4. Packaging
11.3.4. Home & Building Automation
11.3.4.1. Lighting System Control Systems
11.3.4.2. Water System Control Systems
11.3.4.3. Security System Control Systems
11.3.4.4. Parking-Lot Monitoring Systems
11.3.5. Metals & Mining
11.3.5.1. Metal Processing
11.3.5.2. Weighing Control System
11.3.5.3. Conveyor Belt Control of Open Pit Mining
11.3.5.4. Mine Drainage System
11.3.6. Oil & Gas
11.3.6.1. Upstream
11.3.6.2. Midstream
11.3.6.3. Downstream
11.3.7. Pharmaceutical and Biotech
11.3.7.1. Batch Process Control
11.3.7.2. Packaging
11.3.8. Pulp and Paper
11.3.8.1. Control of Batch Digester
11.3.9. Water & Wastewater
11.3.9.1. Pre-Treatment of Water
11.3.9.2. Water Distribution System
11.3.10.Power
11.3.10.1. Power Generation
11.3.10.2. Power Distribution
12. Micro and Nano PLC - By Geography (Market Size -$Million / $Billion)
12.1. Micro and Nano PLC Market - North America Segment Research
12.2. North America Market Research (Million / $Billion)
12.2.1. Segment type Size and Market Size Analysis
12.2.2. Revenue and Trends
12.2.3. Application Revenue and Trends by type of Application
12.2.4. Company Revenue and Product Analysis
12.2.5. North America Product type and Application Market Size
12.2.5.1. U.S.
12.2.5.2. Canada
12.2.5.3. Mexico
12.2.5.4. Rest of North America
12.3. Micro and Nano PLC - South America Segment Research
12.4. South America Market Research (Market Size -$Million / $Billion)
12.4.1. Segment type Size and Market Size Analysis
12.4.2. Revenue and Trends
12.4.3. Application Revenue and Trends by type of Application
12.4.4. Company Revenue and Product Analysis
12.4.5. South America Product type and Application Market Size
12.4.5.1. Brazil
12.4.5.2. Venezuela
12.4.5.3. Argentina
12.4.5.4. Ecuador
12.4.5.5. Peru
12.4.5.6. Colombia
12.4.5.7. Costa Rica
12.4.5.8. Rest of South America
12.5. Micro and Nano PLC - Europe Segment Research
12.6. Europe Market Research (Market Size -$Million / $Billion)
12.6.1. Segment type Size and Market Size Analysis
12.6.2. Revenue and Trends
12.6.3. Application Revenue and Trends by type of Application
12.6.4. Company Revenue and Product Analysis
12.6.5. Europe Segment Product type and Application Market Size
12.6.5.1. U.K
12.6.5.2. Germany
12.6.5.3. Italy
12.6.5.4. France
12.6.5.5. Netherlands
12.6.5.6. Belgium
12.6.5.7. Spain
12.6.5.8. Denmark
12.6.5.9. Rest of Europe
12.7. Micro and Nano PLC – APAC Segment Research
12.8. APAC Market Research (Market Size -$Million / $Billion)
12.8.1. Segment type Size and Market Size Analysis
12.8.2. Revenue and Trends
12.8.3. Application Revenue and Trends by type of Application
12.8.4. Company Revenue and Product Analysis
12.8.5. APAC Segment – Product type and Application Market Size
12.8.5.1. China
12.8.5.2. Australia
12.8.5.3. Japan
12.8.5.4. South Korea
12.8.5.5. India
12.8.5.6. Taiwan
12.8.5.7. Malaysia
13. Micro and Nano PLC Market - Entropy
13.1. New product launches
13.2. M&A's, collaborations, JVs and partnerships
14. Micro and Nano PLC Market – Industry / Segment Competition landscape Premium
14.1. Market Share Analysis
14.1.1. Market Share by Country- Top companies
14.1.2. Market Share by Region- Top 10 companies
14.1.3. Market Share by type of Application – Top 10 companies
14.1.4. Market Share by type of Product / Product category- Top 10 companies
14.1.5. Market Share at global level- Top 10 companies
14.1.6. Best Practises for companies
15. Micro and Nano PLC Market – Key Company List by Country Premium
16. Micro and Nano PLC Market Company Analysis
16.1. Market Share, Company Revenue, Products, M&A, Developments
16.2. Mitsubishi Electric Corporation
16.3. Rockwell Automation Inc
16.4. Schneider Electric SE
16.5. Siemens AG
16.6. Robert Bosch GmbH (Bosch Rexroth AG)
16.7. Company 6
16.8. Company 7
16.9. Company 8
16.10. Company 9
16.11. Company 10 and More
"*Financials would be provided on a best efforts basis for private companies"
17. Micro and Nano PLC Market -Appendix
17.1. Abbreviations
17.2. Sources
18. Micro and Nano PLC Market -Methodology Premium
18.1. Research Methodology
18.1.1. Company Expert Interviews
18.1.2. Industry Databases
18.1.3. Associations
18.1.4. Company News
18.1.5. Company Annual Reports
18.1.6. Application Trends
18.1.7. New Products and Product database
18.1.8. Company Transcripts
18.1.9. R&D Trends
18.1.10. Key Opinion Leaders Interviews
18.1.11. Supply and Demand Trends
List of Tables:
Table 1: Micro and Nano PLC Market Overview 2021-2026
Table 2: Micro and Nano PLC Market Leader Analysis 2018-2019 (US$)
Table 3: Micro and Nano PLC Market Product Analysis 2018-2019 (US$)
Table 4: Micro and Nano PLC Market End User Analysis 2018-2019 (US$)
Table 5: Micro and Nano PLC Market Patent Analysis 2013-2018* (US$)
Table 6: Micro and Nano PLC Market Financial Analysis 2018-2019 (US$)
Table 7: Micro and Nano PLC Market Driver Analysis 2018-2019 (US$)
Table 8: Micro and Nano PLC Market Challenges Analysis 2018-2019 (US$)
Table 9: Micro and Nano PLC Market Constraint Analysis 2018-2019 (US$)
Table 10: Micro and Nano PLC Market Supplier Bargaining Power Analysis 2018-2019 (US$)
Table 11: Micro and Nano PLC Market Buyer Bargaining Power Analysis 2018-2019 (US$)
Table 12: Micro and Nano PLC Market Threat of Substitutes Analysis 2018-2019 (US$)
Table 13: Micro and Nano PLC Market Threat of New Entrants Analysis 2018-2019 (US$)
Table 14: Micro and Nano PLC Market Degree of Competition Analysis 2018-2019 (US$)
Table 15: Micro and Nano PLC Market Value Chain Analysis 2018-2019 (US$)
Table 16: Micro and Nano PLC Market Pricing Analysis 2021-2026 (US$)
Table 17: Micro and Nano PLC Market Opportunities Analysis 2021-2026 (US$)
Table 18: Micro and Nano PLC Market Product Life Cycle Analysis 2021-2026 (US$)
Table 19: Micro and Nano PLC Market Supplier Analysis 2018-2019 (US$)
Table 20: Micro and Nano PLC Market Distributor Analysis 2018-2019 (US$)
Table 21: Micro and Nano PLC Market Trend Analysis 2018-2019 (US$)
Table 22: Micro and Nano PLC Market Size 2018 (US$)
Table 23: Micro and Nano PLC Market Forecast Analysis 2021-2026 (US$)
Table 24: Micro and Nano PLC Market Sales Forecast Analysis 2021-2026 (Units)
Table 25: Micro and Nano PLC Market, Revenue & Volume,By Type, 2021-2026 ($)
Table 26: Micro and Nano PLC Market By Type, Revenue & Volume,By Micro PLC, 2021-2026 ($)
Table 27: Micro and Nano PLC Market By Type, Revenue & Volume,By Nano PLC, 2021-2026 ($)
Table 28: Micro and Nano PLC Market, Revenue & Volume,By Offering, 2021-2026 ($)
Table 29: Micro and Nano PLC Market By Offering, Revenue & Volume,By Hardware, 2021-2026 ($)
Table 30: Micro and Nano PLC Market By Offering, Revenue & Volume,By Software, 2021-2026 ($)
Table 31: Micro and Nano PLC Market By Offering, Revenue & Volume,By Services, 2021-2026 ($)
Table 32: Micro and Nano PLC Market By Offering, Revenue & Volume,By Installation, 2021-2026 ($)
Table 33: Micro and Nano PLC Market By Offering, Revenue & Volume,By Training, 2021-2026 ($)
Table 34: Micro and Nano PLC Market, Revenue & Volume,By Architecture, 2021-2026 ($)
Table 35: Micro and Nano PLC Market By Architecture, Revenue & Volume,By Fixed PLC, 2021-2026 ($)
Table 36: Micro and Nano PLC Market By Architecture, Revenue & Volume,By Modular PLC, 2021-2026 ($)
Table 37: Micro and Nano PLC Market, Revenue & Volume,By End Use, 2021-2026 ($)
Table 38: Micro and Nano PLC Market By End Use, Revenue & Volume,By Chemical & Fertilizers, 2021-2026 ($)
Table 39: Micro and Nano PLC Market By End Use, Revenue & Volume,By Automotive, 2021-2026 ($)
Table 40: Micro and Nano PLC Market By End Use, Revenue & Volume,By Food & Beverages, 2021-2026 ($)
Table 41: Micro and Nano PLC Market By End Use, Revenue & Volume,By Home & Building Automation, 2021-2026 ($)
Table 42: Micro and Nano PLC Market By End Use, Revenue & Volume,By Metals & Mining, 2021-2026 ($)
Table 43: North America Micro and Nano PLC Market, Revenue & Volume,By Type, 2021-2026 ($)
Table 44: North America Micro and Nano PLC Market, Revenue & Volume,By Offering, 2021-2026 ($)
Table 45: North America Micro and Nano PLC Market, Revenue & Volume,By Architecture, 2021-2026 ($)
Table 46: North America Micro and Nano PLC Market, Revenue & Volume,By End Use, 2021-2026 ($)
Table 47: South america Micro and Nano PLC Market, Revenue & Volume,By Type, 2021-2026 ($)
Table 48: South america Micro and Nano PLC Market, Revenue & Volume,By Offering, 2021-2026 ($)
Table 49: South america Micro and Nano PLC Market, Revenue & Volume,By Architecture, 2021-2026 ($)
Table 50: South america Micro and Nano PLC Market, Revenue & Volume,By End Use, 2021-2026 ($)
Table 51: Europe Micro and Nano PLC Market, Revenue & Volume,By Type, 2021-2026 ($)
Table 52: Europe Micro and Nano PLC Market, Revenue & Volume,By Offering, 2021-2026 ($)
Table 53: Europe Micro and Nano PLC Market, Revenue & Volume,By Architecture, 2021-2026 ($)
Table 54: Europe Micro and Nano PLC Market, Revenue & Volume,By End Use, 2021-2026 ($)
Table 55: APAC Micro and Nano PLC Market, Revenue & Volume,By Type, 2021-2026 ($)
Table 56: APAC Micro and Nano PLC Market, Revenue & Volume,By Offering, 2021-2026 ($)
Table 57: APAC Micro and Nano PLC Market, Revenue & Volume,By Architecture, 2021-2026 ($)
Table 58: APAC Micro and Nano PLC Market, Revenue & Volume,By End Use, 2021-2026 ($)
Table 59: Middle East & Africa Micro and Nano PLC Market, Revenue & Volume,By Type, 2021-2026 ($)
Table 60: Middle East & Africa Micro and Nano PLC Market, Revenue & Volume,By Offering, 2021-2026 ($)
Table 61: Middle East & Africa Micro and Nano PLC Market, Revenue & Volume,By Architecture, 2021-2026 ($)
Table 62: Middle East & Africa Micro and Nano PLC Market, Revenue & Volume,By End Use, 2021-2026 ($)
Table 63: Russia Micro and Nano PLC Market, Revenue & Volume,By Type, 2021-2026 ($)
Table 64: Russia Micro and Nano PLC Market, Revenue & Volume,By Offering, 2021-2026 ($)
Table 65: Russia Micro and Nano PLC Market, Revenue & Volume,By Architecture, 2021-2026 ($)
Table 66: Russia Micro and Nano PLC Market, Revenue & Volume,By End Use, 2021-2026 ($)
Table 67: Israel Micro and Nano PLC Market, Revenue & Volume,By Type, 2021-2026 ($)
Table 68: Israel Micro and Nano PLC Market, Revenue & Volume,By Offering, 2021-2026 ($)
Table 69: Israel Micro and Nano PLC Market, Revenue & Volume,By Architecture, 2021-2026 ($)
Table 70: Israel Micro and Nano PLC Market, Revenue & Volume,By End Use, 2021-2026 ($)
Table 71: Top Companies 2018 (US$)Micro and Nano PLC Market, Revenue & Volume
Table 72: Product Launch 2018-2019Micro and Nano PLC Market, Revenue & Volume
Table 73: Mergers & Acquistions 2018-2019Micro and Nano PLC Market, Revenue & Volume
List of Figures:
Figure 1: Overview of Micro and Nano PLC Market 2021-2026
Figure 2: Market Share Analysis for Micro and Nano PLC Market 2018 (US$)
Figure 3: Product Comparison in Micro and Nano PLC Market 2018-2019 (US$)
Figure 4: End User Profile for Micro and Nano PLC Market 2018-2019 (US$)
Figure 5: Patent Application and Grant in Micro and Nano PLC Market 2013-2018* (US$)
Figure 6: Top 5 Companies Financial Analysis in Micro and Nano PLC Market 2018-2019 (US$)
Figure 7: Market Entry Strategy in Micro and Nano PLC Market 2018-2019
Figure 8: Ecosystem Analysis in Micro and Nano PLC Market 2018
Figure 9: Average Selling Price in Micro and Nano PLC Market 2021-2026
Figure 10: Top Opportunites in Micro and Nano PLC Market 2018-2019
Figure 11: Market Life Cycle Analysis in Micro and Nano PLC Market Market Life Cycle Analysis in 3D Printing
Figure 12: GlobalBy TypeMicro and Nano PLC Market Revenue, 2021-2026 ($)
Figure 13: GlobalBy OfferingMicro and Nano PLC Market Revenue, 2021-2026 ($)
Figure 14: GlobalBy ArchitectureMicro and Nano PLC Market Revenue, 2021-2026 ($)
Figure 15: GlobalBy End UseMicro and Nano PLC Market Revenue, 2021-2026 ($)
Figure 16: Global Micro and Nano PLC Market - By Geography
Figure 17: Global Micro and Nano PLC Market Value & Volume, By Geography, 2021-2026 ($)
Figure 18: Global Micro and Nano PLC Market CAGR, By Geography, 2021-2026 (%)
Figure 19: North America Micro and Nano PLC Market Value & Volume, 2021-2026 ($)
Figure 20: US Micro and Nano PLC Market Value & Volume, 2021-2026 ($)
Figure 21: US GDP and Population, 2018-2019 ($)
Figure 22: US GDP – Composition of 2018, By Sector of Origin
Figure 23: US Export and Import Value & Volume, 2018-2019 ($)
Figure 24: Canada Micro and Nano PLC Market Value & Volume, 2021-2026 ($)
Figure 25: Canada GDP and Population, 2018-2019 ($)
Figure 26: Canada GDP – Composition of 2018, By Sector of Origin
Figure 27: Canada Export and Import Value & Volume, 2018-2019 ($)
Figure 28: Mexico Micro and Nano PLC Market Value & Volume, 2021-2026 ($)
Figure 29: Mexico GDP and Population, 2018-2019 ($)
Figure 30: Mexico GDP – Composition of 2018, By Sector of Origin
Figure 31: Mexico Export and Import Value & Volume, 2018-2019 ($)
Figure 32: South America Micro and Nano PLC Market South America 3D Printing Market Value & Volume, 2021-2026 ($)
Figure 33: Brazil Micro and Nano PLC Market Value & Volume, 2021-2026 ($)
Figure 34: Brazil GDP and Population, 2018-2019 ($)
Figure 35: Brazil GDP – Composition of 2018, By Sector of Origin
Figure 36: Brazil Export and Import Value & Volume, 2018-2019 ($)
Figure 37: Venezuela Micro and Nano PLC Market Value & Volume, 2021-2026 ($)
Figure 38: Venezuela GDP and Population, 2018-2019 ($)
Figure 39: Venezuela GDP – Composition of 2018, By Sector of Origin
Figure 40: Venezuela Export and Import Value & Volume, 2018-2019 ($)
Figure 41: Argentina Micro and Nano PLC Market Value & Volume, 2021-2026 ($)
Figure 42: Argentina GDP and Population, 2018-2019 ($)
Figure 43: Argentina GDP – Composition of 2018, By Sector of Origin
Figure 44: Argentina Export and Import Value & Volume, 2018-2019 ($)
Figure 45: Ecuador Micro and Nano PLC Market Value & Volume, 2021-2026 ($)
Figure 46: Ecuador GDP and Population, 2018-2019 ($)
Figure 47: Ecuador GDP – Composition of 2018, By Sector of Origin
Figure 48: Ecuador Export and Import Value & Volume, 2018-2019 ($)
Figure 49: Peru Micro and Nano PLC Market Value & Volume, 2021-2026 ($)
Figure 50: Peru GDP and Population, 2018-2019 ($)
Figure 51: Peru GDP – Composition of 2018, By Sector of Origin
Figure 52: Peru Export and Import Value & Volume, 2018-2019 ($)
Figure 53: Colombia Micro and Nano PLC Market Value & Volume, 2021-2026 ($)
Figure 54: Colombia GDP and Population, 2018-2019 ($)
Figure 55: Colombia GDP – Composition of 2018, By Sector of Origin
Figure 56: Colombia Export and Import Value & Volume, 2018-2019 ($)
Figure 57: Costa Rica Micro and Nano PLC Market Costa Rica 3D Printing Market Value & Volume, 2021-2026 ($)
Figure 58: Costa Rica GDP and Population, 2018-2019 ($)
Figure 59: Costa Rica GDP – Composition of 2018, By Sector of Origin
Figure 60: Costa Rica Export and Import Value & Volume, 2018-2019 ($)
Figure 61: Europe Micro and Nano PLC Market Value & Volume, 2021-2026 ($)
Figure 62: U.K Micro and Nano PLC Market Value & Volume, 2021-2026 ($)
Figure 63: U.K GDP and Population, 2018-2019 ($)
Figure 64: U.K GDP – Composition of 2018, By Sector of Origin
Figure 65: U.K Export and Import Value & Volume, 2018-2019 ($)
Figure 66: Germany Micro and Nano PLC Market Value & Volume, 2021-2026 ($)
Figure 67: Germany GDP and Population, 2018-2019 ($)
Figure 68: Germany GDP – Composition of 2018, By Sector of Origin
Figure 69: Germany Export and Import Value & Volume, 2018-2019 ($)
Figure 70: Italy Micro and Nano PLC Market Value & Volume, 2021-2026 ($)
Figure 71: Italy GDP and Population, 2018-2019 ($)
Figure 72: Italy GDP – Composition of 2018, By Sector of Origin
Figure 73: Italy Export and Import Value & Volume, 2018-2019 ($)
Figure 74: France Micro and Nano PLC Market Value & Volume, 2021-2026 ($)
Figure 75: France GDP and Population, 2018-2019 ($)
Figure 76: France GDP – Composition of 2018, By Sector of Origin
Figure 77: France Export and Import Value & Volume, 2018-2019 ($)
Figure 78: Netherlands Micro and Nano PLC Market Value & Volume, 2021-2026 ($)
Figure 79: Netherlands GDP and Population, 2018-2019 ($)
Figure 80: Netherlands GDP – Composition of 2018, By Sector of Origin
Figure 81: Netherlands Export and Import Value & Volume, 2018-2019 ($)
Figure 82: Belgium Micro and Nano PLC Market Value & Volume, 2021-2026 ($)
Figure 83: Belgium GDP and Population, 2018-2019 ($)
Figure 84: Belgium GDP – Composition of 2018, By Sector of Origin
Figure 85: Belgium Export and Import Value & Volume, 2018-2019 ($)
Figure 86: Spain Micro and Nano PLC Market Value & Volume, 2021-2026 ($)
Figure 87: Spain GDP and Population, 2018-2019 ($)
Figure 88: Spain GDP – Composition of 2018, By Sector of Origin
Figure 89: Spain Export and Import Value & Volume, 2018-2019 ($)
Figure 90: Denmark Micro and Nano PLC Market Value & Volume, 2021-2026 ($)
Figure 91: Denmark GDP and Population, 2018-2019 ($)
Figure 92: Denmark GDP – Composition of 2018, By Sector of Origin
Figure 93: Denmark Export and Import Value & Volume, 2018-2019 ($)
Figure 94: APAC Micro and Nano PLC Market Value & Volume, 2021-2026 ($)
Figure 95: China Micro and Nano PLC Market Value & Volume, 2021-2026
Figure 96: China GDP and Population, 2018-2019 ($)
Figure 97: China GDP – Composition of 2018, By Sector of Origin
Figure 98: China Export and Import Value & Volume, 2018-2019 ($)Micro and Nano PLC Market China Export and Import Value & Volume, 2018-2019 ($)
Figure 99: Australia Micro and Nano PLC Market Value & Volume, 2021-2026 ($)
Figure 100: Australia GDP and Population, 2018-2019 ($)
Figure 101: Australia GDP – Composition of 2018, By Sector of Origin
Figure 102: Australia Export and Import Value & Volume, 2018-2019 ($)
Figure 103: South Korea Micro and Nano PLC Market Value & Volume, 2021-2026 ($)
Figure 104: South Korea GDP and Population, 2018-2019 ($)
Figure 105: South Korea GDP – Composition of 2018, By Sector of Origin
Figure 106: South Korea Export and Import Value & Volume, 2018-2019 ($)
Figure 107: India Micro and Nano PLC Market Value & Volume, 2021-2026 ($)
Figure 108: India GDP and Population, 2018-2019 ($)
Figure 109: India GDP – Composition of 2018, By Sector of Origin
Figure 110: India Export and Import Value & Volume, 2018-2019 ($)
Figure 111: Taiwan Micro and Nano PLC Market Taiwan 3D Printing Market Value & Volume, 2021-2026 ($)
Figure 112: Taiwan GDP and Population, 2018-2019 ($)
Figure 113: Taiwan GDP – Composition of 2018, By Sector of Origin
Figure 114: Taiwan Export and Import Value & Volume, 2018-2019 ($)
Figure 115: Malaysia Micro and Nano PLC Market Malaysia 3D Printing Market Value & Volume, 2021-2026 ($)
Figure 116: Malaysia GDP and Population, 2018-2019 ($)
Figure 117: Malaysia GDP – Composition of 2018, By Sector of Origin
Figure 118: Malaysia Export and Import Value & Volume, 2018-2019 ($)
Figure 119: Hong Kong Micro and Nano PLC Market Hong Kong 3D Printing Market Value & Volume, 2021-2026 ($)
Figure 120: Hong Kong GDP and Population, 2018-2019 ($)
Figure 121: Hong Kong GDP – Composition of 2018, By Sector of Origin
Figure 122: Hong Kong Export and Import Value & Volume, 2018-2019 ($)
Figure 123: Middle East & Africa Micro and Nano PLC Market Middle East & Africa 3D Printing Market Value & Volume, 2021-2026 ($)
Figure 124: Russia Micro and Nano PLC Market Russia 3D Printing Market Value & Volume, 2021-2026 ($)
Figure 125: Russia GDP and Population, 2018-2019 ($)
Figure 126: Russia GDP – Composition of 2018, By Sector of Origin
Figure 127: Russia Export and Import Value & Volume, 2018-2019 ($)
Figure 128: Israel Micro and Nano PLC Market Value & Volume, 2021-2026 ($)
Figure 129: Israel GDP and Population, 2018-2019 ($)
Figure 130: Israel GDP – Composition of 2018, By Sector of Origin
Figure 131: Israel Export and Import Value & Volume, 2018-2019 ($)
Figure 132: Entropy Share, By Strategies, 2018-2019* (%)Micro and Nano PLC Market
Figure 133: Developments, 2018-2019*Micro and Nano PLC Market
Figure 134: Company 1 Micro and Nano PLC Market Net Revenue, By Years, 2018-2019* ($)
Figure 135: Company 1 Micro and Nano PLC Market Net Revenue Share, By Business segments, 2018 (%)
Figure 136: Company 1 Micro and Nano PLC Market Net Sales Share, By Geography, 2018 (%)
Figure 137: Company 2 Micro and Nano PLC Market Net Revenue, By Years, 2018-2019* ($)
Figure 138: Company 2 Micro and Nano PLC Market Net Revenue Share, By Business segments, 2018 (%)
Figure 139: Company 2 Micro and Nano PLC Market Net Sales Share, By Geography, 2018 (%)
Figure 140: Company 3Micro and Nano PLC Market Net Revenue, By Years, 2018-2019* ($)
Figure 141: Company 3Micro and Nano PLC Market Net Revenue Share, By Business segments, 2018 (%)
Figure 142: Company 3Micro and Nano PLC Market Net Sales Share, By Geography, 2018 (%)
Figure 143: Company 4 Micro and Nano PLC Market Net Revenue, By Years, 2018-2019* ($)
Figure 144: Company 4 Micro and Nano PLC Market Net Revenue Share, By Business segments, 2018 (%)
Figure 145: Company 4 Micro and Nano PLC Market Net Sales Share, By Geography, 2018 (%)
Figure 146: Company 5 Micro and Nano PLC Market Net Revenue, By Years, 2018-2019* ($)
Figure 147: Company 5 Micro and Nano PLC Market Net Revenue Share, By Business segments, 2018 (%)
Figure 148: Company 5 Micro and Nano PLC Market Net Sales Share, By Geography, 2018 (%)
Figure 149: Company 6 Micro and Nano PLC Market Net Revenue, By Years, 2018-2019* ($)
Figure 150: Company 6 Micro and Nano PLC Market Net Revenue Share, By Business segments, 2018 (%)
Figure 151: Company 6 Micro and Nano PLC Market Net Sales Share, By Geography, 2018 (%)
Figure 152: Company 7 Micro and Nano PLC Market Net Revenue, By Years, 2018-2019* ($)
Figure 153: Company 7 Micro and Nano PLC Market Net Revenue Share, By Business segments, 2018 (%)
Figure 154: Company 7 Micro and Nano PLC Market Net Sales Share, By Geography, 2018 (%)
Figure 155: Company 8 Micro and Nano PLC Market Net Revenue, By Years, 2018-2019* ($)
Figure 156: Company 8 Micro and Nano PLC Market Net Revenue Share, By Business segments, 2018 (%)
Figure 157: Company 8 Micro and Nano PLC Market Net Sales Share, By Geography, 2018 (%)
Figure 158: Company 9 Micro and Nano PLC Market Net Revenue, By Years, 2018-2019* ($)
Figure 159: Company 9 Micro and Nano PLC Market Net Revenue Share, By Business segments, 2018 (%)
Figure 160: Company 9 Micro and Nano PLC Market Net Sales Share, By Geography, 2018 (%)
Figure 161: Company 10 Micro and Nano PLC Market Net Revenue, By Years, 2018-2019* ($)
Figure 162: Company 10 Micro and Nano PLC Market Net Revenue Share, By Business segments, 2018 (%)
Figure 163: Company 10 Micro and Nano PLC Market Net Sales Share, By Geography, 2018 (%)
Figure 164: Company 11 Micro and Nano PLC Market Net Revenue, By Years, 2018-2019* ($)
Figure 165: Company 11 Micro and Nano PLC Market Net Revenue Share, By Business segments, 2018 (%)
Figure 166: Company 11 Micro and Nano PLC Market Net Sales Share, By Geography, 2018 (%)
Figure 167: Company 12 Micro and Nano PLC Market Net Revenue, By Years, 2018-2019* ($)
Figure 168: Company 12 Micro and Nano PLC Market Net Revenue Share, By Business segments, 2018 (%)
Figure 169: Company 12 Micro and Nano PLC Market Net Sales Share, By Geography, 2018 (%)
Figure 170: Company 13Micro and Nano PLC Market Net Revenue, By Years, 2018-2019* ($)
Figure 171: Company 13Micro and Nano PLC Market Net Revenue Share, By Business segments, 2018 (%)
Figure 172: Company 13Micro and Nano PLC Market Net Sales Share, By Geography, 2018 (%)
Figure 173: Company 14 Micro and Nano PLC Market Net Revenue, By Years, 2018-2019* ($)
Figure 174: Company 14 Micro and Nano PLC Market Net Revenue Share, By Business segments, 2018 (%)
Figure 175: Company 14 Micro and Nano PLC Market Net Sales Share, By Geography, 2018 (%)
Figure 176: Company 15 Micro and Nano PLC Market Net Revenue, By Years, 2018-2019* ($)
Figure 177: Company 15 Micro and Nano PLC Market Net Revenue Share, By Business segments, 2018 (%)
Figure 178: Company 15 Micro and Nano PLC Market Net Sales Share, By Geography, 2018 (%)