 Email
Email Print
Print


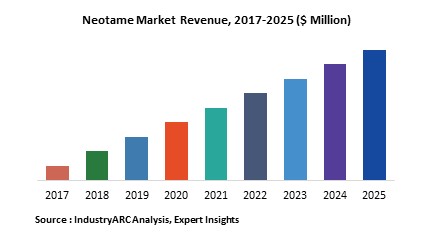
Neotame manufactured from 3,3 –dimethylbutyraldehyde and aspartame, is an artificial sweetener with off-white to white powder and an intensely sweet taste. Neotame delivers great taste and enhances flavours when used as a sweetener and is 8,000 times more sweetness than that of sugar. Globally, increasing health issues such as obesity and diabetes, growing demand for low calories food products, and Neotame’s ability to get rapidly metabolized and get completely eliminated from the body are the prime growth drivers of Neotame market. In addition, increase in adoption of Neotame in emerging economies such as China, India and others, will create new opportunities for Neotame market. However, higher cost of the research and development, and stringent government approval process are the key restraints for Neotame market.
Geographically Europe dominated Neotame market because of higher demand in countries like U.K. and Germany, owing to approval for use of Neotame as an additive in food and beverage by the food authorities. Asia Pacific is projected to have fastest growth, owing to rapidly rising health issues such as obesity and diabetes amongst individual though consumption of high sugar-sweetened food items and beverages, and growing demand for low calories food products, rise in consumer awareness, and favourable government policies in developing nations such as China and India in this region. Among all the end-user industry, food and beverage has the highest market share in Neotame market.
This report identifies the Neotame market size in for the year 2015-2017, and forecast of the same for year 2025. It also highlights the market drivers, restraints, growth indicators, challenges and other key aspects with respect to global Neotame market.
This report segments Neotame market on the basis of application, end-user industry, and regional market as follows:
- Neotame Market, By Application: Baked Goods, Fermented Milk Products, Carbonated Soft Drinks, and Other
- The report has focused study on Neotame market by basis of end-user industry such as: Food & Beverage, Pharmaceutical, Cosmetic, and Agriculture
- This report has been further segmented into major regions, which includes detailed analysis of each region such as: Americas, Europe, Asia-Pacific (APAC) and Rest of the World (RoW) covering all the major country level markets in each of the region
Sample Companies Profiled in this Report are:
- Prinova Group LLC
- Shaoxing Marina Biotechnology Co.,Ltd.
- The NutraSweet Company
- A & Z Food Additives Co
- Fooding Group Limited
- 30+.
1. Neotame Market – Overview
2. Executive Summary
3. Market Landscape
3.1. Market Share Analysis
3.2. Comparative Analysis
3.3. Product Benchmarking
3.4. End User Profiling
3.5. Top 5 Financials Analysis
4. Neotame Market– Forces
4.1. Drivers
4.1.1. Rising demand for customized bread-based bakery products with various formulations in baking ingredients
4.1.2. Growing demand for natural ingredient bakery products
4.2. Restraints
4.2.1. Higher cost of research and development
4.2.2. Stringent government approval process
4.3. Opportunities
4.3.1. Emerging economies
4.4. Challenges
4.5. Porter’s Five Forces Analysis
4.5.1. Bargaining Power of Suppliers
4.5.2. Bargaining Power of Buyers
4.5.3. Threat of New Entrants
4.5.4. Threat of Substitutes
4.5.5. Degree of Competition
5. Neotame Market– Strategic Analysis
5.1. Value Chain Analysis
5.2. Pricing Analysis
5.3. Opportunities Analysis
5.4. Product/Market Life Cycle Analysis
5.5. Suppliers and Distributors
6. Neotame Market, By Application
6.1. Baked Goods
6.2. Fermented Milk Products
6.3. Carbonated Soft Drinks
6.4. Other Food Products
7. Neotame Market, By End-User Industry
7.1. Food & Beverage
7.2. Pharmaceutical
7.3. Cosmetic
7.4. Agriculture
8. Neotame Market, By Geography
8.1. Europe
8.1.1. Germany
8.1.2. France
8.1.3. Italy
8.1.4. Spain
8.1.5. Russia
8.1.6. U.K.
8.1.7. Rest of Europe
8.2. Asia Pacific
8.2.1. China
8.2.2. India
8.2.3. Japan
8.2.4. South Korea
8.2.5. Rest of Asia-Pacific
8.3. Americas
8.3.1. U.S.
8.3.2. Canada
8.3.3. Mexico
8.3.4. Brazil
8.3.5. Rest of Americas
8.4. Rest of the World (RoW)
8.4.1. Middle East & Africa
8.4.2. Rest of RoW
9. Neotame – Market Entropy
9.1. Expansion
9.2. Technological Developments
9.3. Merger & Acquisitions, and Joint Ventures
9.4. Supply- Contract
10. Company Profiles
10.1. Company 1
10.2. Company 2
10.3. Company 3
10.4. Company 4
10.5. Company 5
10.6. Company 6
10.7. Company 7
10.8. Company 8
10.9. Company 9
10.10. Company 10
*More than 30 Companies are profiled in this Research Report, Complete List available on Request*
"*Financials would be provided on a best efforts basis for private companies"
11. Appendix
11.1. Abbreviations
11.2. Sources
11.3. Research Methodology
11.4. Bibliography
11.5. Compilation of Expert Insights
11.6. Disclaimer
List of Tables:
Table 1: Neotame Market Overview 2019-2024
Table 2: Neotame Market Leader Analysis 2018-2019 (US$)
Table 3: Neotame Market Product Analysis 2018-2019 (US$)
Table 4: Neotame Market End User Analysis 2018-2019 (US$)
Table 5: Neotame Market Patent Analysis 2013-2018* (US$)
Table 6: Neotame Market Financial Analysis 2018-2019 (US$)
Table 7: Neotame Market Driver Analysis 2018-2019 (US$)
Table 8: Neotame Market Challenges Analysis 2018-2019 (US$)
Table 9: Neotame Market Constraint Analysis 2018-2019 (US$)
Table 10: Neotame Market Supplier Bargaining Power Analysis 2018-2019 (US$)
Table 11: Neotame Market Buyer Bargaining Power Analysis 2018-2019 (US$)
Table 12: Neotame Market Threat of Substitutes Analysis 2018-2019 (US$)
Table 13: Neotame Market Threat of New Entrants Analysis 2018-2019 (US$)
Table 14: Neotame Market Degree of Competition Analysis 2018-2019 (US$)
Table 15: Neotame Market Value Chain Analysis 2018-2019 (US$)
Table 16: Neotame Market Pricing Analysis 2019-2024 (US$)
Table 17: Neotame Market Opportunities Analysis 2019-2024 (US$)
Table 18: Neotame Market Product Life Cycle Analysis 2019-2024 (US$)
Table 19: Neotame Market Supplier Analysis 2018-2019 (US$)
Table 20: Neotame Market Distributor Analysis 2018-2019 (US$)
Table 21: Neotame Market Trend Analysis 2018-2019 (US$)
Table 22: Neotame Market Size 2018 (US$)
Table 23: Neotame Market Forecast Analysis 2019-2024 (US$)
Table 24: Neotame Market Sales Forecast Analysis 2019-2024 (Units)
Table 25: Neotame Market, Revenue & Volume,By Application, 2019-2024 ($)
Table 26: Neotame Market By Application, Revenue & Volume,By Baked Goods, 2019-2024 ($)
Table 27: Neotame Market By Application, Revenue & Volume,By Fermented Milk Products, 2019-2024 ($)
Table 28: Neotame Market By Application, Revenue & Volume,By Carbonated Soft Drinks, 2019-2024 ($)
Table 29: Neotame Market, Revenue & Volume,By End-User Industry, 2019-2024 ($)
Table 30: Neotame Market By End-User Industry, Revenue & Volume,By Food & Beverage, 2019-2024 ($)
Table 31: Neotame Market By End-User Industry, Revenue & Volume,By Pharmaceutical, 2019-2024 ($)
Table 32: Neotame Market By End-User Industry, Revenue & Volume,By Cosmetic, 2019-2024 ($)
Table 33: Neotame Market By End-User Industry, Revenue & Volume,By Agriculture, 2019-2024 ($)
Table 34: North America Neotame Market, Revenue & Volume,By Application, 2019-2024 ($)
Table 35: North America Neotame Market, Revenue & Volume,By End-User Industry, 2019-2024 ($)
Table 36: South america Neotame Market, Revenue & Volume,By Application, 2019-2024 ($)
Table 37: South america Neotame Market, Revenue & Volume,By End-User Industry, 2019-2024 ($)
Table 38: Europe Neotame Market, Revenue & Volume,By Application, 2019-2024 ($)
Table 39: Europe Neotame Market, Revenue & Volume,By End-User Industry, 2019-2024 ($)
Table 40: APAC Neotame Market, Revenue & Volume,By Application, 2019-2024 ($)
Table 41: APAC Neotame Market, Revenue & Volume,By End-User Industry, 2019-2024 ($)
Table 42: Middle East & Africa Neotame Market, Revenue & Volume,By Application, 2019-2024 ($)
Table 43: Middle East & Africa Neotame Market, Revenue & Volume,By End-User Industry, 2019-2024 ($)
Table 44: Russia Neotame Market, Revenue & Volume,By Application, 2019-2024 ($)
Table 45: Russia Neotame Market, Revenue & Volume,By End-User Industry, 2019-2024 ($)
Table 46: Israel Neotame Market, Revenue & Volume,By Application, 2019-2024 ($)
Table 47: Israel Neotame Market, Revenue & Volume,By End-User Industry, 2019-2024 ($)
Table 48: Top Companies 2018 (US$)Neotame Market, Revenue & Volume
Table 49: Product Launch 2018-2019Neotame Market, Revenue & Volume
Table 50: Mergers & Acquistions 2018-2019Neotame Market, Revenue & Volume
List of Figures:
Figure 1: Overview of Neotame Market 2019-2024
Figure 2: Market Share Analysis for Neotame Market 2018 (US$)
Figure 3: Product Comparison in Neotame Market 2018-2019 (US$)
Figure 4: End User Profile for Neotame Market 2018-2019 (US$)
Figure 5: Patent Application and Grant in Neotame Market 2013-2018* (US$)
Figure 6: Top 5 Companies Financial Analysis in Neotame Market 2018-2019 (US$)
Figure 7: Market Entry Strategy in Neotame Market 2018-2019
Figure 8: Ecosystem Analysis in Neotame Market 2018
Figure 9: Average Selling Price in Neotame Market 2019-2024
Figure 10: Top Opportunites in Neotame Market 2018-2019
Figure 11: Market Life Cycle Analysis in Neotame Market
Figure 12: GlobalBy ApplicationNeotame Market Revenue, 2019-2024 ($)
Figure 13: GlobalBy End-User IndustryNeotame Market Revenue, 2019-2024 ($)
Figure 14: Global Neotame Market - By Geography
Figure 15: Global Neotame Market Value & Volume, By Geography, 2019-2024 ($)
Figure 16: Global Neotame Market CAGR, By Geography, 2019-2024 (%)
Figure 17: North America Neotame Market Value & Volume, 2019-2024 ($)
Figure 18: US Neotame Market Value & Volume, 2019-2024 ($)
Figure 19: US GDP and Population, 2018-2019 ($)
Figure 20: US GDP – Composition of 2018, By Sector of Origin
Figure 21: US Export and Import Value & Volume, 2018-2019 ($)
Figure 22: Canada Neotame Market Value & Volume, 2019-2024 ($)
Figure 23: Canada GDP and Population, 2018-2019 ($)
Figure 24: Canada GDP – Composition of 2018, By Sector of Origin
Figure 25: Canada Export and Import Value & Volume, 2018-2019 ($)
Figure 26: Mexico Neotame Market Value & Volume, 2019-2024 ($)
Figure 27: Mexico GDP and Population, 2018-2019 ($)
Figure 28: Mexico GDP – Composition of 2018, By Sector of Origin
Figure 29: Mexico Export and Import Value & Volume, 2018-2019 ($)
Figure 30: South America Neotame Market Value & Volume, 2019-2024 ($)
Figure 31: Brazil Neotame Market Value & Volume, 2019-2024 ($)
Figure 32: Brazil GDP and Population, 2018-2019 ($)
Figure 33: Brazil GDP – Composition of 2018, By Sector of Origin
Figure 34: Brazil Export and Import Value & Volume, 2018-2019 ($)
Figure 35: Venezuela Neotame Market Value & Volume, 2019-2024 ($)
Figure 36: Venezuela GDP and Population, 2018-2019 ($)
Figure 37: Venezuela GDP – Composition of 2018, By Sector of Origin
Figure 38: Venezuela Export and Import Value & Volume, 2018-2019 ($)
Figure 39: Argentina Neotame Market Value & Volume, 2019-2024 ($)
Figure 40: Argentina GDP and Population, 2018-2019 ($)
Figure 41: Argentina GDP – Composition of 2018, By Sector of Origin
Figure 42: Argentina Export and Import Value & Volume, 2018-2019 ($)
Figure 43: Ecuador Neotame Market Value & Volume, 2019-2024 ($)
Figure 44: Ecuador GDP and Population, 2018-2019 ($)
Figure 45: Ecuador GDP – Composition of 2018, By Sector of Origin
Figure 46: Ecuador Export and Import Value & Volume, 2018-2019 ($)
Figure 47: Peru Neotame Market Value & Volume, 2019-2024 ($)
Figure 48: Peru GDP and Population, 2018-2019 ($)
Figure 49: Peru GDP – Composition of 2018, By Sector of Origin
Figure 50: Peru Export and Import Value & Volume, 2018-2019 ($)
Figure 51: Colombia Neotame Market Value & Volume, 2019-2024 ($)
Figure 52: Colombia GDP and Population, 2018-2019 ($)
Figure 53: Colombia GDP – Composition of 2018, By Sector of Origin
Figure 54: Colombia Export and Import Value & Volume, 2018-2019 ($)
Figure 55: Costa Rica Neotame Market Value & Volume, 2019-2024 ($)
Figure 56: Costa Rica GDP and Population, 2018-2019 ($)
Figure 57: Costa Rica GDP – Composition of 2018, By Sector of Origin
Figure 58: Costa Rica Export and Import Value & Volume, 2018-2019 ($)
Figure 59: Europe Neotame Market Value & Volume, 2019-2024 ($)
Figure 60: U.K Neotame Market Value & Volume, 2019-2024 ($)
Figure 61: U.K GDP and Population, 2018-2019 ($)
Figure 62: U.K GDP – Composition of 2018, By Sector of Origin
Figure 63: U.K Export and Import Value & Volume, 2018-2019 ($)
Figure 64: Germany Neotame Market Value & Volume, 2019-2024 ($)
Figure 65: Germany GDP and Population, 2018-2019 ($)
Figure 66: Germany GDP – Composition of 2018, By Sector of Origin
Figure 67: Germany Export and Import Value & Volume, 2018-2019 ($)
Figure 68: Italy Neotame Market Value & Volume, 2019-2024 ($)
Figure 69: Italy GDP and Population, 2018-2019 ($)
Figure 70: Italy GDP – Composition of 2018, By Sector of Origin
Figure 71: Italy Export and Import Value & Volume, 2018-2019 ($)
Figure 72: France Neotame Market Value & Volume, 2019-2024 ($)
Figure 73: France GDP and Population, 2018-2019 ($)
Figure 74: France GDP – Composition of 2018, By Sector of Origin
Figure 75: France Export and Import Value & Volume, 2018-2019 ($)
Figure 76: Netherlands Neotame Market Value & Volume, 2019-2024 ($)
Figure 77: Netherlands GDP and Population, 2018-2019 ($)
Figure 78: Netherlands GDP – Composition of 2018, By Sector of Origin
Figure 79: Netherlands Export and Import Value & Volume, 2018-2019 ($)
Figure 80: Belgium Neotame Market Value & Volume, 2019-2024 ($)
Figure 81: Belgium GDP and Population, 2018-2019 ($)
Figure 82: Belgium GDP – Composition of 2018, By Sector of Origin
Figure 83: Belgium Export and Import Value & Volume, 2018-2019 ($)
Figure 84: Spain Neotame Market Value & Volume, 2019-2024 ($)
Figure 85: Spain GDP and Population, 2018-2019 ($)
Figure 86: Spain GDP – Composition of 2018, By Sector of Origin
Figure 87: Spain Export and Import Value & Volume, 2018-2019 ($)
Figure 88: Denmark Neotame Market Value & Volume, 2019-2024 ($)
Figure 89: Denmark GDP and Population, 2018-2019 ($)
Figure 90: Denmark GDP – Composition of 2018, By Sector of Origin
Figure 91: Denmark Export and Import Value & Volume, 2018-2019 ($)
Figure 92: APAC Neotame Market Value & Volume, 2019-2024 ($)
Figure 93: China Neotame Market Value & Volume, 2019-2024
Figure 94: China GDP and Population, 2018-2019 ($)
Figure 95: China GDP – Composition of 2018, By Sector of Origin
Figure 96: China Export and Import Value & Volume, 2018-2019 ($)Neotame Market China Export and Import Value & Volume, 2018-2019 ($)
Figure 97: Australia Neotame Market Value & Volume, 2019-2024 ($)
Figure 98: Australia GDP and Population, 2018-2019 ($)
Figure 99: Australia GDP – Composition of 2018, By Sector of Origin
Figure 100: Australia Export and Import Value & Volume, 2018-2019 ($)
Figure 101: South Korea Neotame Market Value & Volume, 2019-2024 ($)
Figure 102: South Korea GDP and Population, 2018-2019 ($)
Figure 103: South Korea GDP – Composition of 2018, By Sector of Origin
Figure 104: South Korea Export and Import Value & Volume, 2018-2019 ($)
Figure 105: India Neotame Market Value & Volume, 2019-2024 ($)
Figure 106: India GDP and Population, 2018-2019 ($)
Figure 107: India GDP – Composition of 2018, By Sector of Origin
Figure 108: India Export and Import Value & Volume, 2018-2019 ($)
Figure 109: Taiwan Neotame Market Value & Volume, 2019-2024 ($)
Figure 110: Taiwan GDP and Population, 2018-2019 ($)
Figure 111: Taiwan GDP – Composition of 2018, By Sector of Origin
Figure 112: Taiwan Export and Import Value & Volume, 2018-2019 ($)
Figure 113: Malaysia Neotame Market Value & Volume, 2019-2024 ($)
Figure 114: Malaysia GDP and Population, 2018-2019 ($)
Figure 115: Malaysia GDP – Composition of 2018, By Sector of Origin
Figure 116: Malaysia Export and Import Value & Volume, 2018-2019 ($)
Figure 117: Hong Kong Neotame Market Value & Volume, 2019-2024 ($)
Figure 118: Hong Kong GDP and Population, 2018-2019 ($)
Figure 119: Hong Kong GDP – Composition of 2018, By Sector of Origin
Figure 120: Hong Kong Export and Import Value & Volume, 2018-2019 ($)
Figure 121: Middle East & Africa Neotame Market Middle East & Africa 3D Printing Market Value & Volume, 2019-2024 ($)
Figure 122: Russia Neotame Market Value & Volume, 2019-2024 ($)
Figure 123: Russia GDP and Population, 2018-2019 ($)
Figure 124: Russia GDP – Composition of 2018, By Sector of Origin
Figure 125: Russia Export and Import Value & Volume, 2018-2019 ($)
Figure 126: Israel Neotame Market Value & Volume, 2019-2024 ($)
Figure 127: Israel GDP and Population, 2018-2019 ($)
Figure 128: Israel GDP – Composition of 2018, By Sector of Origin
Figure 129: Israel Export and Import Value & Volume, 2018-2019 ($)
Figure 130: Entropy Share, By Strategies, 2018-2019* (%)Neotame Market
Figure 131: Developments, 2018-2019*Neotame Market
Figure 132: Company 1 Neotame Market Net Revenue, By Years, 2018-2019* ($)
Figure 133: Company 1 Neotame Market Net Revenue Share, By Business segments, 2018 (%)
Figure 134: Company 1 Neotame Market Net Sales Share, By Geography, 2018 (%)
Figure 135: Company 2 Neotame Market Net Revenue, By Years, 2018-2019* ($)
Figure 136: Company 2 Neotame Market Net Revenue Share, By Business segments, 2018 (%)
Figure 137: Company 2 Neotame Market Net Sales Share, By Geography, 2018 (%)
Figure 138: Company 3Neotame Market Net Revenue, By Years, 2018-2019* ($)
Figure 139: Company 3Neotame Market Net Revenue Share, By Business segments, 2018 (%)
Figure 140: Company 3Neotame Market Net Sales Share, By Geography, 2018 (%)
Figure 141: Company 4 Neotame Market Net Revenue, By Years, 2018-2019* ($)
Figure 142: Company 4 Neotame Market Net Revenue Share, By Business segments, 2018 (%)
Figure 143: Company 4 Neotame Market Net Sales Share, By Geography, 2018 (%)
Figure 144: Company 5 Neotame Market Net Revenue, By Years, 2018-2019* ($)
Figure 145: Company 5 Neotame Market Net Revenue Share, By Business segments, 2018 (%)
Figure 146: Company 5 Neotame Market Net Sales Share, By Geography, 2018 (%)
Figure 147: Company 6 Neotame Market Net Revenue, By Years, 2018-2019* ($)
Figure 148: Company 6 Neotame Market Net Revenue Share, By Business segments, 2018 (%)
Figure 149: Company 6 Neotame Market Net Sales Share, By Geography, 2018 (%)
Figure 150: Company 7 Neotame Market Net Revenue, By Years, 2018-2019* ($)
Figure 151: Company 7 Neotame Market Net Revenue Share, By Business segments, 2018 (%)
Figure 152: Company 7 Neotame Market Net Sales Share, By Geography, 2018 (%)
Figure 153: Company 8 Neotame Market Net Revenue, By Years, 2018-2019* ($)
Figure 154: Company 8 Neotame Market Net Revenue Share, By Business segments, 2018 (%)
Figure 155: Company 8 Neotame Market Net Sales Share, By Geography, 2018 (%)
Figure 156: Company 9 Neotame Market Net Revenue, By Years, 2018-2019* ($)
Figure 157: Company 9 Neotame Market Net Revenue Share, By Business segments, 2018 (%)
Figure 158: Company 9 Neotame Market Net Sales Share, By Geography, 2018 (%)
Figure 159: Company 10 Neotame Market Net Revenue, By Years, 2018-2019* ($)
Figure 160: Company 10 Neotame Market Net Revenue Share, By Business segments, 2018 (%)
Figure 161: Company 10 Neotame Market Net Sales Share, By Geography, 2018 (%)
Figure 162: Company 11 Neotame Market Net Revenue, By Years, 2018-2019* ($)
Figure 163: Company 11 Neotame Market Net Revenue Share, By Business segments, 2018 (%)
Figure 164: Company 11 Neotame Market Net Sales Share, By Geography, 2018 (%)
Figure 165: Company 12 Neotame Market Net Revenue, By Years, 2018-2019* ($)
Figure 166: Company 12 Neotame Market Net Revenue Share, By Business segments, 2018 (%)
Figure 167: Company 12 Neotame Market Net Sales Share, By Geography, 2018 (%)
Figure 168: Company 13Neotame Market Net Revenue, By Years, 2018-2019* ($)
Figure 169: Company 13Neotame Market Net Revenue Share, By Business segments, 2018 (%)
Figure 170: Company 13Neotame Market Net Sales Share, By Geography, 2018 (%)
Figure 171: Company 14 Neotame Market Net Revenue, By Years, 2018-2019* ($)
Figure 172: Company 14 Neotame Market Net Revenue Share, By Business segments, 2018 (%)
Figure 173: Company 14 Neotame Market Net Sales Share, By Geography, 2018 (%)
Figure 174: Company 15 Neotame Market Net Revenue, By Years, 2018-2019* ($)
Figure 175: Company 15 Neotame Market Net Revenue Share, By Business segments, 2018 (%)
Figure 176: Company 15 Neotame Market Net Sales Share, By Geography, 2018 (%)