 Email
Email Print
Print


Fruit water refers to the water having a combination of fruits, vegetables, and herbs. This type of drink/water has a fruit flavor with no calories and thus can be consumed to gain better health. In the period of growing health consciousness, fruit water has emerged as a healthy and tasty way to keep the body hydrated. Fruit water not just keeps body hydrated, it also enhances the flavor without adding any chemical or excess sugar. Globally increasing health awareness is expected to remain the key growth driver for fruit water during the period of study.
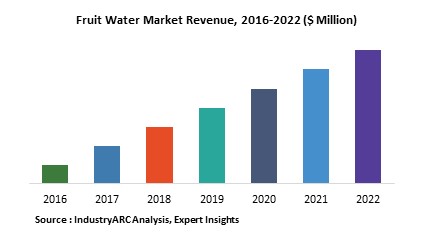
This report identifies the Fruit Water market size in for the year 2015-2017, and forecast of the same for year 2022. It also highlights the potential growth opportunities in the coming years, while also reviewing the market drivers, restraints, growth indicators, challenges, market dynamics, competitive landscape, and other key aspects with respect to Fruit Water market.
Geographically North America dominated Fruit Water market owing to higher demand and consumption of such products due to higher health consciousness amongst its citizens and higher demand of packaged food & beverage products in the region. North America was followed by Europe and Asia-Pacific as the second and third largest market for fruit water in 2015. However, Asia-Pacific is expected to remain fastest growing regional market driven changing lifestyle of the people, rising health consciousness and increasing demand of natural fruit flavors as compared to aerated soft drinks in the major economies such as India, China, thereby leading to the high growth in Asia Pacific during the forecast period.
This report segments Fruit Water market on the basis of product category, form, flavour, packaging, distribution channel and regional market as follows:
- On the basis of product category this report on Fruit Water market is segmented as follows, covering all major product category of the fruit water as follows: Sweetened Water, Unsweetened Water
- On the basis of form this report on Fruit Water market is segmented as follows, covering all major forms of the fruit water as follows: Natural, Organic
- On the basis of flavors this report on Fruit Water market is segmented as follows, covering all major flavors of the fruit water as follows: White Grape, Mango, Aloe Vera, Pineapple, Coconut, and Others
- On the basis of packaging this report on Fruit Water market is segmented as follows, covering all major packaging types of the fruit water as follows: Plastic Bottles, Cans, Tetra Packs, Pouches and Others
- On the basis of distribution channel this report on Fruit Water market is segmented as follows, covering all major distribution channels of the fruit water as follows: Hypermarket/Supermarket, Convenience Store, Specialty Stores, Online Stores and Others
- This report on fruit water has been further segmented into major regions, which includes detailed analysis of each region such as: North America, Europe, Asia-Pacific (APAC) and Rest of the World (RoW) covering all the major country level markets in each of the region
Sample Companies Profiled in this Report are:
- The Coca-Cola Company
- Zpirit Foods Inc.
- National Beverage Corp.
- Clearly Food & Beverage Company Ltd
- Adirondack beverages, Inc.
- 30+.
1. Fruit Water Market – Overview
2. Executive Summary
3. Market Landscape
3.1. Market Share Analysis
3.2. Comparative Analysis
3.3. Product Benchmarking
3.4. End User Profiling
3.5. Top 5 Financials Analysis
4. Fruit Water Market– Forces
4.1. Drivers
4.1.1. Increasing awareness about health benefits, antioxidants properties, nutritional value, and better taste
4.1.2. The trend of clean label and natural flavors in the food & beverages
4.1.3. Economic recovery & growing population
4.2. Restraints
4.2.1. Rising cost of raw materials
4.3. Opportunities
4.3.1. Increasing demand for packaged food & beverages in developing nations
4.4. Challenges
4.5. Porter’s Five Forces Analysis
4.5.1. Bargaining Power of Suppliers
4.5.2. Bargaining Power of Buyers
4.5.3. Threat of New Entrants
4.5.4. Threat of Substitutes
4.5.5. Degree of Competition
5. Fruit Water Market – Strategic Analysis
5.1. Value Chain Analysis
5.2. Pricing Analysis
5.3. Opportunities Analysis
5.4. Product/Market Life cycle Analysis
5.5. Suppliers & Distributors
6. Fruit Water Market, By Type
6.1. Sweetened Water
6.2. Unsweetened Water
7. Fruit Water Market, By Form
7.1. Natural
7.2. Organic
8. Fruit Water Market, By Flavor
8.1. White Grape
8.2. Mango
8.3. Aloe Vera
8.4. Pineapple
8.5. Coconut
8.6. Others
9. Fruit Water Market, By Packaging
9.1. Plastic Bottles
9.2. Cans
9.3. Tetra Packs
9.4. Pouches
9.5. Others
10. Fruit Water Market, By Distribution Channel
10.1. Hypermarket/Supermarket,
10.2. Convenience Store
10.3. Specialty Stores
10.4. Online Stores
10.5. Others
11. Fruit Water Market, By Geography
11.1. Europe
11.1.1. Germany
11.1.2. France
11.1.3. Italy
11.1.4. Spain
11.1.5. Russia
11.1.6. U.K.
11.1.7. Rest of Europe
11.2. Asia Pacific
11.2.1. China
11.2.2. India
11.2.3. Japan
11.2.4. South Korea
11.2.5. Rest of Asia-Pacific
11.3. North America
11.3.1. U.S.
11.3.2. Canada
11.3.3. Mexico
11.4. Rest of the World (RoW)
11.4.1. Middle East
11.4.2. South America
11.4.3. Africa
12. Fruit Water – Market Entropy
12.1. Expansion
12.2. Technological Developments
12.3. Merger & Acquisitions, and Joint Ventures
12.4. Supply- Contract
13. Company Profiles (Overview, Financials, SWOT Analysis, Developments, Product Portfolio)
13.1. Company 1
13.2. Company 2
13.3. Company 3
13.4. Company 4
13.5. Company 5
13.6. Company 6
13.7. Company 7
13.8. Company 8
13.9. Company 9
13.10. Company 10
*More than 10 Companies are profiled in this Research Report*
"*Financials would be provided on a best efforts basis for private companies"
14. Appendix
14.1. Abbreviations
14.2. Sources
14.3. Research Methodology
14.4. Bibiliography
14.5. Compilation of Expert Insights
14.6. Disclaimer
List of Tables
Table1: Fruit Water Market Overview 2019-2024
Table2: Fruit Water Market Leader Analysis 2018-2019 (US$)
Table3: Fruit Water Market Product Analysis 2018-2019 (US$)
Table4: Fruit Water Market End User Analysis 2018-2019 (US$)
Table5: Fruit Water Market Patent Analysis 2013-2018* (US$)
Table6: Fruit Water Market Financial Analysis 2018-2019 (US$)
Table7: Fruit Water Market Driver Analysis 2018-2019 (US$)
Table8: Fruit Water Market Challenges Analysis 2018-2019 (US$)
Table9: Fruit Water Market Constraint Analysis 2018-2019 (US$)
Table10: Fruit Water Market Supplier Bargaining Power Analysis 2018-2019 (US$)
Table11: Fruit Water Market Buyer Bargaining Power Analysis 2018-2019 (US$)
Table12: Fruit Water Market Threat of Substitutes Analysis 2018-2019 (US$)
Table13: Fruit Water Market Threat of New Entrants Analysis 2018-2019 (US$)
Table14: Fruit Water Market Degree of Competition Analysis 2018-2019 (US$)
Table15: Fruit Water Market Value Chain Analysis 2018-2019 (US$)
Table16: Fruit Water Market Pricing Analysis 2019-2024 (US$)
Table17: Fruit Water Market Opportunities Analysis 2019-2024 (US$)
Table18: Fruit Water Market Product Life Cycle Analysis 2019-2024 (US$)
Table19: Fruit Water Market Supplier Analysis 2018-2019 (US$)
Table20: Fruit Water Market Distributor Analysis 2018-2019 (US$)
Table21: Fruit Water Market Trend Analysis 2018-2019 (US$)
Table22: Fruit Water Market Size 2018 (US$)
Table23: Fruit Water Market Forecast Analysis 2019-2024 (US$)
Table24: Fruit Water Market Sales Forecast Analysis 2019-2024 (Units)
Table25: Fruit Water Market, Revenue & Volume,By Type, 2019-2024 ($)
Table26: Fruit Water Market By Type, Revenue & Volume,By Sweetened Water, 2019-2024 ($)
Table27: Fruit Water Market By Type, Revenue & Volume,By Unsweetened Water, 2019-2024 ($)
Table28: Fruit Water Market, Revenue & Volume,By Form, 2019-2024 ($)
Table29: Fruit Water Market By Form, Revenue & Volume,By Natural, 2019-2024 ($)
Table30: Fruit Water Market By Form, Revenue & Volume,By Organic, 2019-2024 ($)
Table31: Fruit Water Market, Revenue & Volume,By Flavor, 2019-2024 ($)
Table32: Fruit Water Market By Flavor, Revenue & Volume,By White Grape, 2019-2024 ($)
Table33: Fruit Water Market By Flavor, Revenue & Volume,By Mango, 2019-2024 ($)
Table34: Fruit Water Market By Flavor, Revenue & Volume,By Aloe Vera, 2019-2024 ($)
Table35: Fruit Water Market By Flavor, Revenue & Volume,By Pineapple, 2019-2024 ($)
Table36: Fruit Water Market By Flavor, Revenue & Volume,By Coconut, 2019-2024 ($)
Table37: Fruit Water Market, Revenue & Volume,By Packaging, 2019-2024 ($)
Table38: Fruit Water Market By Packaging, Revenue & Volume,By Plastic Bottles, 2019-2024 ($)
Table39: Fruit Water Market By Packaging, Revenue & Volume,By Cans, 2019-2024 ($)
Table40: Fruit Water Market By Packaging, Revenue & Volume,By Tetra Packs, 2019-2024 ($)
Table41: Fruit Water Market By Packaging, Revenue & Volume,By Pouches, 2019-2024 ($)
Table42: Fruit Water Market, Revenue & Volume,By Distribution Channel, 2019-2024 ($)
Table43: Fruit Water Market By Distribution Channel, Revenue & Volume,By Hypermarket/Supermarket, 2019-2024 ($)
Table44: Fruit Water Market By Distribution Channel, Revenue & Volume,By Convenience Store, 2019-2024 ($)
Table45: Fruit Water Market By Distribution Channel, Revenue & Volume,By Specialty Stores, 2019-2024 ($)
Table46: Fruit Water Market By Distribution Channel, Revenue & Volume,By Online Stores, 2019-2024 ($)
Table47: North America Fruit Water Market, Revenue & Volume,By Type, 2019-2024 ($)
Table48: North America Fruit Water Market, Revenue & Volume,By Form, 2019-2024 ($)
Table49: North America Fruit Water Market, Revenue & Volume,By Flavor, 2019-2024 ($)
Table50: North America Fruit Water Market, Revenue & Volume,By Packaging, 2019-2024 ($)
Table51: North America Fruit Water Market, Revenue & Volume,By Distribution Channel, 2019-2024 ($)
Table52: South america Fruit Water Market, Revenue & Volume,By Type, 2019-2024 ($)
Table53: South america Fruit Water Market, Revenue & Volume,By Form, 2019-2024 ($)
Table54: South america Fruit Water Market, Revenue & Volume,By Flavor, 2019-2024 ($)
Table55: South america Fruit Water Market, Revenue & Volume,By Packaging, 2019-2024 ($)
Table56: South america Fruit Water Market, Revenue & Volume,By Distribution Channel, 2019-2024 ($)
Table57: Europe Fruit Water Market, Revenue & Volume,By Type, 2019-2024 ($)
Table58: Europe Fruit Water Market, Revenue & Volume,By Form, 2019-2024 ($)
Table59: Europe Fruit Water Market, Revenue & Volume,By Flavor, 2019-2024 ($)
Table60: Europe Fruit Water Market, Revenue & Volume,By Packaging, 2019-2024 ($)
Table61: Europe Fruit Water Market, Revenue & Volume,By Distribution Channel, 2019-2024 ($)
Table62: APAC Fruit Water Market, Revenue & Volume,By Type, 2019-2024 ($)
Table63: APAC Fruit Water Market, Revenue & Volume,By Form, 2019-2024 ($)
Table64: APAC Fruit Water Market, Revenue & Volume,By Flavor, 2019-2024 ($)
Table65: APAC Fruit Water Market, Revenue & Volume,By Packaging, 2019-2024 ($)
Table66: APAC Fruit Water Market, Revenue & Volume,By Distribution Channel, 2019-2024 ($)
Table67: Middle East & Africa Fruit Water Market, Revenue & Volume,By Type, 2019-2024 ($)
Table68: Middle East & Africa Fruit Water Market, Revenue & Volume,By Form, 2019-2024 ($)
Table69: Middle East & Africa Fruit Water Market, Revenue & Volume,By Flavor, 2019-2024 ($)
Table70: Middle East & Africa Fruit Water Market, Revenue & Volume,By Packaging, 2019-2024 ($)
Table71: Middle East & Africa Fruit Water Market, Revenue & Volume,By Distribution Channel, 2019-2024 ($)
Table72: Russia Fruit Water Market, Revenue & Volume,By Type, 2019-2024 ($)
Table73: Russia Fruit Water Market, Revenue & Volume,By Form, 2019-2024 ($)
Table74: Russia Fruit Water Market, Revenue & Volume,By Flavor, 2019-2024 ($)
Table75: Russia Fruit Water Market, Revenue & Volume,By Packaging, 2019-2024 ($)
Table76: Russia Fruit Water Market, Revenue & Volume,By Distribution Channel, 2019-2024 ($)
Table77: Israel Fruit Water Market, Revenue & Volume,By Type, 2019-2024 ($)
Table78: Israel Fruit Water Market, Revenue & Volume,By Form, 2019-2024 ($)
Table79: Israel Fruit Water Market, Revenue & Volume,By Flavor, 2019-2024 ($)
Table80: Israel Fruit Water Market, Revenue & Volume,By Packaging, 2019-2024 ($)
Table81: Israel Fruit Water Market, Revenue & Volume,By Distribution Channel, 2019-2024 ($)
Table82: Top Companies 2018 (US$) Fruit Water Market, Revenue & Volume
Table83: Product Launch 2018-2019 Fruit Water Market, Revenue & Volume
Table84: Mergers & Acquistions 2018-2019 Fruit Water Market, Revenue & Volume
List of Figures
Figure 1: Overview of Fruit Water Market 2019-2024
Figure 2: Market Share Analysis for Fruit Water Market 2018 (US$)
Figure 3: Product Comparison in Fruit Water Market 2018-2019 (US$)
Figure 4: End User Profile for Fruit Water Market 2018-2019 (US$)
Figure 5: Patent Application and Grant in Fruit Water Market 2013-2018* (US$)
Figure 6: Top 5 Companies Financial Analysis in Fruit Water Market 2018-2019 (US$)
Figure 7: Market Entry Strategy in Fruit Water Market 2018-2019
Figure 8: Ecosystem Analysis in Fruit Water Market 2018
Figure 9: Average Selling Price in Fruit Water Market 2019-2024
Figure 10: Top Opportunites in Fruit Water Market 2018-2019
Figure 11: Market Life Cycle Analysis in Fruit Water Market
Figure 12: GlobalBy Type Fruit Water Market Revenue, 2019-2024 ($)
Figure 13: GlobalBy Form Fruit Water Market Revenue, 2019-2024 ($)
Figure 14: GlobalBy Flavor Fruit Water Market Revenue, 2019-2024 ($)
Figure 15: GlobalBy Packaging Fruit Water Market Revenue, 2019-2024 ($)
Figure 16: GlobalBy Distribution Channel Fruit Water Market Revenue, 2019-2024 ($)
Figure 17: Global Fruit Water Market - By Geography
Figure 18: Global Fruit Water Market Value & Volume, By Geography, 2019-2024 ($)Â
Figure 19: Global Fruit Water Market CAGR, By Geography, 2019-2024 (%)
Figure 20: North America Fruit Water Market Value & Volume, 2019-2024 ($)
Figure 21: US Fruit Water Market Value & Volume, 2019-2024 ($)
Figure 22: US GDP and Population, 2018-2019 ($)
Figure 23: US GDP – Composition of 2018, By Sector of Origin
Figure 24: US Export and Import Value & Volume, 2018-2019 ($)
Figure 25: Canada Fruit Water Market Value & Volume, 2019-2024 ($)
Figure 26: Canada GDP and Population, 2018-2019 ($)
Figure 27: Canada GDP – Composition of 2018, By Sector of Origin
Figure 28: Canada Export and Import Value & Volume, 2018-2019 ($)
Figure 29: Mexico Fruit Water Market Value & Volume, 2019-2024 ($)
Figure 30: Mexico GDP and Population, 2018-2019 ($)
Figure 31: Mexico GDP – Composition of 2018, By Sector of Origin
Figure 32: Mexico Export and Import Value & Volume, 2018-2019 ($)
Figure 33: South America Fruit Water Market Value & Volume, 2019-2024 ($)
Figure 34: Brazil Fruit Water Market Value & Volume, 2019-2024 ($)
Figure 35: Brazil GDP and Population, 2018-2019 ($)
Figure 36: Brazil GDP – Composition of 2018, By Sector of Origin
Figure 37: Brazil Export and Import Value & Volume, 2018-2019 ($)
Figure 38: Venezuela Fruit Water Market Value & Volume, 2019-2024 ($)
Figure 39: Venezuela GDP and Population, 2018-2019 ($)
Figure 40: Venezuela GDP – Composition of 2018, By Sector of Origin
Figure 41: Venezuela Export and Import Value & Volume, 2018-2019 ($)
Figure 42: Argentina Fruit Water Market Value & Volume, 2019-2024 ($)
Figure 43: Argentina GDP and Population, 2018-2019 ($)
Figure 44: Argentina GDP – Composition of 2018, By Sector of Origin
Figure 45: Argentina Export and Import Value & Volume, 2018-2019 ($)
Figure 46: Ecuador Fruit Water Market Value & Volume, 2019-2024 ($)
Figure 47: Ecuador GDP and Population, 2018-2019 ($)
Figure 48: Ecuador GDP – Composition of 2018, By Sector of Origin
Figure 49: Ecuador Export and Import Value & Volume, 2018-2019 ($)
Figure 50: Peru Fruit Water Market Value & Volume, 2019-2024 ($)
Figure 51: Peru GDP and Population, 2018-2019 ($)
Figure 52: Peru GDP – Composition of 2018, By Sector of Origin
Figure 53: Peru Export and Import Value & Volume, 2018-2019 ($)
Figure 54: Colombia Fruit Water Market Value & Volume, 2019-2024 ($)
Figure 55: Colombia GDP and Population, 2018-2019 ($)
Figure 56: Colombia GDP – Composition of 2018, By Sector of Origin
Figure 57: Colombia Export and Import Value & Volume, 2018-2019 ($)
Figure 58: Costa Rica Fruit Water Market Value & Volume, 2019-2024 ($)
Figure 59: Costa Rica GDP and Population, 2018-2019 ($)
Figure 60: Costa Rica GDP – Composition of 2018, By Sector of Origin
Figure 61: Costa Rica Export and Import Value & Volume, 2018-2019 ($)
Figure 62: Europe Fruit Water Market Value & Volume, 2019-2024 ($)
Figure 63: U.K Fruit Water Market Value & Volume, 2019-2024 ($)
Figure 64: U.K GDP and Population, 2018-2019 ($)
Figure 65: U.K GDP – Composition of 2018, By Sector of Origin
Figure 66: U.K Export and Import Value & Volume, 2018-2019 ($)
Figure 67: Germany Fruit Water Market Value & Volume, 2019-2024 ($)
Figure 68: Germany GDP and Population, 2018-2019 ($)
Figure 69: Germany GDP – Composition of 2018, By Sector of Origin
Figure 70: Germany Export and Import Value & Volume, 2018-2019 ($)
Figure 71: Italy Fruit Water Market Value & Volume, 2019-2024 ($)
Figure 72: Italy GDP and Population, 2018-2019 ($)
Figure 73: Italy GDP – Composition of 2018, By Sector of Origin
Figure 74: Italy Export and Import Value & Volume, 2018-2019 ($)
Figure 75: France Fruit Water Market Value & Volume, 2019-2024 ($)
Figure 76: France GDP and Population, 2018-2019 ($)
Figure 77: France GDP – Composition of 2018, By Sector of Origin
Figure 78: France Export and Import Value & Volume, 2018-2019 ($)
Figure 79: Netherlands Fruit Water Market Value & Volume, 2019-2024 ($)
Figure 80: Netherlands GDP and Population, 2018-2019 ($)
Figure 81: Netherlands GDP – Composition of 2018, By Sector of Origin
Figure 82: Netherlands Export and Import Value & Volume, 2018-2019 ($)
Figure 83: Belgium Fruit Water Market Value & Volume, 2019-2024 ($)
Figure 84: Belgium GDP and Population, 2018-2019 ($)
Figure 85: Belgium GDP – Composition of 2018, By Sector of Origin
Figure 86: Belgium Export and Import Value & Volume, 2018-2019 ($)
Figure 87: Spain Fruit Water Market Value & Volume, 2019-2024 ($)
Figure 88: Spain GDP and Population, 2018-2019 ($)
Figure 89: Spain GDP – Composition of 2018, By Sector of Origin
Figure 90: Spain Export and Import Value & Volume, 2018-2019 ($)
Figure 91: Denmark Fruit Water Market Value & Volume, 2019-2024 ($)
Figure 92: Denmark GDP and Population, 2018-2019 ($)
Figure 93: Denmark GDP – Composition of 2018, By Sector of Origin
Figure 94: Denmark Export and Import Value & Volume, 2018-2019 ($)
Figure 95: APAC Fruit Water Market Value & Volume, 2019-2024 ($)
Figure 96: China Fruit Water Market Value & Volume, 2019-2024
Figure 97: China GDP and Population, 2018-2019 ($)
Figure 98: China GDP – Composition of 2018, By Sector of Origin
Figure 99: China Export and Import Value & Volume, 2018-2019 ($) Fruit Water Market China Export and Import Value & Volume, 2018-2019 ($)
Figure 100: Australia Fruit Water Market Value & Volume, 2019-2024 ($)
Figure 101: Australia GDP and PopulationUntitled Document, 2018-2019 ($)
Figure 102: Australia GDP – Composition of 2018, By Sector of Origin
Figure 103: Australia Export and Import Value & Volume, 2018-2019 ($)
Figure 104: South Korea Fruit Water Market Value & Volume, 2019-2024 ($)
Figure 105: South Korea GDP and Population, 2018-2019 ($)
Figure 106: South Korea GDP – Composition of 2018, By Sector of Origin
Figure 107: South Korea Export and Import Value & Volume, 2018-2019 ($)
Figure 108: India Fruit Water Market Value & Volume, 2019-2024 ($)
Figure 109: India GDP and Population, 2018-2019 ($)
Figure 110: India GDP – Composition of 2018, By Sector of Origin
Figure 111: India Export and Import Value & Volume, 2018-2019 ($)
Figure 112: Taiwan Fruit Water Market Value & Volume, 2019-2024 ($)
Figure 113: Taiwan GDP and Population, 2018-2019 ($)
Figure 114: Taiwan GDP – Composition of 2018, By Sector of Origin
Figure 115: Taiwan Export and Import Value & Volume, 2018-2019 ($)
Figure 116: Malaysia Fruit Water Market Value & Volume, 2019-2024 ($)
Figure 117: Malaysia GDP and Population, 2018-2019 ($)
Figure 118: Malaysia GDP – Composition of 2018, By Sector of Origin
Figure 119: Malaysia Export and Import Value & Volume, 2018-2019 ($)
Figure 120: Hong Kong Fruit Water Market Value & Volume, 2019-2024 ($)
Figure 121: Hong Kong GDP and Population, 2018-2019 ($)
Figure 122: Hong Kong GDP – Composition of 2018, By Sector of Origin
Figure 123: Hong Kong Export and Import Value & Volume, 2018-2019 ($)
Figure 124: Middle East & Africa Fruit Water Market Middle East & Africa 3D Printing Market Value & Volume, 2019-2024 ($)
Figure 125: Russia Fruit Water Market Value & Volume, 2019-2024 ($)
Figure 126: Russia GDP and Population, 2018-2019 ($)
Figure 127: Russia GDP – Composition of 2018, By Sector of Origin
Figure 128: Russia Export and Import Value & Volume, 2018-2019 ($)
Figure 129: Israel Fruit Water Market Value & Volume, 2019-2024 ($)
Figure 130: Israel GDP and Population, 2018-2019 ($)
Figure 131: Israel GDP – Composition of 2018, By Sector of Origin
Figure 132: Israel Export and Import Value & Volume, 2018-2019 ($)
Figure 133: Entropy Share, By Strategies, 2018-2019* (%) Fruit Water Market
Figure 134: Developments, 2018-2019* Fruit Water Market
Figure 135: Company 1 Fruit Water Market Net Revenue, By Years, 2018-2019* ($)
Figure 136: Company 1 Fruit Water Market Net Revenue Share, By Business segments, 2018 (%)
Figure 137: Company 1 Fruit Water Market Net Sales Share, By Geography, 2018 (%)
Figure 138: Company 2 Fruit Water Market Net Revenue, By Years, 2018-2019* ($)
Figure 139: Company 2 Fruit Water Market Net Revenue Share, By Business segments, 2018 (%)
Figure 140: Company 2 Fruit Water Market Net Sales Share, By Geography, 2018 (%)
Figure 141: Company 3 Fruit Water Market Net Revenue, By Years, 2018-2019* ($)
Figure 142: Company 3 Fruit Water Market Net Revenue Share, By Business segments, 2018 (%)
Figure 143: Company 3 Fruit Water Market Net Sales Share, By Geography, 2018 (%)
Figure 144: Company 4 Fruit Water Market Net Revenue, By Years, 2018-2019* ($)
Figure 145: Company 4 Fruit Water Market Net Revenue Share, By Business segments, 2018 (%)
Figure 146: Company 4 Fruit Water Market Net Sales Share, By Geography, 2018 (%)
Figure 147: Company 5 Fruit Water Market Net Revenue, By Years, 2018-2019* ($)
Figure 148: Company 5 Fruit Water Market Net Revenue Share, By Business segments, 2018 (%)
Figure 149: Company 5 Fruit Water Market Net Sales Share, By Geography, 2018 (%)
Figure 150: Company 6 Fruit Water Market Net Revenue, By Years, 2018-2019* ($)
Figure 151: Company 6 Fruit Water Market Net Revenue Share, By Business segments, 2018 (%)
Figure 152: Company 6 Fruit Water Market Net Sales Share, By Geography, 2018 (%)
Figure 153: Company 7 Fruit Water Market Net Revenue, By Years, 2018-2019* ($)
Figure 154: Company 7 Fruit Water Market Net Revenue Share, By Business segments, 2018 (%)
Figure 155: Company 7 Fruit Water Market Net Sales Share, By Geography, 2018 (%)
Figure 156: Company 8 Fruit Water Market Net Revenue, By Years, 2018-2019* ($)
Figure 157: Company 8 Fruit Water Market Net Revenue Share, By Business segments, 2018 (%)
Figure 158: Company 8 Fruit Water Market Net Sales Share, By Geography, 2018 (%)
Figure 159: Company 9 Fruit Water Market Net Revenue, By Years, 2018-2019* ($)
Figure 160: Company 9 Fruit Water Market Net Revenue Share, By Business segments, 2018 (%)
Figure 161: Company 9 Fruit Water Market Net Sales Share, By Geography, 2018 (%)
Figure 162: Company 10 Fruit Water Market Net Revenue, By Years, 2018-2019* ($)
Figure 163: Company 10 Fruit Water Market Net Revenue Share, By Business segments, 2018 (%)
Figure 164: Company 10 Fruit Water Market Net Sales Share, By Geography, 2018 (%)
Figure 165: Company 11 Fruit Water Market Net Revenue, By Years, 2018-2019* ($)
Figure 166: Company 11 Fruit Water Market Net Revenue Share, By Business segments, 2018 (%)
Figure 167: Company 11 Fruit Water Market Net Sales Share, By Geography, 2018 (%)
Figure 168: Company 12 Fruit Water Market Net Revenue, By Years, 2018-2019* ($)
Figure 169: Company 12 Fruit Water Market Net Revenue Share, By Business segments, 2018 (%)
Figure 170: Company 12 Fruit Water Market Net Sales Share, By Geography, 2018 (%)
Figure 171: Company 13 Fruit Water Market Net Revenue, By Years, 2018-2019* ($)
Figure 172: Company 13 Fruit Water Market Net Revenue Share, By Business segments, 2018 (%)
Figure 173: Company 13 Fruit Water Market Net Sales Share, By Geography, 2018 (%)
Figure 174: Company 14 Fruit Water Market Net Revenue, By Years, 2018-2019* ($)
Figure 175: Company 14 Fruit Water Market Net Revenue Share, By Business segments, 2018 (%)
Figure 176: Company 14 Fruit Water Market Net Sales Share, By Geography, 2018 (%)
Figure 177: Company 15 Fruit Water Market Net Revenue, By Years, 2018-2019* ($)
Figure 178: Company 15 Fruit Water Market Net Revenue Share, By Business segments, 2018 (%)
Figure 179: Company 15 Fruit Water Market Net Sales Share, By Geography, 2018 (%)