 Email
Email Print
Print


High-Throughput Screening Market - Forecast(2024 - 2030)
High Throughput Screening (HTS) can be defined as a drug-discovery process popular amongst pharmaceutical industry players. This process leverages automation to quickly assay the biological or biochemical activity of a large number of drug-like compounds and is useful for discovering ligands for receptors, enzymes, ion-channels or other pharmacological targets, or pharmacologically profiling a cellular or biochemical pathway of interest. Increasing investment in R&D activities and government initiatives is expected to remain key growth drivers for HTS during the period of study.
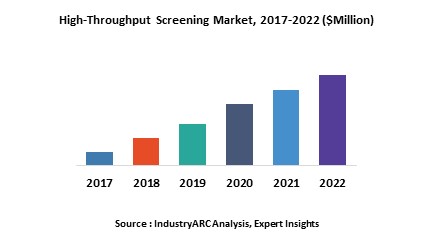
This report identifies the High-Throughput Screening Market size in for the year 2015-2017, and forecast of the same for year 2022. It also highlights the potential growth opportunities in the coming years, while also reviewing the market drivers, restraints, growth indicators, challenges, market dynamics, competitive landscape, and other key aspects with respect to High-Throughput Screening Market.
Geographically North America dominated the High-Throughput Screening Market owing to well developed & established healthcare industry, higher spending on R&D activities by large number of global pharmaceutical industry players. North America was followed by Europe and Asia-Pacific as the second and third largest markets for high-throughput screening. However, it is estimated that Asia-Pacific will remain as the fastest growing market for high-throughput screening during the period of study driven by infrastructural development in healthcare sector, growing medical tourism and expanding pharmaceutical industry in the emerging economies such as India, China and few others.
This report segments High-Throughput Screening Market on the basis of product & service, technology, application, end user, and regional market as follows:
- On the basis of product & service this report on High-Throughput Screening Market is segmented as follows, covering all major product & service type in the high-throughput screening as follows: Consumables & Reagents, Instruments, Software & Services
- This report on global high-throughput screening also covers in detail various applications of high-throughput screening, some of the major applications covered in the report are Target Identification, Primary Screening, Toxicology Assessment and Other Applications
- This report on global high-throughput screening also covers in detail major end users of high-throughput screening, some of the major end users covered in the report are Pharmaceutical and Biotechnology Companies, Academic and Government Research Institutes, Contract Research Organizations, and Other End Users
- This report on global high-throughput screening also covers in detail major technologies of high-throughput screening, some of the major technologies covered in the report are Cell-Based Assays, Lab-On-A-Chip, Ultra-High-Throughput Screening, Label-Free Technology and Bioinformatics
- This report on global high-throughput screening also covers in detail various applications of high-throughput screening, some of the major application covered in the report are Clinical documentation, E-Prescribing, Order entry (CPOE), Patient tracking, Resource tracking and management, Other applications
- This report on high-throughput screening has been further segmented into major regions, which includes detailed analysis of each region such as: North America, Europe, Asia-Pacific (APAC) and Rest of the World (RoW) covering all the major country level markets in each of the region
Sample Companies Profiled in this Report are:
- Agilent Technologies, Inc.
- Danaher Corporation
- Perkinelmer, Inc.
- Thermo Fisher Scientific Inc.
- Axxam S.P.A.
- 30+.
1. High-Throughput Screening Market - Overview
1.1. Definitions and Scope
2. High-Throughput Screening Market - Executive summary
2.1. Market Revenue, Market Size and Key Trends by Company
2.2. Key Trends by type of Application
2.3. Key Trends segmented by Geography
3. High-Throughput Screening Market
3.1. Comparative analysis
3.1.1. Product Benchmarking - Top 10 companies
3.1.2. Top 5 Financials Analysis
3.1.3. Market Value split by Top 10 companies
3.1.4. Patent Analysis - Top 10 companies
3.1.5. Pricing Analysis
4. High-Throughput Screening Market – Startup companies Scenario Premium
4.1. Top 10 startup company Analysis by
4.1.1. Investment
4.1.2. Revenue
4.1.3. Market Shares
4.1.4. Market Size and Application Analysis
4.1.5. Venture Capital and Funding Scenario
5. High-Throughput Screening Market – Industry Market Entry Scenario Premium
5.1. Regulatory Framework Overview
5.2. New Business and Ease of Doing business index
5.3. Case studies of successful ventures
5.4. Customer Analysis – Top 10 companies
6. High-Throughput Screening Market Forces
6.1. Drivers
6.2. Constraints
6.3. Challenges
6.4. Porters five force model
6.4.1. Bargaining power of suppliers
6.4.2. Bargaining powers of customers
6.4.3. Threat of new entrants
6.4.4. Rivalry among existing players
6.4.5. Threat of substitutes
7. High-Throughput Screening Market -Strategic analysis
7.1. Value chain analysis
7.2. Opportunities analysis
7.3. Product life cycle
7.4. Suppliers and distributors Market Share
8. High-Throughput Screening Market – By Product & Service (Market Size -$Million / $Billion)
8.1. Market Size and Market Share Analysis
8.2. Application Revenue and Trend Research
8.3. Product Segment Analysis
8.3.1. Instrument
8.3.2. Reagents & Consumables
8.3.3. Software & Service
9. High-Throughput Screening Market – By Technology (Market Size -$Million / $Billion)
9.1. Cell-Based Assays
9.1.1. 2D Cell Culture
9.1.2. 3D Cell Culture
9.1.3. Perfusion Cell Culture
9.2. Lab-On-A-Chip
9.3. Ultra-High-Throughput Screening
9.4. Label-Free Technology
9.5. Bioinformatics
10. High-Throughput Screening Market – By Application (Market Size -$Million / $Billion)
10.1. Target Identification
10.2. Primary Screening
10.3. Toxicology Assessment
10.4. Other Applications
11. High-Throughput Screening – By End Use Industry(Market Size -$Million / $Billion)
11.1. Segment type Size and Market Share Analysis
11.2. Application Revenue and Trends by type of Application
11.3. Application Segment Analysis by Type
11.3.1. Pharmaceutical and Biotechnology Companies
11.3.2. Academic and Government Research Institutes
11.3.3. Contract Research Organizations
11.3.4. Other End Users
12. High-Throughput Screening - By Geography (Market Size -$Million / $Billion)
12.1. High-Throughput Screening Market - North America Segment Research
12.2. North America Market Research (Million / $Billion)
12.2.1. Segment type Size and Market Size Analysis
12.2.2. Revenue and Trends
12.2.3. Application Revenue and Trends by type of Application
12.2.4. Company Revenue and Product Analysis
12.2.5. North America Product type and Application Market Size
12.2.5.1. U.S.
12.2.5.2. Canada
12.2.5.3. Mexico
12.2.5.4. Rest of North America
12.3. High-Throughput Screening - South America Segment Research
12.4. South America Market Research (Market Size -$Million / $Billion)
12.4.1. Segment type Size and Market Size Analysis
12.4.2. Revenue and Trends
12.4.3. Application Revenue and Trends by type of Application
12.4.4. Company Revenue and Product Analysis
12.4.5. South America Product type and Application Market Size
12.4.5.1. Brazil
12.4.5.2. Venezuela
12.4.5.3. Argentina
12.4.5.4. Ecuador
12.4.5.5. Peru
12.4.5.6. Colombia
12.4.5.7. Costa Rica
12.4.5.8. Rest of South America
12.5. High-Throughput Screening - Europe Segment Research
12.6. Europe Market Research (Market Size -$Million / $Billion)
12.6.1. Segment type Size and Market Size Analysis
12.6.2. Revenue and Trends
12.6.3. Application Revenue and Trends by type of Application
12.6.4. Company Revenue and Product Analysis
12.6.5. Europe Segment Product type and Application Market Size
12.6.5.1. U.K
12.6.5.2. Germany
12.6.5.3. Italy
12.6.5.4. France
12.6.5.5. Netherlands
12.6.5.6. Belgium
12.6.5.7. Spain
12.6.5.8. Denmark
12.6.5.9. Rest of Europe
12.7. High-Throughput Screening – APAC Segment Research
12.8. APAC Market Research (Market Size -$Million / $Billion)
12.8.1. Segment type Size and Market Size Analysis
12.8.2. Revenue and Trends
12.8.3. Application Revenue and Trends by type of Application
12.8.4. Company Revenue and Product Analysis
12.8.5. APAC Segment – Product type and Application Market Size
12.8.5.1. China
12.8.5.2. Australia
12.8.5.3. Japan
12.8.5.4. South Korea
12.8.5.5. India
12.8.5.6. Taiwan
12.8.5.7. Malaysia
13. High-Throughput Screening Market - Entropy
13.1. New product launches
13.2. M&A's, collaborations, JVs and partnerships
14. High-Throughput Screening Market – Industry / Segment Competition landscape Premium
14.1. Market Share Analysis
14.1.1. Market Share by Country- Top companies
14.1.2. Market Share by Region- Top 10 companies
14.1.3. Market Share by type of Application – Top 10 companies
14.1.4. Market Share by type of Product / Product category- Top 10 companies
14.1.5. Market Share at global level- Top 10 companies
14.1.6. Best Practises for companies
15. High-Throughput Screening Market – Key Company List by Country Premium
16. High-Throughput Screening Market Company Analysis
16.1. Market Share, Company Revenue, Products, M&A, Developments
16.2. Agilent Technologies, Inc
16.3. Danaher Corporation
16.4. Perkinelmer, Inc
16.5. Thermo Fisher Scientific Inc
16.6. Axxam S.P.A
16.7. Tecan Group Ltd
16.8. Bio-Rad Laboratories, Inc
16.9. Hamilton Company
16.10. Sigma-Aldrich Corporation (A Division of Merck Millipore)
16.11. Aurora Biomed, Inc
16.12. Company 11
16.13. Company 12
16.14. Company 13 and More
"*Financials would be provided on a best efforts basis for private companies"
17. High-Throughput Screening Market -Appendix
17.1. Abbreviations
17.2. Sources
18. High-Throughput Screening Market -Methodology Premium
18.1. Research Methodology
18.1.1. Company Expert Interviews
18.1.2. Industry Databases
18.1.3. Associations
18.1.4. Company News
18.1.5. Company Annual Reports
18.1.6. Application Trends
18.1.7. New Products and Product database
18.1.8. Company Transcripts
18.1.9. R&D Trends
18.1.10. Key Opinion Leaders Interviews
18.1.11. Supply and Demand Trends
List of Tables:
Table 1: High-Throughput Screening Market Overview 2019-2024
Table 2: High-Throughput Screening Market Leader Analysis 2018-2019 (US$)
Table 3: High-Throughput Screening Market Product Analysis 2018-2019 (US$)
Table 4: High-Throughput Screening Market End User Analysis 2018-2019 (US$)
Table 5: High-Throughput Screening Market Patent Analysis 2013-2018* (US$)
Table 6: High-Throughput Screening Market Financial Analysis 2018-2019 (US$)
Table 7: High-Throughput Screening Market Driver Analysis 2018-2019 (US$)
Table 8: High-Throughput Screening Market Challenges Analysis 2018-2019 (US$)
Table 9: High-Throughput Screening Market Constraint Analysis 2018-2019 (US$)
Table 10: High-Throughput Screening Market Supplier Bargaining Power Analysis 2018-2019 (US$)
Table 11: High-Throughput Screening Market Buyer Bargaining Power Analysis 2018-2019 (US$)
Table 12: High-Throughput Screening Market Threat of Substitutes Analysis 2018-2019 (US$)
Table 13: High-Throughput Screening Market Threat of New Entrants Analysis 2018-2019 (US$)
Table 14: High-Throughput Screening Market Degree of Competition Analysis 2018-2019 (US$)
Table 15: High-Throughput Screening Market Value Chain Analysis 2018-2019 (US$)
Table 16: High-Throughput Screening Market Pricing Analysis 2019-2024 (US$)
Table 17: High-Throughput Screening Market Opportunities Analysis 2019-2024 (US$)
Table 18: High-Throughput Screening Market Product Life Cycle Analysis 2019-2024 (US$)
Table 19: High-Throughput Screening Market Supplier Analysis 2018-2019 (US$)
Table 20: High-Throughput Screening Market Distributor Analysis 2018-2019 (US$)
Table 21: High-Throughput Screening Market Trend Analysis 2018-2019 (US$)
Table 22: High-Throughput Screening Market Size 2018 (US$)
Table 23: High-Throughput Screening Market Forecast Analysis 2019-2024 (US$)
Table 24: High-Throughput Screening Market Sales Forecast Analysis 2019-2024 (Units)
Table 25: High-Throughput Screening Market, Revenue & Volume,By Product & Service, 2019-2024 ($)
Table 26: High-Throughput Screening Market By Product & Service, Revenue & Volume,By Instrument, 2019-2024 ($)
Table 27: High-Throughput Screening Market By Product & Service, Revenue & Volume,By Reagents & Consumables, 2019-2024 ($)
Table 28: High-Throughput Screening Market By Product & Service, Revenue & Volume,By Software & Service, 2019-2024 ($)
Table 29: High-Throughput Screening Market, Revenue & Volume,By Technology, 2019-2024 ($)
Table 30: High-Throughput Screening Market By Technology, Revenue & Volume,By Cell-Based Assays, 2019-2024 ($)
Table 31: High-Throughput Screening Market By Technology, Revenue & Volume,By Lab-On-A-Chip, 2019-2024 ($)
Table 32: High-Throughput Screening Market By Technology, Revenue & Volume,By Ultra-High-Throughput Screening, 2019-2024 ($)
Table 33: High-Throughput Screening Market By Technology, Revenue & Volume,By Label-Free Technology, 2019-2024 ($)
Table 34: High-Throughput Screening Market By Technology, Revenue & Volume,By Bioinformatics, 2019-2024 ($)
Table 35: High-Throughput Screening Market, Revenue & Volume,By Application, 2019-2024 ($)
Table 36: High-Throughput Screening Market By Application, Revenue & Volume,By Target Identification, 2019-2024 ($)
Table 37: High-Throughput Screening Market By Application, Revenue & Volume,By Primary Screening, 2019-2024 ($)
Table 38: High-Throughput Screening Market By Application, Revenue & Volume,By Toxicology Assessment, 2019-2024 ($)
Table 39: High-Throughput Screening Market By Application, Revenue & Volume,By Other Applications, 2019-2024 ($)
Table 40: High-Throughput Screening Market, Revenue & Volume,By End Use, 2019-2024 ($)
Table 41: High-Throughput Screening Market By End Use, Revenue & Volume,By Pharmaceutical and Biotechnology Companies, 2019-2024 ($)
Table 42: High-Throughput Screening Market By End Use, Revenue & Volume,By Academic and Government Research Institutes, 2019-2024 ($)
Table 43: High-Throughput Screening Market By End Use, Revenue & Volume,By Contract Research Organizations, 2019-2024 ($)
Table 44: High-Throughput Screening Market By End Use, Revenue & Volume,By Other End Users, 2019-2024 ($)
Table 45: North America High-Throughput Screening Market, Revenue & Volume,By Product & Service, 2019-2024 ($)
Table 46: North America High-Throughput Screening Market, Revenue & Volume,By Technology, 2019-2024 ($)
Table 47: North America High-Throughput Screening Market, Revenue & Volume,By Application, 2019-2024 ($)
Table 48: North America High-Throughput Screening Market, Revenue & Volume,By End Use, 2019-2024 ($)
Table 49: South america High-Throughput Screening Market, Revenue & Volume,By Product & Service, 2019-2024 ($)
Table 50: South america High-Throughput Screening Market, Revenue & Volume,By Technology, 2019-2024 ($)
Table 51: South america High-Throughput Screening Market, Revenue & Volume,By Application, 2019-2024 ($)
Table 52: South america High-Throughput Screening Market, Revenue & Volume,By End Use, 2019-2024 ($)
Table 53: Europe High-Throughput Screening Market, Revenue & Volume,By Product & Service, 2019-2024 ($)
Table 54: Europe High-Throughput Screening Market, Revenue & Volume,By Technology, 2019-2024 ($)
Table 55: Europe High-Throughput Screening Market, Revenue & Volume,By Application, 2019-2024 ($)
Table 56: Europe High-Throughput Screening Market, Revenue & Volume,By End Use, 2019-2024 ($)
Table 57: APAC High-Throughput Screening Market, Revenue & Volume,By Product & Service, 2019-2024 ($)
Table 58: APAC High-Throughput Screening Market, Revenue & Volume,By Technology, 2019-2024 ($)
Table 59: APAC High-Throughput Screening Market, Revenue & Volume,By Application, 2019-2024 ($)
Table 60: APAC High-Throughput Screening Market, Revenue & Volume,By End Use, 2019-2024 ($)
Table 61: Middle East & Africa High-Throughput Screening Market, Revenue & Volume,By Product & Service, 2019-2024 ($)
Table 62: Middle East & Africa High-Throughput Screening Market, Revenue & Volume,By Technology, 2019-2024 ($)
Table 63: Middle East & Africa High-Throughput Screening Market, Revenue & Volume,By Application, 2019-2024 ($)
Table 64: Middle East & Africa High-Throughput Screening Market, Revenue & Volume,By End Use, 2019-2024 ($)
Table 65: Russia High-Throughput Screening Market, Revenue & Volume,By Product & Service, 2019-2024 ($)
Table 66: Russia High-Throughput Screening Market, Revenue & Volume,By Technology, 2019-2024 ($)
Table 67: Russia High-Throughput Screening Market, Revenue & Volume,By Application, 2019-2024 ($)
Table 68: Russia High-Throughput Screening Market, Revenue & Volume,By End Use, 2019-2024 ($)
Table 69: Israel High-Throughput Screening Market, Revenue & Volume,By Product & Service, 2019-2024 ($)
Table 70: Israel High-Throughput Screening Market, Revenue & Volume,By Technology, 2019-2024 ($)
Table 71: Israel High-Throughput Screening Market, Revenue & Volume,By Application, 2019-2024 ($)
Table 72: Israel High-Throughput Screening Market, Revenue & Volume,By End Use, 2019-2024 ($)
Table 73: Top Companies 2018 (US$)High-Throughput Screening Market, Revenue & Volume
Table 74: Product Launch 2018-2019 High-Throughput Screening Market, Revenue & Volume
Table 75: Mergers & Acquistions 2018-2019 High-Throughput Screening Market, Revenue & Volume
List of Figures:
Figure 1: Overview of High-Throughput Screening Market 2019-2024
Figure 2: Market Share Analysis for High-Throughput Screening Market 2018 (US$)
Figure 3: Product Comparison in High-Throughput Screening Market 2018-2019 (US$)
Figure 4: End User Profile for High-Throughput Screening Market 2018-2019 (US$)
Figure 5: Patent Application and Grant in High-Throughput Screening Market 2013-2018* (US$)
Figure 6: Top 5 Companies Financial Analysis in High-Throughput Screening Market 2018-2019 (US$)
Figure 7: Market Entry Strategy in High-Throughput Screening Market 2018-2019
Figure 8: Ecosystem Analysis in High-Throughput Screening Market 2018
Figure 9: Average Selling Price in High-Throughput Screening Market 2019-2024
Figure 10: Top Opportunites in High-Throughput Screening Market 2018-2019
Figure 11: Market Life Cycle Analysis in High-Throughput Screening Market Market Life Cycle Analysis in 3D Printing
Figure 12: GlobalBy Product & ServiceHigh-Throughput Screening Market Revenue, 2019-2024 ($)
Figure 13: GlobalBy TechnologyHigh-Throughput Screening Market Revenue, 2019-2024 ($)
Figure 14: GlobalBy ApplicationHigh-Throughput Screening Market Revenue, 2019-2024 ($)
Figure 15: GlobalBy End UseHigh-Throughput Screening Market Revenue, 2019-2024 ($)
Figure 16: Global High-Throughput Screening Market - By Geography
Figure 17: Global High-Throughput Screening Market Value & Volume, By Geography, 2019-2024 ($)
Figure 18: Global High-Throughput Screening Market CAGR, By Geography, 2019-2024 (%)
Figure 19: North America High-Throughput Screening Market Value & Volume, 2019-2024 ($)
Figure 20: US High-Throughput Screening Market Value & Volume, 2019-2024 ($)
Figure 21: US GDP and Population, 2018-2019 ($)
Figure 22: US GDP – Composition of 2018, By Sector of Origin
Figure 23: US Export and Import Value & Volume, 2018-2019 ($)
Figure 24: Canada High-Throughput Screening Market Value & Volume, 2019-2024 ($)
Figure 25: Canada GDP and Population, 2018-2019 ($)
Figure 26: Canada GDP – Composition of 2018, By Sector of Origin
Figure 27: Canada Export and Import Value & Volume, 2018-2019 ($)
Figure 28: Mexico High-Throughput Screening Market Value & Volume, 2019-2024 ($)
Figure 29: Mexico GDP and Population, 2018-2019 ($)
Figure 30: Mexico GDP – Composition of 2018, By Sector of Origin
Figure 31: Mexico Export and Import Value & Volume, 2018-2019 ($)
Figure 32: South America High-Throughput Screening Market South America 3D Printing Market Value & Volume, 2019-2024 ($)
Figure 33: Brazil High-Throughput Screening Market Value & Volume, 2019-2024 ($)
Figure 34: Brazil GDP and Population, 2018-2019 ($)
Figure 35: Brazil GDP – Composition of 2018, By Sector of Origin
Figure 36: Brazil Export and Import Value & Volume, 2018-2019 ($)
Figure 37: Venezuela High-Throughput Screening Market Value & Volume, 2019-2024 ($)
Figure 38: Venezuela GDP and Population, 2018-2019 ($)
Figure 39: Venezuela GDP – Composition of 2018, By Sector of Origin
Figure 40: Venezuela Export and Import Value & Volume, 2018-2019 ($)
Figure 41: Argentina High-Throughput Screening Market Value & Volume, 2019-2024 ($)
Figure 42: Argentina GDP and Population, 2018-2019 ($)
Figure 43: Argentina GDP – Composition of 2018, By Sector of Origin
Figure 44: Argentina Export and Import Value & Volume, 2018-2019 ($)
Figure 45: Ecuador High-Throughput Screening Market Value & Volume, 2019-2024 ($)
Figure 46: Ecuador GDP and Population, 2018-2019 ($)
Figure 47: Ecuador GDP – Composition of 2018, By Sector of Origin
Figure 48: Ecuador Export and Import Value & Volume, 2018-2019 ($)
Figure 49: Peru High-Throughput Screening Market Value & Volume, 2019-2024 ($)
Figure 50: Peru GDP and Population, 2018-2019 ($)
Figure 51: Peru GDP – Composition of 2018, By Sector of Origin
Figure 52: Peru Export and Import Value & Volume, 2018-2019 ($)
Figure 53: Colombia High-Throughput Screening Market Value & Volume, 2019-2024 ($)
Figure 54: Colombia GDP and Population, 2018-2019 ($)
Figure 55: Colombia GDP – Composition of 2018, By Sector of Origin
Figure 56: Colombia Export and Import Value & Volume, 2018-2019 ($)
Figure 57: Costa Rica High-Throughput Screening Market Costa Rica 3D Printing Market Value & Volume, 2019-2024 ($)
Figure 58: Costa Rica GDP and Population, 2018-2019 ($)
Figure 59: Costa Rica GDP – Composition of 2018, By Sector of Origin
Figure 60: Costa Rica Export and Import Value & Volume, 2018-2019 ($)
Figure 61: Europe High-Throughput Screening Market Value & Volume, 2019-2024 ($)
Figure 62: U.K High-Throughput Screening Market Value & Volume, 2019-2024 ($)
Figure 63: U.K GDP and Population, 2018-2019 ($)
Figure 64: U.K GDP – Composition of 2018, By Sector of Origin
Figure 65: U.K Export and Import Value & Volume, 2018-2019 ($)
Figure 66: Germany High-Throughput Screening Market Value & Volume, 2019-2024 ($)
Figure 67: Germany GDP and Population, 2018-2019 ($)
Figure 68: Germany GDP – Composition of 2018, By Sector of Origin
Figure 69: Germany Export and Import Value & Volume, 2018-2019 ($)
Figure 70: Italy High-Throughput Screening Market Value & Volume, 2019-2024 ($)
Figure 71: Italy GDP and Population, 2018-2019 ($)
Figure 72: Italy GDP – Composition of 2018, By Sector of Origin
Figure 73: Italy Export and Import Value & Volume, 2018-2019 ($)
Figure 74: France High-Throughput Screening Market Value & Volume, 2019-2024 ($)
Figure 75: France GDP and Population, 2018-2019 ($)
Figure 76: France GDP – Composition of 2018, By Sector of Origin
Figure 77: France Export and Import Value & Volume, 2018-2019 ($)
Figure 78: Netherlands High-Throughput Screening Market Value & Volume, 2019-2024 ($)
Figure 79: Netherlands GDP and Population, 2018-2019 ($)
Figure 80: Netherlands GDP – Composition of 2018, By Sector of Origin
Figure 81: Netherlands Export and Import Value & Volume, 2018-2019 ($)
Figure 82: Belgium High-Throughput Screening Market Value & Volume, 2019-2024 ($)
Figure 83: Belgium GDP and Population, 2018-2019 ($)
Figure 84: Belgium GDP – Composition of 2018, By Sector of Origin
Figure 85: Belgium Export and Import Value & Volume, 2018-2019 ($)
Figure 86: Spain High-Throughput Screening Market Value & Volume, 2019-2024 ($)
Figure 87: Spain GDP and Population, 2018-2019 ($)
Figure 88: Spain GDP – Composition of 2018, By Sector of Origin
Figure 89: Spain Export and Import Value & Volume, 2018-2019 ($)
Figure 90: Denmark High-Throughput Screening Market Value & Volume, 2019-2024 ($)
Figure 91: Denmark GDP and Population, 2018-2019 ($)
Figure 92: Denmark GDP – Composition of 2018, By Sector of Origin
Figure 93: Denmark Export and Import Value & Volume, 2018-2019 ($)
Figure 94: APAC High-Throughput Screening Market Value & Volume, 2019-2024 ($)
Figure 95: China High-Throughput Screening Market Value & Volume, 2019-2024
Figure 96: China GDP and Population, 2018-2019 ($)
Figure 97: China GDP – Composition of 2018, By Sector of Origin
Figure 98: China Export and Import Value & Volume, 2018-2019 ($)High-Throughput Screening Market China Export and Import Value & Volume, 2018-2019 ($)
Figure 99: Australia High-Throughput Screening Market Value & Volume, 2019-2024 ($)
Figure 100: Australia GDP and Population, 2018-2019 ($)
Figure 101: Australia GDP – Composition of 2018, By Sector of Origin
Figure 102: Australia Export and Import Value & Volume, 2018-2019 ($)
Figure 103: South Korea High-Throughput Screening Market Value & Volume, 2019-2024 ($)
Figure 104: South Korea GDP and Population, 2018-2019 ($)
Figure 105: South Korea GDP – Composition of 2018, By Sector of Origin
Figure 106: South Korea Export and Import Value & Volume, 2018-2019 ($)
Figure 107: India High-Throughput Screening Market Value & Volume, 2019-2024 ($)
Figure 108: India GDP and Population, 2018-2019 ($)
Figure 109: India GDP – Composition of 2018, By Sector of Origin
Figure 110: India Export and Import Value & Volume, 2018-2019 ($)
Figure 111: Taiwan High-Throughput Screening Market Taiwan 3D Printing Market Value & Volume, 2019-2024 ($)
Figure 112: Taiwan GDP and Population, 2018-2019 ($)
Figure 113: Taiwan GDP – Composition of 2018, By Sector of Origin
Figure 114: Taiwan Export and Import Value & Volume, 2018-2019 ($)
Figure 115: Malaysia High-Throughput Screening Market Malaysia 3D Printing Market Value & Volume, 2019-2024 ($)
Figure 116: Malaysia GDP and Population, 2018-2019 ($)
Figure 117: Malaysia GDP – Composition of 2018, By Sector of Origin
Figure 118: Malaysia Export and Import Value & Volume, 2018-2019 ($)
Figure 119: Hong Kong High-Throughput Screening Market Hong Kong 3D Printing Market Value & Volume, 2019-2024 ($)
Figure 120: Hong Kong GDP and Population, 2018-2019 ($)
Figure 121: Hong Kong GDP – Composition of 2018, By Sector of Origin
Figure 122: Hong Kong Export and Import Value & Volume, 2018-2019 ($)
Figure 123: Middle East & Africa High-Throughput Screening Market Middle East & Africa 3D Printing Market Value & Volume, 2019-2024 ($)
Figure 124: Russia High-Throughput Screening Market Russia 3D Printing Market Value & Volume, 2019-2024 ($)
Figure 125: Russia GDP and Population, 2018-2019 ($)
Figure 126: Russia GDP – Composition of 2018, By Sector of Origin
Figure 127: Russia Export and Import Value & Volume, 2018-2019 ($)
Figure 128: Israel High-Throughput Screening Market Value & Volume, 2019-2024 ($)
Figure 129: Israel GDP and Population, 2018-2019 ($)
Figure 130: Israel GDP – Composition of 2018, By Sector of Origin
Figure 131: Israel Export and Import Value & Volume, 2018-2019 ($)
Figure 132: Entropy Share, By Strategies, 2018-2019* (%)High-Throughput Screening Market
Figure 133: Developments, 2018-2019*High-Throughput Screening Market
Figure 134: Company 1 High-Throughput Screening Market Net Revenue, By Years, 2018-2019* ($)
Figure 135: Company 1 High-Throughput Screening Market Net Revenue Share, By Business segments, 2018 (%)
Figure 136: Company 1 High-Throughput Screening Market Net Sales Share, By Geography, 2018 (%)
Figure 137: Company 2 High-Throughput Screening Market Net Revenue, By Years, 2018-2019* ($)
Figure 138: Company 2 High-Throughput Screening Market Net Revenue Share, By Business segments, 2018 (%)
Figure 139: Company 2 High-Throughput Screening Market Net Sales Share, By Geography, 2018 (%)
Figure 140: Company 3 High-Throughput Screening Market Net Revenue, By Years, 2018-2019* ($)
Figure 141: Company 3 High-Throughput Screening Market Net Revenue Share, By Business segments, 2018 (%)
Figure 142: Company 3 High-Throughput Screening Market Net Sales Share, By Geography, 2018 (%)
Figure 143: Company 4 High-Throughput Screening Market Net Revenue, By Years, 2018-2019* ($)
Figure 144: Company 4 High-Throughput Screening Market Net Revenue Share, By Business segments, 2018 (%)
Figure 145: Company 4 High-Throughput Screening Market Net Sales Share, By Geography, 2018 (%)
Figure 146: Company 5 High-Throughput Screening Market Net Revenue, By Years, 2018-2019* ($)
Figure 147: Company 5 High-Throughput Screening Market Net Revenue Share, By Business segments, 2018 (%)
Figure 148: Company 5 High-Throughput Screening Market Net Sales Share, By Geography, 2018 (%)
Figure 149: Company 6 High-Throughput Screening Market Net Revenue, By Years, 2018-2019* ($)
Figure 150: Company 6 High-Throughput Screening Market Net Revenue Share, By Business segments, 2018 (%)
Figure 151: Company 6 High-Throughput Screening Market Net Sales Share, By Geography, 2018 (%)
Figure 152: Company 7 High-Throughput Screening Market Net Revenue, By Years, 2018-2019* ($)
Figure 153: Company 7 High-Throughput Screening Market Net Revenue Share, By Business segments, 2018 (%)
Figure 154: Company 7 High-Throughput Screening Market Net Sales Share, By Geography, 2018 (%)
Figure 155: Company 8 High-Throughput Screening Market Net Revenue, By Years, 2018-2019* ($)
Figure 156: Company 8 High-Throughput Screening Market Net Revenue Share, By Business segments, 2018 (%)
Figure 157: Company 8 High-Throughput Screening Market Net Sales Share, By Geography, 2018 (%)
Figure 158: Company 9 High-Throughput Screening Market Net Revenue, By Years, 2018-2019* ($)
Figure 159: Company 9 High-Throughput Screening Market Net Revenue Share, By Business segments, 2018 (%)
Figure 160: Company 9 High-Throughput Screening Market Net Sales Share, By Geography, 2018 (%)
Figure 161: Company 10 High-Throughput Screening Market Net Revenue, By Years, 2018-2019* ($)
Figure 162: Company 10 High-Throughput Screening Market Net Revenue Share, By Business segments, 2018 (%)
Figure 163: Company 10 High-Throughput Screening Market Net Sales Share, By Geography, 2018 (%)
Figure 164: Company 11 High-Throughput Screening Market Net Revenue, By Years, 2018-2019* ($)
Figure 165: Company 11 High-Throughput Screening Market Net Revenue Share, By Business segments, 2018 (%)
Figure 166: Company 11 High-Throughput Screening Market Net Sales Share, By Geography, 2018 (%)
Figure 167: Company 12 High-Throughput Screening Market Net Revenue, By Years, 2018-2019* ($)
Figure 168: Company 12 High-Throughput Screening Market Net Revenue Share, By Business segments, 2018 (%)
Figure 169: Company 12 High-Throughput Screening Market Net Sales Share, By Geography, 2018 (%)
Figure 170: Company 13 High-Throughput Screening Market Net Revenue, By Years, 2018-2019* ($)
Figure 171: Company 13 High-Throughput Screening Market Net Revenue Share, By Business segments, 2018 (%)
Figure 172: Company 13 High-Throughput Screening Market Net Sales Share, By Geography, 2018 (%)
Figure 173: Company 14 High-Throughput Screening Market Net Revenue, By Years, 2018-2019* ($)
Figure 174: Company 14 High-Throughput Screening Market Net Revenue Share, By Business segments, 2018 (%)
Figure 175: Company 14 High-Throughput Screening Market Net Sales Share, By Geography, 2018 (%)
Figure 176: Company 15 High-Throughput Screening Market Net Revenue, By Years, 2018-2019* ($)
Figure 177: Company 15 High-Throughput Screening Market Net Revenue Share, By Business segments, 2018 (%)
Figure 178: Company 15 High-Throughput Screening Market Net Sales Share, By Geography, 2018 (%)