 Email
Email Print
Print


Total Ankle Replacement Market - Forecast(2024 - 2030)
Total ankle replacement is a surgical process for replacing damaged bones in the ankle joint with an artificial metallic or metal on ceramic implant made of titanium alloy. It is performed by placing a plastic or metal implant on top of the ankle bone (talus) and at the end of the shin bone (tibia). Globally, development of efficient and advanced technology, rise in the awareness among people, increasing government initiatives across the globe and growing aging population are the prime growth drivers of the total ankle replacement market. In addition, an increase in adoption of total ankle replacement in emerging economies such as China, India and others, will create new opportunities for the total ankle replacement market. However, the risk of continued pain, mal-alignment, & arthritis development in the adjacent joints; and higher cost of the research and development are the key restraints for the total ankle replacement market.
Geographically, Europe dominated the total ankle replacement market, with approximately half of the world’s procedures being done in the Europe because of high medical reimbursement facilities, and technological advancement. Asia Pacific is projected to have the fastest growth, owing to a rapidly increasing population, rise in consumer awareness, favourable government policies, modernization of healthcare infrastructure, and growing medical tourism industry in developing nations such as China, and India in this region. Among all the designs, agility ankle prosthesis has the highest market share in the total ankle replacement market due to a higher prevalence of cancer patients.
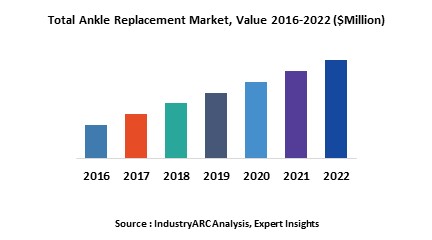
This report identifies the total ankle replacement market size for the years 2014-2016, and forecast of the same till the year 2022. It also highlights the market drivers, restraints, growth indicators, challenges, and other key aspects with respect to the total ankle replacement market.
This report segments the total ankle replacement market on the basis of design, and regional market as follows:
This report identifies all the major companies operating in the total ankle replacement market. Some of the major companies’ profiles in detail are as follows:
Geographically, Europe dominated the total ankle replacement market, with approximately half of the world’s procedures being done in the Europe because of high medical reimbursement facilities, and technological advancement. Asia Pacific is projected to have the fastest growth, owing to a rapidly increasing population, rise in consumer awareness, favourable government policies, modernization of healthcare infrastructure, and growing medical tourism industry in developing nations such as China, and India in this region. Among all the designs, agility ankle prosthesis has the highest market share in the total ankle replacement market due to a higher prevalence of cancer patients.
This report identifies the total ankle replacement market size for the years 2014-2016, and forecast of the same till the year 2022. It also highlights the market drivers, restraints, growth indicators, challenges, and other key aspects with respect to the total ankle replacement market.
This report segments the total ankle replacement market on the basis of design, and regional market as follows:
- The report has focused study on total ankle replacement market by basis of design such as: Agility Ankle Prosthesis, Buechel-Pappas Ankle Prosthesis, Scandinavian Total Ankle Replacement (STAR), Salto Total Ankle Replacement, HINTEGRA Total Ankle Replacement, Mobility Ankle System, TNK Total Ankle Replacement, Ramses Total Ankle Replacement, AES Total Ankle Replacement, BOX Total Ankle Replacement, ESKA Ankle Prosthesis, German Ankle System, Alphanorm Total Ankle Replacement, TARIC Total Ankle Replacement, and INBONE Total Ankle Replacement
- This report has been further segmented into major regions, which includes detailed analysis of each region such as: North America, Europe, Asia-Pacific (APAC), and Rest of the World (RoW) covering all the major country level markets in each of the region
This report identifies all the major companies operating in the total ankle replacement market. Some of the major companies’ profiles in detail are as follows:
- Small Bone Innovation, Inc.
- DePuy Synthes
- Zimmer Holdings, Inc.
- KYOCERA Medical Corporation
- Wright Medical Group
1. Total Ankle Replacement Market - Overview
1.1. Definitions and Scope
2. Total Ankle Replacement Market - Executive summary
2.1. Market Revenue, Market Size and Key Trends by Company
2.2. Key Trends by type of Application
2.3. Key Trends segmented by Geography
3. Total Ankle Replacement Market
3.1. Comparative analysis
3.1.1. Product Benchmarking - Top 10 companies
3.1.2. Top 5 Financials Analysis
3.1.3. Market Value split by Top 10 companies
3.1.4. Patent Analysis - Top 10 companies
3.1.5. Pricing Analysis
4. Total Ankle Replacement Market – Startup companies Scenario Premium
4.1. Top 10 startup company Analysis by
4.1.1. Investment
4.1.2. Revenue
4.1.3. Market Shares
4.1.4. Market Size and Application Analysis
4.1.5. Venture Capital and Funding Scenario
5. Total Ankle Replacement Market – Industry Market Entry Scenario Premium
5.1. Regulatory Framework Overview
5.2. New Business and Ease of Doing business index
5.3. Case studies of successful ventures
5.4. Customer Analysis – Top 10 companies
6. Total Ankle Replacement Market Forces
6.1. Drivers
6.2. Constraints
6.3. Challenges
6.4. Porters five force model
6.4.1. Bargaining power of suppliers
6.4.2. Bargaining powers of customers
6.4.3. Threat of new entrants
6.4.4. Rivalry among existing players
6.4.5. Threat of substitutes
7. Total Ankle Replacement Market -Strategic analysis
7.1. Value chain analysis
7.2. Opportunities analysis
7.3. Product life cycle
7.4. Suppliers and distributors Market Share
8. Total Ankle Replacement Market – By Design (Market Size -$Million / $Billion)
8.1. Market Size and Market Share Analysis
8.2. Application Revenue and Trend Research
8.3. Product Segment Analysis
8.3.1. Agility Ankle Prosthesis
8.3.2. Buechel-Pappas Ankle Prosthesis
8.3.3. Scandinavian Total Ankle Replacement (STAR)
8.3.4. Salto Total Ankle Replacement
8.3.5. HINTEGRA Total Ankle Replacement
8.3.6. Mobility Ankle System
8.3.7. TNK Total Ankle Replacement
8.3.8. Ramses Total Ankle Replacement
8.3.9. AES Total Ankle Replacement
8.3.10. BOX Total Ankle Replacement
8.3.11. ESKA Ankle Prosthesis
8.3.12. German Ankle System
8.3.13. Alphanorm Total Ankle Replacement
8.3.14. TARIC Total Ankle Replacement
8.3.15. INBONE Total Ankle Replacement
9. Total Ankle Replacement - By Geography (Market Size -$Million / $Billion)
9.1. Total Ankle Replacement Market - North America Segment Research
9.2. North America Market Research (Million / $Billion)
9.2.1. Segment type Size and Market Size Analysis
9.2.2. Revenue and Trends
9.2.3. Application Revenue and Trends by type of Application
9.2.4. Company Revenue and Product Analysis
9.2.5. North America Product type and Application Market Size
9.2.5.1. U.S.
9.2.5.2. Canada
9.2.5.3. Mexico
9.2.5.4. Rest of North America
9.3. Total Ankle Replacement - South America Segment Research
9.4. South America Market Research (Market Size -$Million / $Billion)
9.4.1. Segment type Size and Market Size Analysis
9.4.2. Revenue and Trends
9.4.3. Application Revenue and Trends by type of Application
9.4.4. Company Revenue and Product Analysis
9.4.5. South America Product type and Application Market Size
9.4.5.1. Brazil
9.4.5.2. Venezuela
9.4.5.3. Argentina
9.4.5.4. Ecuador
9.4.5.5. Peru
9.4.5.6. Colombia
9.4.5.7. Costa Rica
9.4.5.8. Rest of South America
9.5. Total Ankle Replacement - Europe Segment Research
9.6. Europe Market Research (Market Size -$Million / $Billion)
9.6.1. Segment type Size and Market Size Analysis
9.6.2. Revenue and Trends
9.6.3. Application Revenue and Trends by type of Application
9.6.4. Company Revenue and Product Analysis
9.6.5. Europe Segment Product type and Application Market Size
9.6.5.1. U.K
9.6.5.2. Germany
9.6.5.3. Italy
9.6.5.4. France
9.6.5.5. Netherlands
9.6.5.6. Belgium
9.6.5.7. Spain
9.6.5.8. Denmark
9.6.5.9. Rest of Europe
9.7. Total Ankle Replacement – APAC Segment Research
9.8. APAC Market Research (Market Size -$Million / $Billion)
9.8.1. Segment type Size and Market Size Analysis
9.8.2. Revenue and Trends
9.8.3. Application Revenue and Trends by type of Application
9.8.4. Company Revenue and Product Analysis
9.8.5. APAC Segment – Product type and Application Market Size
9.8.5.1. China
9.8.5.2. Australia
9.8.5.3. Japan
9.8.5.4. South Korea
9.8.5.5. India
9.8.5.6. Taiwan
9.8.5.7. Malaysia
10. Total Ankle Replacement Market - Entropy
10.1. New product launches
10.2. M&A's, collaborations, JVs and partnerships
11. Total Ankle Replacement Market – Industry / Segment Competition landscape Premium
11.1. Market Share Analysis
11.1.1. Market Share by Country- Top companies
11.1.2. Market Share by Region- Top 10 companies
11.1.3. Market Share by type of Application – Top 10 companies
11.1.4. Market Share by type of Product / Product category- Top 10 companies
11.1.5. Market Share at global level- Top 10 companies
11.1.6. Best Practises for companies
12. Total Ankle Replacement Market – Key Company List by Country Premium
13. Total Ankle Replacement Market Company Analysis
13.1. Market Share, Company Revenue, Products, M&A, Developments
13.2. Small Bone Innovation, Inc.
13.3. DePuy Synthes
13.4. Zimmer Holdings, Inc.
13.5. KYOCERA Medical Corporation
13.6. Wright Medical Group
13.7. Stryker
13.8. Smith and Nephew
13.9. Exactech Inc.
13.10. Tornier
13.11. Biomet Inc.
13.12. Company 11
13.13. Company 12
13.14. Company 13 and more
"*Financials would be provided on a best efforts basis for private companies"
14. Total Ankle Replacement Market -Appendix
14.1. Abbreviations
14.2. Sources
15. Total Ankle Replacement Market -Methodology Premium
15.1. Research Methodology
15.1.1. Company Expert Interviews
15.1.2. Industry Databases
15.1.3. Associations
15.1.4. Company News
15.1.5. Company Annual Reports
15.1.6. Application Trends
15.1.7. New Products and Product database
15.1.8. Company Transcripts
15.1.9. R&D Trends
15.1.10. Key Opinion Leaders Interviews
15.1.11. Supply and Demand Trends
List of Tables:
Table 1: Total Ankle Replacement Market Overview 2019-2024
Table 2: Total Ankle Replacement Market Leader Analysis 2018-2019 (US$)
Table 3: Total Ankle Replacement Market Product Analysis 2018-2019 (US$)
Table 4: Total Ankle Replacement Market End User Analysis 2018-2019 (US$)
Table 5: Total Ankle Replacement Market Patent Analysis 2013-2018* (US$)
Table 6: Total Ankle Replacement Market Financial Analysis 2018-2019 (US$)
Table 7: Total Ankle Replacement Market Driver Analysis 2018-2019 (US$)
Table 8: Total Ankle Replacement Market Challenges Analysis 2018-2019 (US$)
Table 9: Total Ankle Replacement Market Constraint Analysis 2018-2019 (US$)
Table 10: Total Ankle Replacement Market Supplier Bargaining Power Analysis 2018-2019 (US$)
Table 11: Total Ankle Replacement Market Buyer Bargaining Power Analysis 2018-2019 (US$)
Table 12: Total Ankle Replacement Market Threat of Substitutes Analysis 2018-2019 (US$)
Table 13: Total Ankle Replacement Market Threat of New Entrants Analysis 2018-2019 (US$)
Table 14: Total Ankle Replacement Market Degree of Competition Analysis 2018-2019 (US$)
Table 15: Total Ankle Replacement Market Value Chain Analysis 2018-2019 (US$)
Table 16: Total Ankle Replacement Market Pricing Analysis 2019-2024 (US$)
Table 17: Total Ankle Replacement Market Opportunities Analysis 2019-2024 (US$)
Table 18: Total Ankle Replacement Market Product Life Cycle Analysis 2019-2024 (US$)
Table 19: Total Ankle Replacement Market Supplier Analysis 2018-2019 (US$)
Table 20: Total Ankle Replacement Market Distributor Analysis 2018-2019 (US$)
Table 21: Total Ankle Replacement Market Trend Analysis 2018-2019 (US$)
Table 22: Total Ankle Replacement Market Size 2018 (US$)
Table 23: Total Ankle Replacement Market Forecast Analysis 2019-2024 (US$)
Table 24: Total Ankle Replacement Market Sales Forecast Analysis 2019-2024 (Units)
Table 25: Total Ankle Replacement Market, Revenue & Volume,By Design, 2019-2024 ($)
Table 26: Total Ankle Replacement MarketBy Design, Revenue & Volume,By Agility Ankle Prosthesis, 2019-2024 ($)
Table 27: Total Ankle Replacement MarketBy Design, Revenue & Volume,By Buechel-Pappas Ankle Prosthesis, 2019-2024 ($)
Table 28: Total Ankle Replacement MarketBy Design, Revenue & Volume,By Scandinavian Total Ankle Replacement (STAR), 2019-2024 ($)
Table 29: Total Ankle Replacement MarketBy Design, Revenue & Volume,By Salto Total Ankle Replacement, 2019-2024 ($)
Table 30: Total Ankle Replacement MarketBy Design, Revenue & Volume,By HINTEGRA Total Ankle Replacement, 2019-2024 ($)
Table 31: North America Total Ankle Replacement Market, Revenue & Volume,By Design, 2019-2024 ($)
Table 32: South america Total Ankle Replacement Market, Revenue & Volume,By Design, 2019-2024 ($)
Table 33: Europe Total Ankle Replacement Market, Revenue & Volume,By Design, 2019-2024 ($)
Table 34: APAC Total Ankle Replacement Market, Revenue & Volume,By Design, 2019-2024 ($)
Table 35: Middle East & Africa Total Ankle Replacement Market, Revenue & Volume,By Design, 2019-2024 ($)
Table 36: Russia Total Ankle Replacement Market, Revenue & Volume,By Design, 2019-2024 ($)
Table 37: Israel Total Ankle Replacement Market, Revenue & Volume,By Design, 2019-2024 ($)
Table 38: Top Companies 2018 (US$)Total Ankle Replacement Market, Revenue & Volume
Table 39: Product Launch 2018-2019Total Ankle Replacement Market, Revenue & Volume
Table 40: Mergers & Acquistions 2018-2019Total Ankle Replacement Market, Revenue & Volume
List: of Figures:
Figure 1: Overview of Total Ankle Replacement Market 2019-2024
Figure 2: Market Share Analysis for Total Ankle Replacement Market 2018 (US$)
Figure 3: Product Comparison in Total Ankle Replacement Market 2018-2019 (US$)
Figure 4: End User Profile for Total Ankle Replacement Market 2018-2019 (US$)
Figure 5: Patent Application and Grant in Total Ankle Replacement Market 2013-2018* (US$)
Figure 6: Top 5 Companies Financial Analysis in Total Ankle Replacement Market 2018-2019 (US$)
Figure 7: Market Entry Strategy in Total Ankle Replacement Market 2018-2019
Figure 8: Ecosystem Analysis in Total Ankle Replacement Market2018
Figure 9: Average Selling Price in Total Ankle Replacement Market 2019-2024
Figure 10: Top Opportunites in Total Ankle Replacement Market 2018-2019
Figure 11: Market Life Cycle Analysis in Total Ankle Replacement Market
Figure 12: GlobalBy DesignTotal Ankle Replacement Market Revenue, 2019-2024 ($)
Figure 13: Global Total Ankle Replacement Market - By Geography
Figure 14: Global Total Ankle Replacement Market Value & Volume, By Geography, 2019-2024 ($)
Figure 15: Global Total Ankle Replacement Market CAGR, By Geography, 2019-2024 (%)
Figure 16: North America Total Ankle Replacement Market Value & Volume, 2019-2024 ($)
Figure 17: US Total Ankle Replacement Market Value & Volume, 2019-2024 ($)
Figure 18: US GDP and Population, 2018-2019 ($)
Figure 19: US GDP – Composition of 2018, By Sector of Origin
Figure 20: US Export and Import Value & Volume, 2018-2019 ($)
Figure 21: Canada Total Ankle Replacement Market Value & Volume, 2019-2024 ($)
Figure 22: Canada GDP and Population, 2018-2019 ($)
Figure 23: Canada GDP – Composition of 2018, By Sector of Origin
Figure 24: Canada Export and Import Value & Volume, 2018-2019 ($)
Figure 25: Mexico Total Ankle Replacement Market Value & Volume, 2019-2024 ($)
Figure 26: Mexico GDP and Population, 2018-2019 ($)
Figure 27: Mexico GDP – Composition of 2018, By Sector of Origin
Figure 28: Mexico Export and Import Value & Volume, 2018-2019 ($)
Figure 29: South America Total Ankle Replacement MarketSouth America 3D Printing Market Value & Volume, 2019-2024 ($)
Figure 30: Brazil Total Ankle Replacement Market Value & Volume, 2019-2024 ($)
Figure 31: Brazil GDP and Population, 2018-2019 ($)
Figure 32: Brazil GDP – Composition of 2018, By Sector of Origin
Figure 33: Brazil Export and Import Value & Volume, 2018-2019 ($)
Figure 34: Venezuela Total Ankle Replacement Market Value & Volume, 2019-2024 ($)
Figure 35: Venezuela GDP and Population, 2018-2019 ($)
Figure 36: Venezuela GDP – Composition of 2018, By Sector of Origin
Figure 37: Venezuela Export and Import Value & Volume, 2018-2019 ($)
Figure 38: Argentina Total Ankle Replacement Market Value & Volume, 2019-2024 ($)
Figure 39: Argentina GDP and Population, 2018-2019 ($)
Figure 40: Argentina GDP – Composition of 2018, By Sector of Origin
Figure 41: Argentina Export and Import Value & Volume, 2018-2019 ($)
Figure 42: Ecuador Total Ankle Replacement Market Value & Volume, 2019-2024 ($)
Figure 43: Ecuador GDP and Population, 2018-2019 ($)
Figure 44: Ecuador GDP – Composition of 2018, By Sector of Origin
Figure 45: Ecuador Export and Import Value & Volume, 2018-2019 ($)
Figure 46: Peru Total Ankle Replacement Market Value & Volume, 2019-2024 ($)
Figure 47: Peru GDP and Population, 2018-2019 ($)
Figure 48: Peru GDP – Composition of 2018, By Sector of Origin
Figure 49: Peru Export and Import Value & Volume, 2018-2019 ($)
Figure 50: Colombia Total Ankle Replacement Market Value & Volume, 2019-2024 ($)
Figure 51: Colombia GDP and Population, 2018-2019 ($)
Figure 52: Colombia GDP – Composition of 2018, By Sector of Origin
Figure 53: Colombia Export and Import Value & Volume, 2018-2019 ($)
Figure 54: Costa Rica Total Ankle Replacement MarketCosta Rica 3D Printing Market Value & Volume, 2019-2024 ($)
Figure 55: Costa Rica GDP and Population, 2018-2019 ($)
Figure 56: Costa Rica GDP – Composition of 2018, By Sector of Origin
Figure 57: Costa Rica Export and Import Value & Volume, 2018-2019 ($)
Figure 58: Europe Total Ankle Replacement Market Value & Volume, 2019-2024 ($)
Figure 59: U.K Total Ankle Replacement Market Value & Volume, 2019-2024 ($)
Figure 60: U.K GDP and Population, 2018-2019 ($)
Figure 61: U.K GDP – Composition of 2018, By Sector of Origin
Figure 62: U.K Export and Import Value & Volume, 2018-2019 ($)
Figure 63: Germany Total Ankle Replacement Market Value & Volume, 2019-2024 ($)
Figure 64: Germany GDP and Population, 2018-2019 ($)
Figure 65: Germany GDP – Composition of 2018, By Sector of Origin
Figure 66: Germany Export and Import Value & Volume, 2018-2019 ($)
Figure 67: Italy Total Ankle Replacement Market Value & Volume, 2019-2024 ($)
Figure 68: Italy GDP and Population, 2018-2019 ($)
Figure 69: Italy GDP – Composition of 2018, By Sector of Origin
Figure 70: Italy Export and Import Value & Volume, 2018-2019 ($)
Figure 71: France Total Ankle Replacement Market Value & Volume, 2019-2024 ($)
Figure 72: France GDP and Population, 2018-2019 ($)
Figure 73: France GDP – Composition of 2018, By Sector of Origin
Figure 74: France Export and Import Value & Volume, 2018-2019 ($)
Figure 75: Netherlands Total Ankle Replacement Market Value & Volume, 2019-2024 ($)
Figure 76: Netherlands GDP and Population, 2018-2019 ($)
Figure 77: Netherlands GDP – Composition of 2018, By Sector of Origin
Figure 78: Netherlands Export and Import Value & Volume, 2018-2019 ($)
Figure 79: Belgium Total Ankle Replacement Market Value & Volume, 2019-2024 ($)
Figure 80: Belgium GDP and Population, 2018-2019 ($)
Figure 81: Belgium GDP – Composition of 2018, By Sector of Origin
Figure 82: Belgium Export and Import Value & Volume, 2018-2019 ($)
Figure 83: Spain Total Ankle Replacement Market Value & Volume, 2019-2024 ($)
Figure 84: Spain GDP and Population, 2018-2019 ($)
Figure 85: Spain GDP – Composition of 2018, By Sector of Origin
Figure 86: Spain Export and Import Value & Volume, 2018-2019 ($)
Figure 87: Denmark Total Ankle Replacement Market Value & Volume, 2019-2024 ($)
Figure 88: Denmark GDP and Population, 2018-2019 ($)
Figure 89: Denmark GDP – Composition of 2018, By Sector of Origin
Figure 90: Denmark Export and Import Value & Volume, 2018-2019 ($)
Figure 91: APAC Total Ankle Replacement Market Value & Volume, 2019-2024 ($)
Figure 92: China Total Ankle Replacement MarketValue & Volume, 2019-2024
Figure 93: China GDP and Population, 2018-2019 ($)
Figure 94: China GDP – Composition of 2018, By Sector of Origin
Figure 95: China Export and Import Value & Volume, 2018-2019 ($)Total Ankle Replacement MarketChina Export and Import Value & Volume, 2018-2019 ($)
Figure 96: Australia Total Ankle Replacement Market Value & Volume, 2019-2024 ($)
Figure 97: Australia GDP and Population, 2018-2019 ($)
Figure 98: Australia GDP – Composition of 2018, By Sector of Origin
Figure 99: Australia Export and Import Value & Volume, 2018-2019 ($)
Figure 100: South Korea Total Ankle Replacement Market Value & Volume, 2019-2024 ($)
Figure 101: South Korea GDP and Population, 2018-2019 ($)
Figure 102: South Korea GDP – Composition of 2018, By Sector of Origin
Figure 103: South Korea Export and Import Value & Volume, 2018-2019 ($)
Figure 104: India Total Ankle Replacement Market Value & Volume, 2019-2024 ($)
Figure 105: India GDP and Population, 2018-2019 ($)
Figure 106: India GDP – Composition of 2018, By Sector of Origin
Figure 107: India Export and Import Value & Volume, 2018-2019 ($)
Figure 108: Taiwan Total Ankle Replacement MarketTaiwan 3D Printing Market Value & Volume, 2019-2024 ($)
Figure 109: Taiwan GDP and Population, 2018-2019 ($)
Figure 110: Taiwan GDP – Composition of 2018, By Sector of Origin
Figure 111: Taiwan Export and Import Value & Volume, 2018-2019 ($)
Figure 112: Malaysia Total Ankle Replacement MarketMalaysia 3D Printing Market Value & Volume, 2019-2024 ($)
Figure 113: Malaysia GDP and Population, 2018-2019 ($)
Figure 114: Malaysia GDP – Composition of 2018, By Sector of Origin
Figure 115: Malaysia Export and Import Value & Volume, 2018-2019 ($)
Figure 116: Hong Kong Total Ankle Replacement MarketHong Kong 3D Printing Market Value & Volume, 2019-2024 ($)
Figure 117: Hong Kong GDP and Population, 2018-2019 ($)
Figure 118: Hong Kong GDP – Composition of 2018, By Sector of Origin
Figure 119: Hong Kong Export and Import Value & Volume, 2018-2019 ($)
Figure 120: Middle East & Africa Total Ankle Replacement MarketMiddle East & Africa 3D Printing Market Value & Volume, 2019-2024 ($)
Figure 121: Russia Total Ankle Replacement MarketRussia 3D Printing Market Value & Volume, 2019-2024 ($)
Figure 122: Russia GDP and Population, 2018-2019 ($)
Figure 123: Russia GDP – Composition of 2018, By Sector of Origin
Figure 124: Russia Export and Import Value & Volume, 2018-2019 ($)
Figure 125: Israel Total Ankle Replacement Market Value & Volume, 2019-2024 ($)
Figure 126: Israel GDP and Population, 2018-2019 ($)
Figure 127: Israel GDP – Composition of 2018, By Sector of Origin
Figure 128: Israel Export and Import Value & Volume, 2018-2019 ($)
Figure 129: Entropy Share, By Strategies, 2018-2019* (%)Total Ankle Replacement Market
Figure 130: Developments, 2018-2019*Total Ankle Replacement Market
Figure 131: Company 1 Total Ankle Replacement Market Net Revenue, By Years, 2018-2019* ($)
Figure 132: Company 1 Total Ankle Replacement Market Net Revenue Share, By Business segments, 2018 (%)
Figure 133: Company 1 Total Ankle Replacement Market Net Sales Share, By Geography, 2018 (%)
Figure 134: Company 2 Total Ankle Replacement Market Net Revenue, By Years, 2018-2019* ($)
Figure 135: Company 2 Total Ankle Replacement Market Net Revenue Share, By Business segments, 2018 (%)
Figure 136: Company 2 Total Ankle Replacement Market Net Sales Share, By Geography, 2018 (%)
Figure 137: Company 3Total Ankle Replacement Market Net Revenue, By Years, 2018-2019* ($)
Figure 138: Company 3Total Ankle Replacement Market Net Revenue Share, By Business segments, 2018 (%)
Figure 139: Company 3Total Ankle Replacement Market Net Sales Share, By Geography, 2018 (%)
Figure 140: Company 4 Total Ankle Replacement Market Net Revenue, By Years, 2018-2019* ($)
Figure 141: Company 4 Total Ankle Replacement Market Net Revenue Share, By Business segments, 2018 (%)
Figure 142: Company 4 Total Ankle Replacement Market Net Sales Share, By Geography, 2018 (%)
Figure 143: Company 5 Total Ankle Replacement Market Net Revenue, By Years, 2018-2019* ($)
Figure 144: Company 5 Total Ankle Replacement Market Net Revenue Share, By Business segments, 2018 (%)
Figure 145: Company 5 Total Ankle Replacement Market Net Sales Share, By Geography, 2018 (%)
Figure 146: Company 6 Total Ankle Replacement Market Net Revenue, By Years, 2018-2019* ($)
Figure 147: Company 6 Total Ankle Replacement Market Net Revenue Share, By Business segments, 2018 (%)
Figure 148: Company 6 Total Ankle Replacement Market Net Sales Share, By Geography, 2018 (%)
Figure 149: Company 7 Total Ankle Replacement Market Net Revenue, By Years, 2018-2019* ($)
Figure 150: Company 7 Total Ankle Replacement Market Net Revenue Share, By Business segments, 2018 (%)
Figure 151: Company 7 Total Ankle Replacement Market Net Sales Share, By Geography, 2018 (%)
Figure 152: Company 8 Total Ankle Replacement Market Net Revenue, By Years, 2018-2019* ($)
Figure 153: Company 8 Total Ankle Replacement Market Net Revenue Share, By Business segments, 2018 (%)
Figure 154: Company 8 Total Ankle Replacement Market Net Sales Share, By Geography, 2018 (%)
Figure 155: Company 9 Total Ankle Replacement Market Net Revenue, By Years, 2018-2019* ($)
Figure 156: Company 9 Total Ankle Replacement Market Net Revenue Share, By Business segments, 2018 (%)
Figure 157: Company 9 Total Ankle Replacement Market Net Sales Share, By Geography, 2018 (%)
Figure 158: Company 10 Total Ankle Replacement Market Net Revenue, By Years, 2018-2019* ($)
Figure 159: Company 10 Total Ankle Replacement Market Net Revenue Share, By Business segments, 2018 (%)
Figure 160: Company 10 Total Ankle Replacement Market Net Sales Share, By Geography, 2018 (%)
Figure 161: Company 11 Total Ankle Replacement Market Net Revenue, By Years, 2018-2019* ($)
Figure 162: Company 11 Total Ankle Replacement Market Net Revenue Share, By Business segments, 2018 (%)
Figure 163: Company 11 Total Ankle Replacement Market Net Sales Share, By Geography, 2018 (%)
Figure 164: Company 12 Total Ankle Replacement Market Net Revenue, By Years, 2018-2019* ($)
Figure 165: Company 12 Total Ankle Replacement Market Net Revenue Share, By Business segments, 2018 (%)
Figure 166: Company 12 Total Ankle Replacement Market Net Sales Share, By Geography, 2018 (%)
Figure 167: Company 13Total Ankle Replacement Market Net Revenue, By Years, 2018-2019* ($)
Figure 168: Company 13Total Ankle Replacement Market Net Revenue Share, By Business segments, 2018 (%)
Figure 169: Company 13Total Ankle Replacement Market Net Sales Share, By Geography, 2018 (%)
Figure 170: Company 14 Total Ankle Replacement Market Net Revenue, By Years, 2018-2019* ($)
Figure 171: Company 14 Total Ankle Replacement Market Net Revenue Share, By Business segments, 2018 (%)
Figure 172: Company 14 Total Ankle Replacement Market Net Sales Share, By Geography, 2018 (%)
Figure 173: Company 15 Total Ankle Replacement Market Net Revenue, By Years, 2018-2019* ($)
Figure 174: Company 15 Total Ankle Replacement Market Net Revenue Share, By Business segments, 2018 (%)
Figure 175: Company 15 Total Ankle Replacement Market Net Sales Share, By Geography, 2018 (%)