 Email
Email Print
Print


Ultrasound Sensors Market Overview
Ultrasound Sensors market is anticipated to reach $11.6 billion by 2030 with a CAGR of 11.2% in the forecast period 2024-2030. The Ultrasound Sensors Market is experiencing significant growth driven by advancements in medical imaging technology, automotive safety systems, and industrial automation. These sensors use ultrasound waves to measure distance, detect objects, and create images without causing harm. In healthcare, ultrasound sensors play a crucial role in diagnostic imaging, particularly in obstetrics, cardiology, and oncology, where they offer non-invasive and real-time visualization of internal organs and tissues. The market is witnessing a trend towards miniaturization and integration of ultrasound sensors into portable devices, facilitating point-of-care diagnostics and remote monitoring applications.
Another notable trend is the increasing adoption of ultrasound sensors in automotive applications, such as parking assistance, collision avoidance systems, and autonomous vehicles. These sensors enable accurate distance measurement and object detection, enhancing vehicle safety and reducing accidents. Furthermore, the industrial sector is leveraging ultrasound sensors for level measurement, defect detection, and quality control in manufacturing processes, driving demand in industries such as oil and gas, chemical, and pharmaceuticals.
Developments in sensor technology, including improved sensitivity, resolution, and reliability, are fueling market growth. Additionally, the growing emphasis on healthcare digitization and the Internet of Things (IoT) integration are expected to create lucrative opportunities for ultrasound sensor manufacturers. Overall, the Ultrasound Sensors Market is poised for continued expansion across various industries, propelled by technological advancements and increasing applications.
Ultrasound Sensors Market Report Coverage
The report: “Ultrasound Sensors Market Forecast (2024-2030)”, by Industry ARC, covers an in-depth analysis of the following segments of the Ultrasound Sensors Market.
By Product Type: Detection & Ranging, Imaging, Acoustic Microscopy, and Processing & Power.
By Geography: North America (U.S., Canada, Mexico), Europe (Germany, U.K., France, Italy, Spain, Russia and Rest of Europe), Asia Pacific (China, Japan, India, South Korea, Australia & New Zealand, and Rest of Asia Pacific), South America (Brazil, Argentina, Chile, Colombia and Rest of South America), and Rest of the World (Middle East and Africa).
Key Takeaways
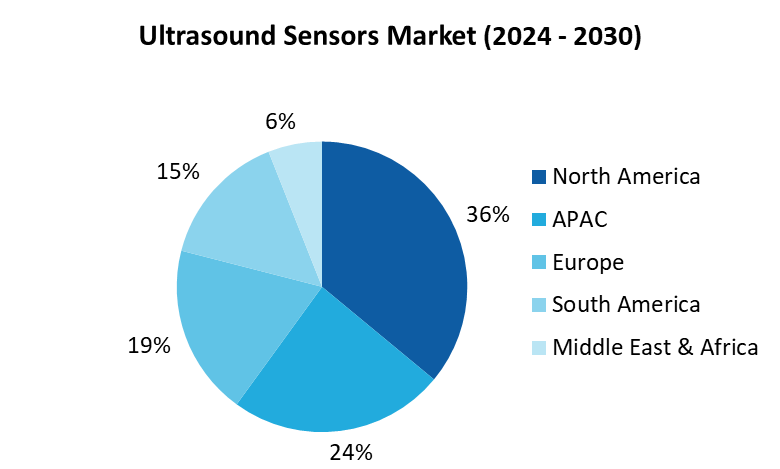
• APAC dominated the Ultrasound Sensors market size with more than 36%, due to key players, advanced technology, robust healthcare, strict regulations, and high ultrasound adoption. Increasing demand for non-invasive procedures and industrial applications also boosts growth.
• The ultrasound sensors market is experiencing significant growth driven by continuous technological advancements, leading to enhanced sensor performance, accuracy, and reliability.
For More Details on This Report - Request for Sample
By Product Type- Segment Analysis
Among the segments mentioned in the Ultrasound Sensors Market, the Imaging segment holds the majority market share. Imaging ultrasound sensors are widely used in various industries, including healthcare, automotive, and manufacturing, for visualizing internal structures, detecting abnormalities, and ensuring quality control. In healthcare, imaging ultrasound sensors are instrumental in diagnostic imaging procedures such as ultrasound scans, providing detailed images of organs, tissues, and fetuses. The increasing demand for non-invasive medical procedures, coupled with advancements in imaging sensor technology, drives the dominance of this segment. Additionally, the automotive sector extensively utilizes imaging ultrasound sensors for applications like parking assistance and object detection, further contributing to the segment's market share.
By Geography - Segment Analysis
In 2023, North America dominated the Ultrasound Sensors market share with more than 36%. In the Ultrasound Sensors Market segmentation by geography, North America stands out as the region with the majority market share. This dominance can be attributed to several factors, including the presence of key market players, advanced technological infrastructure, and significant investments in research and development initiatives. Additionally, the region's robust healthcare sector, stringent regulatory standards, and high adoption rates of ultrasound technology in various industries contribute to its leading position in the market. Furthermore, the growing demand for non-invasive medical procedures, along with increasing applications in industrial automation and automotive sectors, further bolster the growth of ultrasound sensors in North America.
Drivers – Ultrasound Sensors Market
• Rising Demand in Automotive Sector
Ultrasound sensors play a pivotal role in automotive safety systems, including parking assistance, collision avoidance, and autonomous driving. As the automotive industry increasingly integrates advanced driver assistance systems (ADAS) and autonomous vehicle technologies, the demand for ultrasound sensors is witnessing significant growth. These sensors provide accurate distance measurement and object detection capabilities, enhancing vehicle safety and improving driving experiences. Additionally, stringent government regulations mandating the inclusion of safety features in vehicles further drive the adoption of ultrasound sensors by automotive manufacturers.
• Technological Advancements and Innovation
Technological advancements, coupled with continuous innovation in ultrasound sensor design and functionality, are driving market growth. Manufacturers are focusing on developing ultrasonic sensors with enhanced capabilities, such as higher accuracy, increased sensitivity, and improved durability, to cater to diverse industry requirements. Additionally, innovations in sensor miniaturization, integration of artificial intelligence (AI) and machine learning (ML) algorithms, and advancements in signal processing techniques contribute to the market's expansion. Furthermore, the emergence of novel applications, such as gesture recognition, industrial automation, and robotics, propels the demand for advanced ultrasound sensor solutions, fostering market growth.
Challenges –Ultrasound Sensors Market
• Limitations in Certain Operating Environments
Ultrasonic sensors may encounter limitations in specific operating environments, affecting their performance and reliability. Challenges such as interference from ambient noise, temperature variations, and surface irregularities can impact the accuracy and consistency of ultrasonic measurements. For example, soft or uneven surfaces may absorb ultrasonic sound waves, leading to inaccurate distance readings. To overcome these challenges, manufacturers must invest in research and development to improve sensor design, signal processing algorithms, and environmental robustness. Additionally, conducting thorough testing and validation in real-world conditions is crucial to ensure the effectiveness of ultrasonic sensors across diverse applications and environments.
Market Landscape
Technology launches, acquisitions, Partnerships and R&D activities are key strategies adopted by players in the Ultrasound Sensors market. Ultrasound Sensors top 10 companies include:
- Banner Engineering Corp
- BeStar Electronics Industry Co. Ltd
- Rockwell Automation, Inc
- APC International Ltd
- Murata Manufacturing Co., Ltd
- Migatron Corp
- Omron
- Blatek Inc
- Maxbotix,Philips
- Pepperl+Fuchs GmbH
Acquisitions/Technology Launches
• In February 2023, PiL Sensoren GmbH customized a novel model variant of the proven sensor series P47. The high-precision ultrasonic sensors are predestined for basic applications like distance and level measurements in the measuring range of up to 5,000mm. They also provide reliable detection of even small objects due to their sound intensity.
• In February 2022, Migatron Corp., a prominent USA ultrasonic sensor manufacturer, launched two new sensor models aimed at displacement measurement and proximity detection tasks for production line applications like high-speed counting, liquid level, and many other areas of process control.
For more Lifesciences and Healthcare related reports, please click here
1. Ultrasound Sensors Market - Overview
1.1. Definitions and Scope
2. Ultrasound Sensors Market - Executive summary
2.1. Market Revenue, Market Size and Key Trends by Company
2.2. Key Trends by type of Application
2.3. Key Trends segmented by Geography
3. Ultrasound Sensors Market - Comparative analysis
3.1. Comparative analysis
3.1.1. Product Benchmarking - Top 10 companies
3.1.2. Top 5 Financials Analysis
3.1.3. Market Value split by Top 10 companies
3.1.4. Patent Analysis - Top 10 companies
3.1.5. Pricing Analysis
4. Ultrasound Sensors Market – Startup companies Scenario Premium Premium
4.1. Top 10 startup company Analysis by
4.1.1. Investment
4.1.2. Revenue
4.1.3. Market Shares
4.1.4. Market Size and Application Analysis
4.1.5. Venture Capital and Funding Scenario
5. Ultrasound Sensors Market – Industry Market Entry Scenario Premium Premium
5.1. Regulatory Framework Overview
5.2. New Business and Ease of Doing business index
5.3. Case studies of successful ventures
5.4. Customer Analysis – Top 10 companies
6. Ultrasound Sensors Market Forces
6.1. Drivers
6.2. Constraints
6.3. Challenges
6.4. Porters five force model
6.4.1. Bargaining power of suppliers
6.4.2. Bargaining powers of customers
6.4.3. Threat of new entrants
6.4.4. Rivalry among existing players
6.4.5. Threat of substitutes
7. Ultrasound Sensors Market -Strategic analysis
7.1. Value chain analysis
7.2. Opportunities analysis
7.3. Product life cycle
7.4. Suppliers and distributors Market Share
8. Ultrasound Sensors Market – By Product Type (Market Size -$Million / $Billion)
8.1. Market Size and Market Share Analysis
8.2. Application Revenue and Trend Research
8.3. Product Segment Analysis
8.3.1. Detection & Ranging
8.3.2. Imaging
8.3.3. Acoustic Microscopy
8.3.4. Processing & Power
9. Ultrasound Sensors - By Geography (Market Size -$Million / $Billion)
9.1. Ultrasound Sensors Market - North America Segment Research
9.2. North America Market Research (Million / $Billion)
9.2.1. Segment type Size and Market Size Analysis
9.2.2. Revenue and Trends
9.2.3. Application Revenue and Trends by type of Application
9.2.4. Company Revenue and Product Analysis
9.2.5. North America Product type and Application Market Size
9.2.5.1. U.S.
9.2.5.2. Canada
9.2.5.3. Mexico
9.2.5.4. Rest of North America
9.3. Ultrasound Sensors - South America Segment Research
9.4. South America Market Research (Market Size -$Million / $Billion)
9.4.1. Segment type Size and Market Size Analysis
9.4.2. Revenue and Trends
9.4.3. Application Revenue and Trends by type of Application
9.4.4. Company Revenue and Product Analysis
9.4.5. South America Product type and Application Market Size
9.4.5.1. Brazil
9.4.5.2. Venezuela
9.4.5.3. Argentina
9.4.5.4. Ecuador
9.4.5.5. Peru
9.4.5.6. Colombia
9.4.5.7. Costa Rica
9.4.5.8. Rest of South America
9.5. Ultrasound Sensors - Europe Segment Research
9.6. Europe Market Research (Market Size -$Million / $Billion)
9.6.1. Segment type Size and Market Size Analysis
9.6.2. Revenue and Trends
9.6.3. Application Revenue and Trends by type of Application
9.6.4. Company Revenue and Product Analysis
9.6.5. Europe Segment Product type and Application Market Size
9.6.5.1. U.K
9.6.5.2. Germany
9.6.5.3. Italy
9.6.5.4. France
9.6.5.5. Netherlands
9.6.5.6. Belgium
9.6.5.7. Spain
9.6.5.8. Denmark
9.6.5.9. Rest of Europe
9.7. Ultrasound Sensors – APAC Segment Research
9.8. APAC Market Research (Market Size -$Million / $Billion)
9.8.1. Segment type Size and Market Size Analysis
9.8.2. Revenue and Trends
9.8.3. Application Revenue and Trends by type of Application
9.8.4. Company Revenue and Product Analysis
9.8.5. APAC Segment – Product type and Application Market Size
9.8.5.1. China
9.8.5.2. Australia
9.8.5.3. Japan
9.8.5.4. South Korea
9.8.5.5. India
9.8.5.6. Taiwan
9.8.5.7. Malaysia
10. Ultrasound Sensors Market - Entropy
10.1. New product launches
10.2. M&A's, collaborations, JVs and partnerships
11. Ultrasound Sensors Market – Industry / Segment Competition landscape Premium Premium
11.1. Market Share Analysis
11.1.1. Market Share by Region- Top companies
11.1.2. Market Share by Country - Top 10 companies
11.1.3. Market Share by type of Product / Product category- Top 10 companies
11.2. Best Practises for companies
12. Ultrasound Sensors Market – Key Company List by Country Premium Premium
13. Ultrasound Sensors Market Company Analysis
13.1. Market Share, Company Revenue, Products, M&A, Developments
13.2. Banner Engineering Corp
13.3. BeStar Electronics Industry Co. Ltd
13.4. Rockwell Automation, Inc
13.5. APC International Ltd
13.6. Murata Manufacturing Co., Ltd
13.7. Migatron Corp
13.8. Omron
13.9. Blatek Inc
13.10. Maxbotix,Philips
13.11. Pepperl+Fuchs GmbH
13.12. Company 11
13.13. Company 12
13.14. Company 13 and More
"*Financials would be provided on a best-efforts basis for private companies"
List of Tables:
Table 1: Ultrasound Sensors Market Overview 2019-2024
Table 2: Ultrasound Sensors Market Leader Analysis 2018-2019 (US$)
Table 3: Ultrasound Sensors Market Product Analysis 2018-2019 (US$)
Table 4: Ultrasound Sensors Market End User Analysis 2018-2019 (US$)
Table 5: Ultrasound Sensors Market Patent Analysis 2013-2018* (US$)
Table 6: Ultrasound Sensors Market Financial Analysis 2018-2019 (US$)
Table 7: Ultrasound Sensors Market Driver Analysis 2018-2019 (US$)
Table 8: Ultrasound Sensors Market Challenges Analysis 2018-2019 (US$)
Table 9: Ultrasound Sensors Market Constraint Analysis 2018-2019 (US$)
Table 10: Ultrasound Sensors Market Supplier Bargaining Power Analysis 2018-2019 (US$)
Table 11: Ultrasound Sensors Market Buyer Bargaining Power Analysis 2018-2019 (US$)
Table 12: Ultrasound Sensors Market Threat of Substitutes Analysis 2018-2019 (US$)
Table 13: Ultrasound Sensors Market Threat of New Entrants Analysis 2018-2019 (US$)
Table 14: Ultrasound Sensors Market Degree of Competition Analysis 2018-2019 (US$)
Table 15: Ultrasound Sensors Market Value Chain Analysis 2018-2019 (US$)
Table 16: Ultrasound Sensors Market Pricing Analysis 2019-2024 (US$)
Table 17: Ultrasound Sensors Market Opportunities Analysis 2019-2024 (US$)
Table 18: Ultrasound Sensors Market Product Life Cycle Analysis 2019-2024 (US$)
Table 19: Ultrasound Sensors Market Supplier Analysis 2018-2019 (US$)
Table 20: Ultrasound Sensors Market Distributor Analysis 2018-2019 (US$)
Table 21: Ultrasound Sensors Market Trend Analysis 2018-2019 (US$)
Table 22: Ultrasound Sensors Market Size 2018 (US$)
Table 23: Ultrasound Sensors Market Forecast Analysis 2019-2024 (US$)
Table 24: Ultrasound Sensors Market Sales Forecast Analysis 2019-2024 (Units)
Table 25: Top Companies 2018 (US$) Ultrasound Sensors Market, Revenue & Volume
Table 26: Product Launch 2018-2019 Ultrasound Sensors Market, Revenue & Volume
Table 27: Mergers & Acquistions 2018-2019 Ultrasound Sensors Market, Revenue & Volume
List of Figures:
Figure 1: Overview of Ultrasound Sensors Market 2019-2024
Figure 2: Market Share Analysis for Ultrasound Sensors Market 2018 (US$)
Figure 3: Product Comparison in Ultrasound Sensors Market 2018-2019 (US$)
Figure 4: End User Profile for Ultrasound Sensors Market 2018-2019 (US$)
Figure 5: Patent Application and Grant in Ultrasound Sensors Market 2013-2018* (US$)
Figure 6: Top 5 Companies Financial Analysis in Ultrasound Sensors Market 2018-2019 (US$)
Figure 7: Market Entry Strategy in Ultrasound Sensors Market 2018-2019
Figure 8: Ecosystem Analysis in Ultrasound Sensors Market 2018
Figure 9: Average Selling Price in Ultrasound Sensors Market 2019-2024
Figure 10: Top Opportunites in Ultrasound Sensors Market 2018-2019
Figure 11: Market Life Cycle Analysis in Ultrasound Sensors Market
Figure 12: Global Ultrasound Sensors Market - By Geography
Figure 13: Global Ultrasound Sensors Market Value & Volume, By Geography, 2019-2024 ($)
Figure 14: Global Ultrasound Sensors Market CAGR, By Geography, 2019-2024 (%)
Figure 15: North America Ultrasound Sensors Market Value & Volume, 2019-2024 ($)
Figure 16: US Ultrasound Sensors Market Value & Volume, 2019-2024 ($)
Figure 17: US GDP and Population, 2018-2019 ($)
Figure 18: US GDP – Composition of 2018, By Sector of Origin
Figure 19: US Export and Import Value & Volume, 2018-2019 ($)
Figure 20: Canada Ultrasound Sensors Market Value & Volume, 2019-2024 ($)
Figure 21: Canada GDP and Population, 2018-2019 ($)
Figure 22: Canada GDP – Composition of 2018, By Sector of Origin
Figure 23: Canada Export and Import Value & Volume, 2018-2019 ($)
Figure 24: Mexico Ultrasound Sensors Market Value & Volume, 2019-2024 ($)
Figure 25: Mexico GDP and Population, 2018-2019 ($)
Figure 26: Mexico GDP – Composition of 2018, By Sector of Origin
Figure 27: Mexico Export and Import Value & Volume, 2018-2019 ($)
Figure 28: South America Ultrasound Sensors Market Value & Volume, 2019-2024 ($)
Figure 29: Brazil Ultrasound Sensors Market Value & Volume, 2019-2024 ($)
Figure 30: Brazil GDP and Population, 2018-2019 ($)
Figure 31: Brazil GDP – Composition of 2018, By Sector of Origin
Figure 32: Brazil Export and Import Value & Volume, 2018-2019 ($)
Figure 33: Venezuela Ultrasound Sensors Market Value & Volume, 2019-2024 ($)
Figure 34: Venezuela GDP and Population, 2018-2019 ($)
Figure 35: Venezuela GDP – Composition of 2018, By Sector of Origin
Figure 36: Venezuela Export and Import Value & Volume, 2018-2019 ($)
Figure 37: Argentina Ultrasound Sensors Market Value & Volume, 2019-2024 ($)
Figure 38: Argentina GDP and Population, 2018-2019 ($)
Figure 39: Argentina GDP – Composition of 2018, By Sector of Origin
Figure 40: Argentina Export and Import Value & Volume, 2018-2019 ($)
Figure 41: Ecuador Ultrasound Sensors Market Value & Volume, 2019-2024 ($)
Figure 42: Ecuador GDP and Population, 2018-2019 ($)
Figure 43: Ecuador GDP – Composition of 2018, By Sector of Origin
Figure 44: Ecuador Export and Import Value & Volume, 2018-2019 ($)
Figure 45: Peru Ultrasound Sensors Market Value & Volume, 2019-2024 ($)
Figure 46: Peru GDP and Population, 2018-2019 ($)
Figure 47: Peru GDP – Composition of 2018, By Sector of Origin
Figure 48: Peru Export and Import Value & Volume, 2018-2019 ($)
Figure 49: Colombia Ultrasound Sensors Market Value & Volume, 2019-2024 ($)
Figure 50: Colombia GDP and Population, 2018-2019 ($)
Figure 51: Colombia GDP – Composition of 2018, By Sector of Origin
Figure 52: Colombia Export and Import Value & Volume, 2018-2019 ($)
Figure 53: Costa Rica Ultrasound Sensors Market Value & Volume, 2019-2024 ($)
Figure 54: Costa Rica GDP and Population, 2018-2019 ($)
Figure 55: Costa Rica GDP – Composition of 2018, By Sector of Origin
Figure 56: Costa Rica Export and Import Value & Volume, 2018-2019 ($)
Figure 57: Europe Ultrasound Sensors Market Value & Volume, 2019-2024 ($)
Figure 58: U.K Ultrasound Sensors Market Value & Volume, 2019-2024 ($)
Figure 59: U.K GDP and Population, 2018-2019 ($)
Figure 60: U.K GDP – Composition of 2018, By Sector of Origin
Figure 61: U.K Export and Import Value & Volume, 2018-2019 ($)
Figure 62: Germany Ultrasound Sensors Market Value & Volume, 2019-2024 ($)
Figure 63: Germany GDP and Population, 2018-2019 ($)
Figure 64: Germany GDP – Composition of 2018, By Sector of Origin
Figure 65: Germany Export and Import Value & Volume, 2018-2019 ($)
Figure 66: Italy Ultrasound Sensors Market Value & Volume, 2019-2024 ($)
Figure 67: Italy GDP and Population, 2018-2019 ($)
Figure 68: Italy GDP – Composition of 2018, By Sector of Origin
Figure 69: Italy Export and Import Value & Volume, 2018-2019 ($)
Figure 70: France Ultrasound Sensors Market Value & Volume, 2019-2024 ($)
Figure 71: France GDP and Population, 2018-2019 ($)
Figure 72: France GDP – Composition of 2018, By Sector of Origin
Figure 73: France Export and Import Value & Volume, 2018-2019 ($)
Figure 74: Netherlands Ultrasound Sensors Market Value & Volume, 2019-2024 ($)
Figure 75: Netherlands GDP and Population, 2018-2019 ($)
Figure 76: Netherlands GDP – Composition of 2018, By Sector of Origin
Figure 77: Netherlands Export and Import Value & Volume, 2018-2019 ($)
Figure 78: Belgium Ultrasound Sensors Market Value & Volume, 2019-2024 ($)
Figure 79: Belgium GDP and Population, 2018-2019 ($)
Figure 80: Belgium GDP – Composition of 2018, By Sector of Origin
Figure 81: Belgium Export and Import Value & Volume, 2018-2019 ($)
Figure 82: Spain Ultrasound Sensors Market Value & Volume, 2019-2024 ($)
Figure 83: Spain GDP and Population, 2018-2019 ($)
Figure 84: Spain GDP – Composition of 2018, By Sector of Origin
Figure 85: Spain Export and Import Value & Volume, 2018-2019 ($)
Figure 86: Denmark Ultrasound Sensors Market Value & Volume, 2019-2024 ($)
Figure 87: Denmark GDP and Population, 2018-2019 ($)
Figure 88: Denmark GDP – Composition of 2018, By Sector of Origin
Figure 89: Denmark Export and Import Value & Volume, 2018-2019 ($)
Figure 90: APAC Ultrasound Sensors Market Value & Volume, 2019-2024 ($)
Figure 91: China Ultrasound Sensors Market Value & Volume, 2019-2024
Figure 92: China GDP and Population, 2018-2019 ($)
Figure 93: China GDP – Composition of 2018, By Sector of Origin
Figure 94: China Export and Import Value & Volume, 2018-2019 ($) Ultrasound Sensors Market China Export and Import Value & Volume, 2018-2019 ($)
Figure 95: Australia Ultrasound Sensors Market Value & Volume, 2019-2024 ($)
Figure 96: Australia GDP and Population, 2018-2019 ($)
Figure 97: Australia GDP – Composition of 2018, By Sector of Origin
Figure 98: Australia Export and Import Value & Volume, 2018-2019 ($)
Figure 99: South Korea Ultrasound Sensors Market Value & Volume, 2019-2024 ($)
Figure 100: South Korea GDP and Population, 2018-2019 ($)
Figure 101: South Korea GDP – Composition of 2018, By Sector of Origin
Figure 102: South Korea Export and Import Value & Volume, 2018-2019 ($)
Figure 103: India Ultrasound Sensors Market Value & Volume, 2019-2024 ($)
Figure 104: India GDP and Population, 2018-2019 ($)
Figure 105: India GDP – Composition of 2018, By Sector of Origin
Figure 106: India Export and Import Value & Volume, 2018-2019 ($)
Figure 107: Taiwan Ultrasound Sensors Market Value & Volume, 2019-2024 ($)
Figure 108: Taiwan GDP and Population, 2018-2019 ($)
Figure 109: Taiwan GDP – Composition of 2018, By Sector of Origin
Figure 110: Taiwan Export and Import Value & Volume, 2018-2019 ($)
Figure 111: Malaysia Ultrasound Sensors Market Value & Volume, 2019-2024 ($)
Figure 112: Malaysia GDP and Population, 2018-2019 ($)
Figure 113: Malaysia GDP – Composition of 2018, By Sector of Origin
Figure 114: Malaysia Export and Import Value & Volume, 2018-2019 ($)
Figure 115: Hong Kong Ultrasound Sensors Market Value & Volume, 2019-2024 ($)
Figure 116: Hong Kong GDP and Population, 2018-2019 ($)
Figure 117: Hong Kong GDP – Composition of 2018, By Sector of Origin
Figure 118: Hong Kong Export and Import Value & Volume, 2018-2019 ($)
Figure 119: Middle East & Africa Ultrasound Sensors Market Middle East & Africa 3D Printing Market Value & Volume, 2019-2024 ($)
Figure 120: Russia Ultrasound Sensors Market Value & Volume, 2019-2024 ($)
Figure 121: Russia GDP and Population, 2018-2019 ($)
Figure 122: Russia GDP – Composition of 2018, By Sector of Origin
Figure 123: Russia Export and Import Value & Volume, 2018-2019 ($)
Figure 124: Israel Ultrasound Sensors Market Value & Volume, 2019-2024 ($)
Figure 125: Israel GDP and Population, 2018-2019 ($)
Figure 126: Israel GDP – Composition of 2018, By Sector of Origin
Figure 127: Israel Export and Import Value & Volume, 2018-2019 ($)
Figure 128: Entropy Share, By Strategies, 2018-2019* (%) Ultrasound Sensors Market
Figure 129: Developments, 2018-2019* Ultrasound Sensors Market
Figure 130: Company 1 Ultrasound Sensors Market Net Revenue, By Years, 2018-2019* ($)
Figure 131: Company 1 Ultrasound Sensors Market Net Revenue Share, By Business segments, 2018 (%)
Figure 132: Company 1 Ultrasound Sensors Market Net Sales Share, By Geography, 2018 (%)
Figure 133: Company 2 Ultrasound Sensors Market Net Revenue, By Years, 2018-2019* ($)
Figure 134: Company 2 Ultrasound Sensors Market Net Revenue Share, By Business segments, 2018 (%)
Figure 135: Company 2 Ultrasound Sensors Market Net Sales Share, By Geography, 2018 (%)
Figure 136: Company 3 Ultrasound Sensors Market Net Revenue, By Years, 2018-2019* ($)
Figure 137: Company 3 Ultrasound Sensors Market Net Revenue Share, By Business segments, 2018 (%)
Figure 138: Company 3 Ultrasound Sensors Market Net Sales Share, By Geography, 2018 (%)
Figure 139: Company 4 Ultrasound Sensors Market Net Revenue, By Years, 2018-2019* ($)
Figure 140: Company 4 Ultrasound Sensors Market Net Revenue Share, By Business segments, 2018 (%)
Figure 141: Company 4 Ultrasound Sensors Market Net Sales Share, By Geography, 2018 (%)
Figure 142: Company 5 Ultrasound Sensors Market Net Revenue, By Years, 2018-2019* ($)
Figure 143: Company 5 Ultrasound Sensors Market Net Revenue Share, By Business segments, 2018 (%)
Figure 144: Company 5 Ultrasound Sensors Market Net Sales Share, By Geography, 2018 (%)
Figure 145: Company 6 Ultrasound Sensors Market Net Revenue, By Years, 2018-2019* ($)
Figure 146: Company 6 Ultrasound Sensors Market Net Revenue Share, By Business segments, 2018 (%)
Figure 147: Company 6 Ultrasound Sensors Market Net Sales Share, By Geography, 2018 (%)
Figure 148: Company 7 Ultrasound Sensors Market Net Revenue, By Years, 2018-2019* ($)
Figure 149: Company 7 Ultrasound Sensors Market Net Revenue Share, By Business segments, 2018 (%)
Figure 150: Company 7 Ultrasound Sensors Market Net Sales Share, By Geography, 2018 (%)
Figure 151: Company 8 Ultrasound Sensors Market Net Revenue, By Years, 2018-2019* ($)
Figure 152: Company 8 Ultrasound Sensors Market Net Revenue Share, By Business segments, 2018 (%)
Figure 153: Company 8 Ultrasound Sensors Market Net Sales Share, By Geography, 2018 (%)
Figure 154: Company 9 Ultrasound Sensors Market Net Revenue, By Years, 2018-2019* ($)
Figure 155: Company 9 Ultrasound Sensors Market Net Revenue Share, By Business segments, 2018 (%)
Figure 156: Company 9 Ultrasound Sensors Market Net Sales Share, By Geography, 2018 (%)
Figure 157: Company 10 Ultrasound Sensors Market Net Revenue, By Years, 2018-2019* ($)
Figure 158: Company 10 Ultrasound Sensors Market Net Revenue Share, By Business segments, 2018 (%)
Figure 159: Company 10 Ultrasound Sensors Market Net Sales Share, By Geography, 2018 (%)
Figure 160: Company 11 Ultrasound Sensors Market Net Revenue, By Years, 2018-2019* ($)
Figure 161: Company 11 Ultrasound Sensors Market Net Revenue Share, By Business segments, 2018 (%)
Figure 162: Company 11 Ultrasound Sensors Market Net Sales Share, By Geography, 2018 (%)
Figure 163: Company 12 Ultrasound Sensors Market Net Revenue, By Years, 2018-2019* ($)
Figure 164: Company 12 Ultrasound Sensors Market Net Revenue Share, By Business segments, 2018 (%)
Figure 165: Company 12 Ultrasound Sensors Market Net Sales Share, By Geography, 2018 (%)
Figure 166: Company 13 Ultrasound Sensors Market Net Revenue, By Years, 2018-2019* ($)
Figure 167: Company 13 Ultrasound Sensors Market Net Revenue Share, By Business segments, 2018 (%)
Figure 168: Company 13 Ultrasound Sensors Market Net Sales Share, By Geography, 2018 (%)
Figure 169: Company 14 Ultrasound Sensors Market Net Revenue, By Years, 2018-2019* ($)
Figure 170: Company 14 Ultrasound Sensors Market Net Revenue Share, By Business segments, 2018 (%)
Figure 171: Company 14 Ultrasound Sensors Market Net Sales Share, By Geography, 2018 (%)
Figure 172: Company 15 Ultrasound Sensors Market Net Revenue, By Years, 2018-2019* ($)
Figure 173: Company 15 Ultrasound Sensors Market Net Revenue Share, By Business segments, 2018 (%)
Figure 174: Company 15 Ultrasound Sensors Market Net Sales Share, By Geography, 2018 (%)