 Email
Email Print
Print


Seismometers are instruments that measure the seismic waves generated by earthquakes, volcanic eruptions, and other seismic sources. Globally, development of efficient and advanced technology, rising demand from inexpensive and durable seismometers, growing number of earthquakes, increasing government initiatives, growing focus of geophysical research, and advantageous properties of seismometers are the prime growth drivers of the seismometers market. In addition, an increase in adoption of seismometers for application in newer industrial vertical, and emerging economies such as China, India and others, will create new opportunities for the seismometers market. However, higher cost of research and development, and growing market of counterfeit seismometers are the key restraints for the seismometers market.
Geographically, Asia Pacific dominated the seismometers market, followed by North America. Asia Pacific is projected to have the fastest growth, owing to a rapidly increasing geophysical research projects, rise in industrial sector, and growing government initiatives in developing nations such as China, and India in this region. Among all the types, teleseismometers has the highest market share in the seismometers market, since it can record a very broad range of frequencies. Digital seismometer is the market leader among all outputs of seismometers, owing to its better performance and user friendly properties.
This report identifies the seismometers market size for the years 2014-2016, and forecast of the same till the year 2022. It also highlights the market drivers, restraints, growth indicators, challenges, and other key aspects with respect to the seismometers market.
This report segments the seismometers market on the basis of type, range, varieties, output, and regional market as follows:
- Seismometers Market, By Type: Teleseismometers, Strong-Motion Seismometer, Strain-Beam Seismometer, and Others
- Seismometers Market, By Range: 50 to 750 V/m, 1500 V/m, and 20,000 V/m
- Seismometers Market, By Varieties: Short Period, Long Period, and Broadband
- The report has focused study on seismometers market by basis of output such as: Analog Seismometers, and Digital Seismometers
- This report has been further segmented into major regions, which includes detailed analysis of each region such as: North America, Europe, Asia-Pacific (APAC), and Rest of the World (RoW) covering all the major country level markets in each of the region
Sample Companies profiled in this Report are:
- Shanghai Aidu Industrial Co., Ltd
- Geometrics
- Seistronix
- P.A.S.I. SRL
- Abem Instrument AB
- 10+.
1. Seismometers Market - Overview
1.1. Definitions and Scope
2. Seismometers Market - Executive summary
2.1. Market Revenue, Market Size and Key Trends by Company
2.2. Key Trends by type of Application
2.3. Key Trends segmented by Geography
3. Seismometers Market
3.1. Comparative analysis
3.1.1. Product Benchmarking - Top 10 companies
3.1.2. Top 5 Financials Analysis
3.1.3. Market Value split by Top 10 companies
3.1.4. Patent Analysis - Top 10 companies
3.1.5. Pricing Analysis
4. Seismometers Market – Startup companies Scenario Premium
4.1. Top 10 startup company Analysis by
4.1.1. Investment
4.1.2. Revenue
4.1.3. Market Shares
4.1.4. Market Size and Application Analysis
4.1.5. Venture Capital and Funding Scenario
5. Seismometers Market – Industry Market Entry Scenario Premium
5.1. Regulatory Framework Overview
5.2. New Business and Ease of Doing business index
5.3. Case studies of successful ventures
5.4. Customer Analysis – Top 10 companies
6. Seismometers Market Forces
6.1. Drivers
6.2. Constraints
6.3. Challenges
6.4. Porters five force model
6.4.1. Bargaining power of suppliers
6.4.2. Bargaining powers of customers
6.4.3. Threat of new entrants
6.4.4. Rivalry among existing players
6.4.5. Threat of substitutes
7. Seismometers Market -Strategic analysis
7.1. Value chain analysis
7.2. Opportunities analysis
7.3. Product life cycle
7.4. Suppliers and distributors Market Share
8. Seismometers Market – By Type (Market Size -$Million / $Billion)
8.1. Market Size and Market Share Analysis
8.2. Application Revenue and Trend Research
8.3. Product Segment Analysis
8.3.1. Teleseismometers
8.3.2. Strong-Motion Seismometer
8.3.3. Strain-Beam Seismometer
8.3.4. Others
9. Seismometers Market – By Range (Market Size -$Million / $Billion)
9.1. 50 to 750 V/m
9.2. 1500 V/m
9.3. 20,000 V/m
10. Seismometers Market – By Varieties (Market Size -$Million / $Billion)
10.1. Short Period
10.2. Long Period
10.3. Broadband
11. Seismometers Market – By Output (Market Size -$Million / $Billion)
11.1. Analog
11.2. Digital
12. Seismometers - By Geography (Market Size -$Million / $Billion)
12.1. Seismometers Market - North America Segment Research
12.2. North America Market Research (Million / $Billion)
12.2.1. Segment type Size and Market Size Analysis
12.2.2. Revenue and Trends
12.2.3. Application Revenue and Trends by type of Application
12.2.4. Company Revenue and Product Analysis
12.2.5. North America Product type and Application Market Size
12.2.5.1. U.S.
12.2.5.2. Canada
12.2.5.3. Mexico
12.2.5.4. Rest of North America
12.3. Seismometers - South America Segment Research
12.4. South America Market Research (Market Size -$Million / $Billion)
12.4.1. Segment type Size and Market Size Analysis
12.4.2. Revenue and Trends
12.4.3. Application Revenue and Trends by type of Application
12.4.4. Company Revenue and Product Analysis
12.4.5. South America Product type and Application Market Size
12.4.5.1. Brazil
12.4.5.2. Venezuela
12.4.5.3. Argentina
12.4.5.4. Ecuador
12.4.5.5. Peru
12.4.5.6. Colombia
12.4.5.7. Costa Rica
12.4.5.8. Rest of South America
12.5. Seismometers - Europe Segment Research
12.6. Europe Market Research (Market Size -$Million / $Billion)
12.6.1. Segment type Size and Market Size Analysis
12.6.2. Revenue and Trends
12.6.3. Application Revenue and Trends by type of Application
12.6.4. Company Revenue and Product Analysis
12.6.5. Europe Segment Product type and Application Market Size
12.6.5.1. U.K
12.6.5.2. Germany
12.6.5.3. Italy
12.6.5.4. France
12.6.5.5. Netherlands
12.6.5.6. Belgium
12.6.5.7. Spain
12.6.5.8. Denmark
12.6.5.9. Rest of Europe
12.7. Seismometers – APAC Segment Research
12.8. APAC Market Research (Market Size -$Million / $Billion)
12.8.1. Segment type Size and Market Size Analysis
12.8.2. Revenue and Trends
12.8.3. Application Revenue and Trends by type of Application
12.8.4. Company Revenue and Product Analysis
12.8.5. APAC Segment – Product type and Application Market Size
12.8.5.1. China
12.8.5.2. Australia
12.8.5.3. Japan
12.8.5.4. South Korea
12.8.5.5. India
12.8.5.6. Taiwan
12.8.5.7. Malaysia
13. Seismometers Market - Entropy
13.1. New product launches
13.2. M&A's, collaborations, JVs and partnerships
14. Seismometers Market – Industry / Segment Competition landscape Premium
14.1. Market Share Analysis
14.1.1. Market Share by Country- Top companies
14.1.2. Market Share by Region- Top 10 companies
14.1.3. Market Share by type of Application – Top 10 companies
14.1.4. Market Share by type of Product / Product category- Top 10 companies
14.1.5. Market Share at global level- Top 10 companies
14.1.6. Best Practises for companies
15. Seismometers Market – Key Company List by Country Premium
16. Seismometers Market Company Analysis
16.1. Market Share, Company Revenue, Products, M&A, Developments
16.2. Shanghai Aidu Industrial Co., Ltd
16.3. Geometrics
16.4. Seistronix
16.5. P.A.S.I. SRL
16.6. Abem Instrument AB
16.7. OYO Corporation
16.8. DMT
16.9. Seismic Source Co.
16.10. Dolang Geophysical
16.11. Geotech
16.12. Company 11
16.13. Company 12
16.14. Company 13 and more
"*Financials would be provided on a best efforts basis for private companies"
17. Seismometers Market -Appendix
17.1. Abbreviations
17.2. Sources
18. Seismometers Market -Methodology Premium
18.1. Research Methodology
18.1.1. Company Expert Interviews
18.1.2. Industry Databases
18.1.3. Associations
18.1.4. Company News
18.1.5. Company Annual Reports
18.1.6. Application Trends
18.1.7. New Products and Product database
18.1.8. Company Transcripts
18.1.9. R&D Trends
18.1.10. Key Opinion Leaders Interviews
18.1.11. Supply and Demand Trends
List of Tables:
Table 1: Global Seismometers Market Value, By Type, 2016-2022 ($Million)
Table 2: Global Seismometers Market Value, By Geography, 2016-2022($Million)
Table 3: Americas: Seismometers Market Value, By Type, 2016-2022 ($Million)
Table 4: Americas: Seismometers Market Value, By Country, 2016-2022 ($Million)
Table 5: U.S.: GDP – Composition of 2015, By End Use
Table 6: Canada: GDP – Composition of 2015, By End Use
Table 7: Brazil: GDP – Composition of 2015, By End Use
Table 8: Europe: Seismometers Market Value, By Type, 2016-2022 ($Million)
Table 9: Europe: Seismometers Market Value, By Country, 2016-2022 ($Million)
Table 10: U.K.: GDP – Composition of 2015, By End Use
Table 11: Germany: GDP – Composition of 2015, By End Use
Table 12: France: GDP – Composition of 2015, By End Use
Table 13: APAC: Seismometers Market Value, By Type, 2016-2022 ($Million)
Table 14: APAC: Seismometers Market Value, By Country, 2016-2022 ($Million)
Table 15: China: GDP – Composition of 2015, By End Use
Table 16: Japan: GDP – Composition of 2015, By End Use
Table 17: South Korea: GDP – Composition of 2015, By End Use
Table 18: RoW: Seismometers Market Value, By Type, 2016-2022 ($Million)
Table 19: RoW: Seismometers Market Value, By Region, 2016-2022 ($Million)
Table 20: OYO Corporation: Business Segments
Table 21: OYO Corporation: Product Portfolio
Table 22: Seismic Source Co.: Product Portfolio
Table 23: DMT GmbH & Co. KG: Product/Service Portfolio
List of Figures:
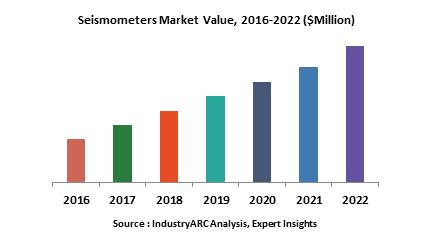
Figure 1: Global Seismometer Market Value, 2016-2022 ($Million)
Figure 2: Global Seismometer Market Value Share, By Type, 2016 (%)
Figure 3: Global Seismometer Market Value Share, By Geography, 2016 (%)
Figure 4: Global Seismometer Market Share, By Key Players, 2016 (%)
Figure 5: Global Seismometer Patent Granted Share, By Country, 2013-2018* (%)
Figure 6: Global Seismometer Granted Patents Share, By Trending Domain, 2013-2018* (%)
Figure 7: Global Seismometer Patents Granted, 2013-2018* (Units)
Figure 8: Seismometers Pricing Analysis, 2015-2023 ($)
Figure 9: Seismometers Market Lifecycle
Figure 10: U.S.: GDP and Population, 2012-2015 ($Trillion, Million)
Figure 11: U.S.: GDP – Composition of 2015, By Sector of Origin
Figure 12: U.S.: Export and Import Value, 2012-2015 ($Trillion)
Figure 13: Canada: GDP and Population, 2012-2015 ($Trillion, Million)
Figure 14: Canada: GDP – Composition of 2015, By Sector of Origin
Figure 15: Canada: Export and Import Value, 2012-2015 ($Billion)
Figure 16: Brazil: GDP and Population, 2012-2015 ($Trillion, Million)
Figure 17: Brazil: GDP – Composition of 2015, By Sector of Origin
Figure 18: Brazil: Export and Import Value, 2012-2015 ($Billion)
Figure 19: U.K.: GDP and Population, 2012-2015 ($Trillion, Million)
Figure 20: U.K.: GDP – Composition of 2015, By Sector of Origin
Figure 21: U.K.: Export and Import Value, 2012-2015 ($Billion)
Figure 22: Germany: GDP and Population, 2012-2015 ($Trillion, Million)
Figure 23: Germany: GDP – Composition of 2015, By Sector of Origin
Figure 24: Germany: Export and Import Value, 2012-2015 ($Billion)
Figure 25: France: GDP and Population, 2012-2015 ($Trillion, Million)
Figure 26: France: GDP – Composition of 2015, By Sector of Origin
Figure 27: France: Export and Import Value, 2012-2015 ($Billion)
Figure 28: China: GDP and Population, 2012-2015 ($Trillion, Million)
Figure 29: China: GDP – Composition of 2015, By Sector of Origin
Figure 30: China: Export and Import Value, 2012-2015 ($Billion)
Figure 31: Japan: GDP and Population, 2012-2015 ($Trillion, Million)
Figure 32: Japan: GDP – Composition of 2015, By Sector of Origin
Figure 33: Japan: Export and Import Value, 2012-2015 ($Billion)
Figure 34: South Korea: GDP and Population, 2012-2015 ($Trillion, Million)
Figure 35: South Korea: GDP – Composition of 2015, By Sector of Origin
Figure 36: South Korea: Export and Import Value, 2012-2015 ($Billion)
Figure 37: Guideline Geo Net Revenue, 2013-2016($Million)
Figure 38: OYO Corporation Net Sales, 2013-2016 ($Billion)
Figure 39: OYO Corporation Net Sales Share, By Business Segment, 2016 (%)
Figure 40: OYO Corporation Net Sales Share, By Geography, 2016 (%)
Figure 41: TUV NORD Group Net Sales, 2013-2016 ($Billion)
Figure 42: TUV NORD Group Net Sales Share, By Business Segment, 2016 (%)
Figure 43: TUV NORD Group Net Sales Share, By Geography, 2016 (%)
Table 1: Global Seismometers Market Value, By Type, 2016-2022 ($Million)
Table 2: Global Seismometers Market Value, By Geography, 2016-2022($Million)
Table 3: Americas: Seismometers Market Value, By Type, 2016-2022 ($Million)
Table 4: Americas: Seismometers Market Value, By Country, 2016-2022 ($Million)
Table 5: U.S.: GDP – Composition of 2015, By End Use
Table 6: Canada: GDP – Composition of 2015, By End Use
Table 7: Brazil: GDP – Composition of 2015, By End Use
Table 8: Europe: Seismometers Market Value, By Type, 2016-2022 ($Million)
Table 9: Europe: Seismometers Market Value, By Country, 2016-2022 ($Million)
Table 10: U.K.: GDP – Composition of 2015, By End Use
Table 11: Germany: GDP – Composition of 2015, By End Use
Table 12: France: GDP – Composition of 2015, By End Use
Table 13: APAC: Seismometers Market Value, By Type, 2016-2022 ($Million)
Table 14: APAC: Seismometers Market Value, By Country, 2016-2022 ($Million)
Table 15: China: GDP – Composition of 2015, By End Use
Table 16: Japan: GDP – Composition of 2015, By End Use
Table 17: South Korea: GDP – Composition of 2015, By End Use
Table 18: RoW: Seismometers Market Value, By Type, 2016-2022 ($Million)
Table 19: RoW: Seismometers Market Value, By Region, 2016-2022 ($Million)
Table 20: OYO Corporation: Business Segments
Table 21: OYO Corporation: Product Portfolio
Table 22: Seismic Source Co.: Product Portfolio
Table 23: DMT GmbH & Co. KG: Product/Service Portfolio
List of Figures:
Figure 1: Global Seismometer Market Value, 2016-2022 ($Million)
Figure 2: Global Seismometer Market Value Share, By Type, 2016 (%)
Figure 3: Global Seismometer Market Value Share, By Geography, 2016 (%)
Figure 4: Global Seismometer Market Share, By Key Players, 2016 (%)
Figure 5: Global Seismometer Patent Granted Share, By Country, 2013-2018* (%)
Figure 6: Global Seismometer Granted Patents Share, By Trending Domain, 2013-2018* (%)
Figure 7: Global Seismometer Patents Granted, 2013-2018* (Units)
Figure 8: Seismometers Pricing Analysis, 2015-2023 ($)
Figure 9: Seismometers Market Lifecycle
Figure 10: U.S.: GDP and Population, 2012-2015 ($Trillion, Million)
Figure 11: U.S.: GDP – Composition of 2015, By Sector of Origin
Figure 12: U.S.: Export and Import Value, 2012-2015 ($Trillion)
Figure 13: Canada: GDP and Population, 2012-2015 ($Trillion, Million)
Figure 14: Canada: GDP – Composition of 2015, By Sector of Origin
Figure 15: Canada: Export and Import Value, 2012-2015 ($Billion)
Figure 16: Brazil: GDP and Population, 2012-2015 ($Trillion, Million)
Figure 17: Brazil: GDP – Composition of 2015, By Sector of Origin
Figure 18: Brazil: Export and Import Value, 2012-2015 ($Billion)
Figure 19: U.K.: GDP and Population, 2012-2015 ($Trillion, Million)
Figure 20: U.K.: GDP – Composition of 2015, By Sector of Origin
Figure 21: U.K.: Export and Import Value, 2012-2015 ($Billion)
Figure 22: Germany: GDP and Population, 2012-2015 ($Trillion, Million)
Figure 23: Germany: GDP – Composition of 2015, By Sector of Origin
Figure 24: Germany: Export and Import Value, 2012-2015 ($Billion)
Figure 25: France: GDP and Population, 2012-2015 ($Trillion, Million)
Figure 26: France: GDP – Composition of 2015, By Sector of Origin
Figure 27: France: Export and Import Value, 2012-2015 ($Billion)
Figure 28: China: GDP and Population, 2012-2015 ($Trillion, Million)
Figure 29: China: GDP – Composition of 2015, By Sector of Origin
Figure 30: China: Export and Import Value, 2012-2015 ($Billion)
Figure 31: Japan: GDP and Population, 2012-2015 ($Trillion, Million)
Figure 32: Japan: GDP – Composition of 2015, By Sector of Origin
Figure 33: Japan: Export and Import Value, 2012-2015 ($Billion)
Figure 34: South Korea: GDP and Population, 2012-2015 ($Trillion, Million)
Figure 35: South Korea: GDP – Composition of 2015, By Sector of Origin
Figure 36: South Korea: Export and Import Value, 2012-2015 ($Billion)
Figure 37: Guideline Geo Net Revenue, 2013-2016($Million)
Figure 38: OYO Corporation Net Sales, 2013-2016 ($Billion)
Figure 39: OYO Corporation Net Sales Share, By Business Segment, 2016 (%)
Figure 40: OYO Corporation Net Sales Share, By Geography, 2016 (%)
Figure 41: TUV NORD Group Net Sales, 2013-2016 ($Billion)
Figure 42: TUV NORD Group Net Sales Share, By Business Segment, 2016 (%)
Figure 43: TUV NORD Group Net Sales Share, By Geography, 2016 (%)