 Email
Email Print
Print


Motorsports Market Overview
The Motorsports Market size is set to grow at a CAGR of 7.2% during the forecast period 2024-2030 to reach $24.14 Billion by 2030. Growth in the formula racing format for electric vehicles, rising revenues in the Formula One racing championship, and growing popularity of motorsports among millennials through broadcasting and social networking platforms have boosted the motorsports market. Factors such as an increase in the number of races, advertisements, and sponsorships are driving the motorsports market forward. The sponsors make huge investments as these sports events are an ideal platform for the companies to promote their products. This racing entertainment attracts spectators and generates revenue for its products. Increasing safety features in auto racing vehicles, increasing promotional activities coupled with rising investments by sponsors across the globe in formula racing and drag racing as well as rallycross would propel the market growth during the forecast period.
Motorsports encompass a wide range of disciplines, including but not limited to car racing, motorcycle racing, karting, drag racing, and off-road racing. These events can take place on closed circuits, off-road tracks, or public roads, and they attract a global audience of enthusiasts and spectators. There is a growing emphasis on sustainability in motorsports. Racing series and teams are increasingly adopting eco-friendly practices, such as the use of electric or hybrid vehicles, sustainable fuels, and carbon offset programs to minimize their environmental impact. The rise of electric and hybrid technologies was transforming motorsports. Esports and digital motorsports experienced significant growth, with virtual racing competitions gaining prominence.
Report Coverage
The report: “Motorsports Industry Outlook – Forecast (2024-2030)” by IndustryARC, covers an in-depth analysis of the following segments in the Motorsports industry.
By Type: League Organizers and Promoters, Race teams, Track Owners/Runners.
By Channel: Broadcasting/Media Rights, Ticketing, Race Host Fees, Advertiser/Sponsorship, Merchandising, and Others.
By Race Series: One-Make Series (Porsche Supercup, Ferrari Challenge, Lamborghini Super Trofeo, Others), Touring Car Racing (World Touring Car Championship, BTCC, DTM, Others), Stock Car Racing (NASCAR, ARCA Menards Series, Others), GT Racing (GT Series World Challenge(Blacpain GT Series), Super GT, Intercontinental GT Challenge, Others), Endurance Racing (World Endurance Championship (WEC), IMSA WeatherTech SportsCar Championship, 24H Series, Others), Rally and Off-Road Racing (World Rally Championship (WRC), European Rally Championship (ERC), Dakar Rally, SCORE International Off-Road Racing, Extreme E, NHRA Drag Racing Series, Others), Formula Racing (Formula 1, Formula 2, Formula E, IndyCar, Others), Motorbike Racing (MotoGP, WorldSBK, FIM EWC, SuperMotoCross Championship (MX), British SuperBikes (BSB), MotoCross World Championship (MXGP), MotoAmerica Superbike Championship, Others.
By Geography: North America (U.S., Canada, Mexico), South America (Brazil, Argentina, Others), APAC (India, Japan, China, South Korea, Malaysia, Australia, Singapore and Others), Europe (Germany, France, UK, Italy, Spain, Russia, Netherlands, Switzerland, Belgium, and Others), Middle East, Africa (GCC, Other Middle East, Africa).
Key Takeaways
• The players of this market are taking more strategic steps for the expansion of the market through new product launches, acquisitions, investments and others; and to showcase their engineering capabilities, which in turn affects the brand value of the organizations, thereby driving the growth of global motorsports market during the forecast period 2024-2030.
• In December 2023, Mahindra & Mahindra Ltd. (M&M Ltd.), one of India’s leading automotive companies, announced that its overall auto sales for the month of November 2023 stood at 70,576 vehicles, a growth of 21%, including exports. In the utility vehicles segment, Mahindra sold 39,981 vehicles in the domestic market, a growth of 32% and overall, 40,764 vehicles, including exports. The domestic sales for commercial vehicles stood at 22,211.
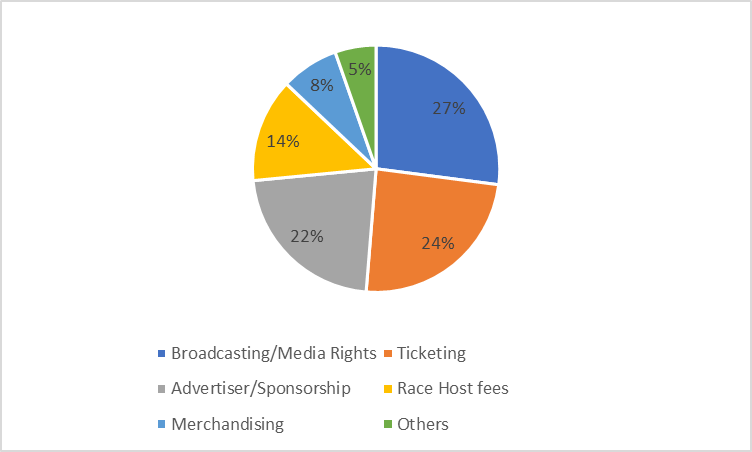
Global Motorsports Market Value Share, By Channel, 2023 (%)
For More Details On this report - Request For Sample
Motorsports Industry Outlook - by Race Series
The formula Racing segment held the major market share of 53.50% in 2023, with a CAGR of around 7.9% during the forecast period 2024-2030. The growth is mainly attributed to a rising partnership of brands and television rights holders, the emergence of new sporting power, a greater fusion of sports and entertainment, rising popularity of live sports on OTT and social media platforms. In March 2020, the Renault F1 team and DP world have signed an agreement making DP World the global logistics partner and the title partner of the team which will become the Renault DP World F1 team. The partnership helps explore opportunities to increase the efficiency of their supply chain including improved powertrain and engine development. In April 2020, Disney revealed plans to acquire Formula 1 Racing from Liberty Media for over $4 billion. Liberty Media has sold off its ownership of the sport after just three years at the helm. This acquisition was done with a vision to rebuild the program layout as a part of making the sport more entertaining. Furthermore, Touring Car Racing was analyzed to witness the highest growth with a CAGR of 15.9% during 2024-2030. The growing adoption of aggressive digital strategy in world touring car championships such as the introduction of a new interactive show with WTCC drivers on each event exclusively for digital broadcasting is welcoming a larger audience and recruiting new generation of fans. Factors like the incorporation of new program formats are analyzed to fuel the market growth in future years.
Motorsports Industry Segment Analysis - by Channel
The broadcasting segment is analyzed to estimate the motorsports market with a CAGR of CAGR of 7.8% during the forecast period 2024-2030. Motorsports broadcasting service includes live-streaming, recorded videos or highlights of the competition through television or OTT platform. The burgeoning demand for high-speed access to watch all racing events including NASCAR, NHRA, MotoGP, F1, Indycar, ARCA, WRC, WTCC, WEC, Superbike, Supercross, Motocross, Ferrari Challenge, Supercar and much more live streaming at a very affordable price has increased the adoption of premium subscription services. Meanwhile, a host of Chinese companies are investing in events, broadcast rights, teams, facilities and leagues at home and abroad, as encouraged by the government. Along with this, rights holders, brands and broadcasters increasingly exploring new formats and scheduling events, which in turn is contributing to the growth of the market. Broadcasters and media channels arrange rights agreements directly with the individual sanctioning bodies. Broadcasters receive revenue from corporate sponsors and advertisers for promotional airtime during race events. Strong television performance and the ongoing popularity of motorsports events are important because they help drive incremental advertising revenue. In addition, broadcasters play a significant role in promoting the sport by providing strong graphics, production values, music and talent, which all add to an exciting broadcast experience for fans.
Motorsports Market Segment Analysis - Geography
North America dominated the Motorsports Market, with a market share of 38.89% in 2023 and estimated to reach with a CAGR of 6.5% during the forecast period 2024-2030 due to its vibrant motorsports culture and an extensive infrastructure that supports a diverse range of racing events. The region is home to some of the most renowned and prominent racing series, including NASCAR and IndyCar, which are widely popular and draw large crowds. Major racing facilities, such as Daytona International Speedway and the Indianapolis Motor Speedway, provide cutting-edge settings for high-profile events. These venues not only cater to ardent fans, but they also function as technological innovation and advancement hubs in racing technology. The North American motorsports market benefits from a thriving ecosystem of teams, sponsors, and vehicle manufacturers who actively participate in and contribute to the industry's development. The region's commitment to innovation, safety standards, and fan involvement via digital platforms solidifies its role as a driving factor behind the region's sustained success.
Motorsports Market Drivers
The growing popularity of Motorsports is driving the market:
Motorsports events generate a huge amount of revenue and contribute towards economic development, which is a major growth-driving factor of this market. The fact that the motorsports market has done an exemplary balance in presenting technical coverage and keeping personal information private by educating their supporters further boosts the market’s appeal and revenue generation potential. A major demonstration of the point above is the increased fan interactions and viewership of F1 Live from London in July 2022. EETech, a global participant in technological data, communities and eCommerce within the automation and electronics industries, confirmed their multifaceted relationship with RWR and Team SR2's #51 Indy car on March 30, 2023. The NTT INDYCAR SERIES is broadcast in 223 markets in 142 nations, with 17 events held in North America. On March 3, 2022, BWR Motorsports GmbH created cutting-edge technology that allows critical tire Dynamic Mechanical Analysis (DMA) tests to take place on the racecourse. The MOTITE portable tire testing equipment is the appropriate solution for race teams in series such as Formula One and WEC to evaluate tire grip levels and rank the tires on track.
Adoption of new business models is one of the major factors creating opportunities for the motorsports market:
Amidst the Covid-19 breakout, many motorsports organizations were adopting many new business models including organizing virtual racing events to overcome, a difficult situation where fans were not able to enjoy these events like before, which in turn will create more opportunities for the motorsports market during the forecast period 2024-2030. TVS Motor Company, an Indian two-wheeler manufacturer, announced an agreement to collaborate with PETRONAS, an international energy group, to sponsor TVS Racing, India's first factory racing team, on April 25, 2022. The implementation of innovative business models is critical to the growth of the motorsports market. By embracing new and diverse techniques, industry stakeholders can open up new revenue streams beyond traditional sources such as ticket sales and sponsorships. Motorsports organisations might explore collaborations with technology companies, gaming platforms, and digital content makers to gain a larger audience. Incorporating virtual reality experiences, developing mobile applications, and using social media platforms, for example, can greatly increase fan involvement. These technology developments not only serve existing fans but also attract new enthusiasts, adding to the overall growth of the racing industry.
Motorsports Market Challenges
Negative Environmental effects are impeding the growth of the market:
Even though the motorsports market is growing over the years, but the associated environmental risks are creating hurdles to the growth of this market. These motorsports vehicles cause air pollution as well as noise pollution and create negative impacts on the environment. The negative environmental effects linked with the business have had a substantial impact on the expansion of the racing market. Motorsports have come under attack for their significant carbon footprint and resource-intensive nature in a moment when environmental consciousness is on the rise globally. The general population, which is becoming more aware of climate change and air pollution, has raised worry about the environmental impact of racing events. The industry's reputation and market appeal have suffered as a result of this shift in public attitude. Furthermore, strict environmental restrictions and emission requirements provide obstacles for motorsports, particularly those that rely on combustion engines. Motorsports events that are viewed as contributing to environmental decline may find it difficult to get financial support, limiting their potential to develop and innovate, since sponsors and investors prioritise ecologically friendly ventures. As a result, negative environmental consequences are a significant component dictating the future of the racing market, demanding an update of methods in order to comply with sustainable and eco-friendly principles.
Motorsports Industry Outlook
Product launches, acquisitions and R&D activities are key strategies adopted by players in the Motorsports market. The key players in the Motorsports market include
- Mercedes
- Ferrari
- Red Bull
- Mclaren Racing
- Alpine
- Aston Martin
- Alfa Romeo/Alfa Corse
- Hendrick Motorsports
- Ducati
- Joe Gibbs Racing
Recent Developments
• On December 2023, Joe Gibbs Racing (JGR) announced today their driver and crew chief lineup for the 2024 NASCAR Xfinity Series season. The team will field four Toyota GR Supras – two with full-time drivers and two with a rotating schedule of part-time drivers. The lineup will be headlined by Sheldon Creed driving the No. 18 GR Supra and Chandler Smith piloting the No. 81 GR Supra. Aric Almirola and John Hunter Nemechek will split driving duties of the team’s No. 20 entry while the No. 19 GR Supra will be driven by Ryan Truex, William Sawalich, Joe Graf Jr., and Taylor Gray.
• On January 2023, Mercedes-Benz finishes 2022 with strong Top-End and Battery Electric Vehicle deliveries. The world's most valuable luxury automotive brand finished 2022 with a strong final quarter, delivering 540,800 Mercedes-Benz Passenger Cars (+17%) to customers and achieving a rise in Top-End and Battery Electric Vehicle (BEV) sales. The October to December period marked the best quarter in 2022 for Top-End vehicles with sales up 14% thanks to robust demand in most regions, despite ongoing COVID measures, semiconductor, and logistic bottlenecks throughout the year.
• On November 2023, Aston Martin illuminates the FORMULA 1 HEINEKEN SILVER LAS VEGAS GRAND PRIX with largest ever F1® race weekend marketing presence. Partnership with Las Vegas Grand Prix sees Aston Martin models DBX707 and DB12 star on Sphere’s Exosphere – the largest LED screen on Earth. Las Vegas Grand Prix is Aston Martin’s most significant race weekend celebration to date, with DBX707 to be unleashed on the Las Vegas Strip Circuit™.
For more Automotive Market reports, please click here
1. Motorsports Market Overview
1.1 Definitions and Scope
2. Motorsports Market - Executive Summary
2.1 Market Revenue, Market Size and Key Trends by Company
2.2 Key trends By Race Series
2.3 Key trends segmented by Geography
3. Motorsports Market – Market Landscape
3.1 Comparative Analysis
3.1.1 Top 5 Financial Analysis
3.1.2 Market Value Split by Top 5 Companies
3.1.3 Pricing Analysis (Comparison of General Price Offerings in the Market)
4. Motorsports Market – Industry Market Entry Scenario Premium Premium (Premium)
4.1 Regulatory Framework
4.2 Case Studies
4.3 Ease of Doing Business Index
4.4 Customer Analysis
5. Motorsports Market – Startup Company Scenario (Premium)
5.1 Startup Company Analysis
5.2 Venture Capital Funding Scenario
6. Motorsports Market - Market Forces
6.1 Market Drivers
6.2 Market Constraints
6.3 Porter's five force model
6.3.1 Bargaining power of suppliers
6.3.2 Bargaining powers of customers
6.3.3 Threat of new entrants
6.3.4 Rivalry among existing players
6.3.5 Threat of substitutes
7. Motorsports Market – By Strategic Analysis
7.1 Value Chain Analysis
7.2 Opportunities Analysis
8. Motorsports Market – By Race Series (Market Size - $Million/Billion)
8.1. One-Make Series
8.1.1. Porsche Supercup
8.1.2. Ferrari Challenge
8.1.3. Lamborghini Super Trofeo
8.1.4. Others
8.2. Touring Car Racing
8.2.1. World Touring Car Championship
8.2.2. BTCC
8.2.3. DTM
8.2.4. Others
8.3. Stock Car Racing
8.3.1. NASCAR
8.3.2. ARCA Menards Series
8.3.3. Others
8.4. GT Racing
8.4.1. GT Series World Challenge (Blacpain GT Series)
8.4.2. Super GT
8.4.3. Intercontinental GT Challenge
8.4.4. Others
8.5. Endurance Racing
8.5.1. World Endurance Championship (WEC)
8.5.2. IMSA WeatherTech SportsCar Championship
8.5.3. 24H Series
8.5.4. Others
8.6. Rally and Off-Road Racing
8.6.1. World Rally Championship (WRC)
8.6.2. European Rally Championship (ERC)
8.6.3. Dakar Rally
8.6.4. SCORE International Off-Road Racing
8.6.5. Extreme E
8.6.6. NHRA Drag Racing Series
8.6.7. Others
8.7. Formula Racing
8.7.1. Formula 1
8.7.2. Formula 2
8.7.3. Formula E
8.7.4. IndyCar
8.7.5. Others
8.8. Motorbike Racing
8.8.1. MotoGP
8.8.2. WorldSBK
8.8.3. FIM EWC
8.8.4. SuperMotoCross Championship (MX)
8.8.5. British SuperBikes (BSB)
8.8.6. MotoCross World Championship (MXGP)
8.8.7. MotoAmerica Superbike Championship
8.8.8. Others
9. Motorsports Market – By Channel (Market Size - $Million/Billion)
9.1. League Organizers and Promoters
9.2. Race teams
9.3. Track Owners/Runners
10. Motorsports Market – By Channel (Market Size - $Million/Billion)
10.1. Broadcasting/Media Rights
10.2. Ticketing
10.3. Race Host Fees
10.4. Advertiser/Sponsorship
10.5. Merchandising
10.6. Others
11. Motorsports Market - By Geography (Market Size - $Million/Billion)
11.1 North America
11.1.1 U.S.
11.1.2 Canada
11.1.3 Mexico
11.2 South America
11.2.1 Brazil
11.2.2 Argentina
11.2.3 Others
11.3 Europe
11.3.1 Germany
11.3.2 France
11.3.3 UK
11.3.4 Italy
11.3.5 Spain
11.3.6 Russia
11.3.7 Netherlands
11.3.8 Switzerland
11.3.9 Belgium
11.3.10 Others
11.4 APAC
11.4.1 India
11.4.2 Japan
11.4.3 China
11.4.4 South Korea
11.4.5 Malaysia
11.4.6 Australia
11.4.7 Singapore
11.4.8 Others
11.5 Middle East & Africa
11.5.1 GCC
11.5.2 Other Middle East
11.5.3 Africa
12. Motorsports Market - Market Entropy
12.1 M&A's, collaborations, JVs and partnerships
13. Motorsports Market – Industry Competition Landscape (Premium)
13.1 Market Share – Global
13.2 Market Share – By Region
13.3 Market Share by Race Series
14. Motorsports Market – Key Company List By Country (Premium)
15. Motorsports Market - Company Analysis
15.1 Mercedes
15.2. Ferrari
15.3. Red Bull
15.4. Mclaren Racing
15.5. Alpine
15.6. Aston Martin
15.7. Alfa Romeo/Alfa Corse
15.8. Hendrick Motorsports
15.9. Ducati
15.10. Joe Gibbs Racing
* "Financials would be provided to private companies on best-efforts basis ."
Connect with our experts to get customized reports that best suit your requirements. Our reports include global-level data, niche markets and competitive landscape.
List of Tables:
Table 1. Global Motorsports Market Revenue, 2013 – 2019 ($Billion)
Table 2. U.S. Nascar And Indycar Racing Market Revenue, 2013-2019 ($Million)
Table 3. Nascar’s National Events (North America)
Table 4. F1 Team Budget, By Teams, 2013 ($Million)
Table 5. Broadcasting Revenue In Motorsports Market, 2013 – 2019 ($Million)
Table 6. Americas Motorsports Broadcasting Market, By Country, 2013 - 2019 ($Million)
Table 7. U.S. Nascar And Indycar Racing Broadcasting Revenue, 2013-2019 ($Million)
Table 8. Europe Motorsports Broadcasting Market, By Country, 2013 - 2019 ($Million)
Table 9. Apac Broadcasting Market Revenue, By Country, 2013 – 2019 ($Million)
Table 10. Ticketing Revenue In Motorsports Market, By Region, 2013 – 2019 ($Million)
Table 11. Americas Motorsport Ticketing Revenue, By Country, 2013 – 2019 ($Million)
Table 12. U.S. Nascar And Indycar Racing Ticketing Revenue, 2013-2019 ($Million)
Table 13. Europe Motorsport Ticketing Revenue, By Country, 2013 – 2019 ($Million)
Table 14. Apac Motorsport Ticketing Revenue, By Country, 2013 – 2019 ($Million)
Table 15. Market Merchandising Revenue, By Region, 2013 – 2019 ($Million)
Table 16. Americas Motorsport Merchandising Revenue, By Country, 2013 – 2019 ($Million)
Table 17. U.S. Nascar And Indycar Racing Merchandising Revenue, 2013-2019 ($Million)
Table 18. Europe Motorsports Merchandising Market Revenue, By Country, 2013 – 2019 ($Million)
Table 19. Apac Motorsports Merchandising Market Revenue, By Country, 2013 – 2019 ($Million)
Table 20. Sponsorship Revenue In Motorsports Market, By Region, 2013 – 2019 ($Million)
Table 21. Market Sponsorship Revenue, By Sponsors Industry Type, 2013 (%)
Table 22. Americas Motorsport Sponsorship Revenue, By Country, 2013 – 2019 ($Million)
Table 23. U.S. Nascar And Indycar Racing Advertising& Sponsorships Revenue 2013-2019 ($Million)
Table 24. Europe Motorsports Sponsorship Market Revenue, By Country, 2013 – 2019 ($Million)
Table 25. Apac Motorsport Sponsorship Market Revenue, By Country, 2013 – 2019 ($Million)
Table 26. Race Hosting Fees Revenue In Motorsports Market, By Region, 2013 – 2019 ($Million)
Table 27. Cost Of Hosting Formula One Grand Prix, 2013 ($Million)
Table 28. Americas Race Hosting Fees In Motorsports Market, By Country, 2013 – 2019 ($Million)
Table 29. U.S. Nascar And Indycar Race Hosting Fee E Stimation, 2013-2019 ($Million)
Table 30. Europe Race Hosting Fees In Motorsports Market, By Country, 2013 – 2019 ($Million)
Table 31. Apac Race Hosting Fees In Market, By Country, 2013 – 2019 ($Million) Table 32. Global Market, By Revenue Channels, 2013 - 2019 ($Billion)
Table 33. Global Market Revenue, By Region, 2013 – 2019 ($Million)
Table 34. Americas Market Revenue, By Country, 2013 – 2019 ($Million)
Table 35. U.S. Nascar Racing Market Revenue, 2013 – 2019 ($Million)
Table 36. U.S. Indycar Racing Market Estimation, 2013-2019($Million)
Table 37. Apac Motorsports Market Revenue, By Country, 2013 – 2019 ($Million)
Table 38. Europe Motorsports Market Revenue, By Country, 2013 – 2019 ($Million)
Table 39. Bridgestone Revenue, By Business Segment (Tires), 2009-2013($Billion)
Table 40. Cosan Lubricants, Net Sales, 2010-2012($Million)
Table 41. Computacenter, Total Revenue, 2011-2013($Million)
Table 42. Total Revenue Of Goodyear In North America, 2011-2013 ($Million)
Table 43. Total Revenue Of Goodyear In Europe, Middle East And Africa, 2011-2013 ($Million)
Table 44. Total Revenue Of Goodyear In Latin America, 2011-2013($Million)
Table 45. Total Revenue Of Goodyear In Asia Pacific, 2011-2013(In$Million)
Table 46. Overall Sales: Mclaren Automotive Ltd. 2012-2013 ($Million)
Table 47. Mercedes-Benz Gmbh Net Revenue, 2011-13 ($Million)
Table 48. Mrf Limited Total Revenue 2011-2013 ($Million)
Table 49. Pirelli Total Revenue And R&D Expenditure, 2011-2013($Million)
Table 50. Williams Revenues (2012-2013) ($Million)
Table 51. Yokohama Total Revenue 2011-2013 ($Billion)
Table 52. Yokohama Company R&D, 2010 – 2013 ($Billion)
List of Figures:
Figure 1. U.S. : Nascar Racing Market Revenue, By Segment, 2014 & 2019 ($Million)
Figure 2. U.S. Indycar Racing Market Revenue, 2014 & 2019 ($Million)
Figure 3. U.S. Nascar And Indycar Racing Market Revenue, 2013-2019 ($Million)
Figure 4. Formaula One Team Expenses Distribution, 2013 (%)
Figure 5. Global Motorsports Broadcasting Market-By Region (%), 2013
Figure 6. Americas Motorsports Broadcasting Market-By Country (%), 2013
Figure 7. Europe Motorsports Broadcasting Market-By Country (%), 2013
Figure 8. Apac Motorsports Broadcasting Market-By Country (%), 2013
Figure 9. Global Motorsports Market-By Revenue Channels (In %), 2013
Figure 10. Global Market-By Regions (In %), 2013 Figure 11. Americas Market-By Country (In %), 2014
Figure 12. Europe Market Revenue, By Country, 2013 (%)
Figure 13. Global Market – Product Launches (2011-2014)
Figure 14. Global Market – Product Launches – By Key Players (2013-14)
Figure 15. Global Motorsports Market – M&A's, Collaborations, Jv's & Partnerships, By No. Of Developments (2011-14)
Figure 16. Global Motorsports Market – By M&A's, Collaborations, Jv's & Partnerships
Figure 17. Computacenter, Total Revenue, By Geography, 2013(%)
Figure 18. The Region Wise Net Sales Market Share By In Values ($ 2.7 Bn) Breakdown
Figure 19. Sales By Value In Tons Breakdown
Figure 20. Company’s Sales By Region For The Year 2013.
Figure 21. Yokohama Business Unit Revenue Share, 2013 (%)