 Email
Email Print
Print


Low Dropout (LDO) Regulator Market - Forecast(2024 - 2030)
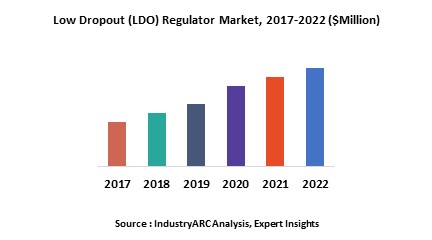
LDO or low-dropout regulator is a DC (Direct Current) voltage regulator which regulates the output voltage during the situations where there is difference between input voltage and output voltage is low. These regulators offers a "dropout" which can also be technically defined as difference between input and output voltage of less than 0.3V whereas a standard linear voltage regulator offers a dropout voltage of 1 Volt or more. An LDO finds its use in different industries based on certain characteristics such as the LDO’s drop-out voltage, line regulation, speed (how fast it can respond as the load varies), load regulation, quiescent current, and maximum current (which is decided by the size of the pass transistor), among others. Globally increasing demand for the consumer electronics is expected to remain one of the major growth driver for LDO during the period of study.
This report identifies the global LDO regulator market size in for the year 2015-2017, and forecast of the same for year 2022. It also highlights the potential growth opportunities in the coming years, while also reviewing the market drivers, restraints, growth indicators, challenges, market dynamics, competitive landscape, and other key aspects with respect to global LDO regulator market.
Geographically North America dominated global LDO regulator market owing to higher consumption and demand of consumer electronics devices and technological advancement in the field of telecommunications. North America was followed by Asia-Pacific and Europe as the second and third largest market for LDO regulator in 2015. However, Asia-Pacific is expected to remain fastest growing regional market driven by increasing consumption of consumer electronics as a result of increasing disposable income amongst middle class families in the major economies of India and China.
This report segments LDO regulator market on the basis of applications, end use industry and regional market as follows:
- On the basis of applications this report on global LDO regulator market is segmented as follows, covering all major applications of the LDO regulator as follows: Low-Dropout for Digital Loads, Low-Dropout for Radio Frequency Loads, Low-Dropout for Analog Loads
- On the basis of end use industry this report on global LDO regulator market is segmented as follows, covering all end use industries of the LDO regulator as follows: telecommunication, aircraft, cellular phones, and others
- This report on LDO regulator has been further segmented into major regions, which includes detailed analysis of each region such as: North America, Europe, Asia-Pacific (APAC), and Rest of the World (RoW) covering all the major country level markets in each of the region
Sample Companies Profiled in this Report are:
- ON Semiconductors
- Microchip Technology
- STMicroelectronics
- Texas Instruments Incorporated
- Linear Technology
- 30+.
1. Low Dropout (LDO) Regulator Market – Overview
2. Executive Summary
3. Market Landscape
3.1. Market Share Analysis
3.2. Comparative Analysis
3.3. Product Benchmarking
3.4. End User Profiling
3.5. Top 5 Financials Analysis
4. Low Dropout (LDO) Regulator Market– Forces
4.1. Drivers
4.1.1. Increasing demand for consumer electronics, and circuitry such as microprocessors and microcontrollers
4.1.2. Increased demand for portable and wireless application
4.2. Restraints
4.2.1. Increasing raw material cost
4.2.2. High expenses on maintenance
4.3. Opportunities
4.4. Challenges
4.5. Porter’s Five Forces Analysis
4.5.1. Bargaining Power of Suppliers
4.5.2. Bargaining Power of Buyers
4.5.3. Threat of New Entrants
4.5.4. Threat of Substitutes
4.5.5. Degree of Competition
5. Low Dropout (LDO) Regulator Market – Strategic Analysis
5.1. Value Chain Analysis
5.2. Pricing Analysis
5.3. Opportunities Analysis
5.4. Product/Market Life cycle Analysis
5.5. Suppliers & Distributors
6. Low Dropout (LDO) Regulator Market, By Applications
6.1. Low-Dropout for Digital Loads
6.2. Low-Dropout for Radio Frequency Loads
6.3. Low-Dropout for Analog Loads
7. Low Dropout (LDO) Regulator Market, By End Use Industry
7.1. Telecommunication
7.2. Aircraft
7.3. Cellular Phones
7.4. Others
8. Low Dropout (LDO) Regulator Market, By Geography
8.1. Europe
8.1.1. Germany
8.1.2. France
8.1.3. Italy
8.1.4. Spain
8.1.5. Russia
8.1.6. U.K.
8.1.7. Rest of Europe
8.2. Asia Pacific
8.2.1. China
8.2.2. India
8.2.3. Japan
8.2.4. South Korea
8.2.5. Rest of Asia-Pacific
8.3. North America
8.3.1. U.S.
8.3.2. Canada
8.3.3. Mexico
8.4. Rest of the World (RoW)
8.4.1. Middle East
8.4.2. South America
8.4.3. Africa
9. Low Dropout (LDO) Regulator – Market Entropy
9.1. Expansion
9.2. Technological Developments
9.3. Merger & Acquisitions, and Joint Ventures
9.4. Supply- Contract
10. Company Profiles (Overview, Financials, SWOT Analysis, Developments, Product Portfolio)
10.1. Company 1
10.2. Company 2
10.3. Company 3
10.4. Company 4
10.5. Company 5
10.6. Company 6
10.7. Company 7
10.8. Company 8
10.9. Company 9
10.10. Company 10
*More than 10 Companies are profiled in this Research Report, Complete List available on Request*
"*Financials would be provided on a best efforts basis for private companies"
11. Appendix
11.1. Abbreviations
11.2. Sources
11.3. Research Methodology
11.4. Bibiliography
11.5. Compilation of Expert Insights
11.6. Disclaimer
List of Tables
Table1: Low Dropout (LDO) Regulator Market Overview 2019-2024
Table2: Low Dropout (LDO) Regulator Market Leader Analysis 2018-2019 (US$)
Table3: Low Dropout (LDO) Regulator Market Product Analysis 2018-2019 (US$)
Table4: Low Dropout (LDO) Regulator Market End User Analysis 2018-2019 (US$)
Table5: Low Dropout (LDO) Regulator Market Patent Analysis 2013-2018* (US$)
Table6: Low Dropout (LDO) Regulator Market Financial Analysis 2018-2019 (US$)
Table7: Low Dropout (LDO) Regulator Market Driver Analysis 2018-2019 (US$)
Table8: Low Dropout (LDO) Regulator Market Challenges Analysis 2018-2019 (US$)
Table9: Low Dropout (LDO) Regulator Market Constraint Analysis 2018-2019 (US$)
Table10: Low Dropout (LDO) Regulator Market Supplier Bargaining Power Analysis 2018-2019 (US$)
Table11: Low Dropout (LDO) Regulator Market Buyer Bargaining Power Analysis 2018-2019 (US$)
Table12: Low Dropout (LDO) Regulator Market Threat of Substitutes Analysis 2018-2019 (US$)
Table13: Low Dropout (LDO) Regulator Market Threat of New Entrants Analysis 2018-2019 (US$)
Table14: Low Dropout (LDO) Regulator Market Degree of Competition Analysis 2018-2019 (US$)
Table15: Low Dropout (LDO) Regulator Market Value Chain Analysis 2018-2019 (US$)
Table16: Low Dropout (LDO) Regulator Market Pricing Analysis 2019-2024 (US$)
Table17: Low Dropout (LDO) Regulator Market Opportunities Analysis 2019-2024 (US$)
Table18: Low Dropout (LDO) Regulator Market Product Life Cycle Analysis 2019-2024 (US$)
Table19: Low Dropout (LDO) Regulator Market Supplier Analysis 2018-2019 (US$)
Table20: Low Dropout (LDO) Regulator Market Distributor Analysis 2018-2019 (US$)
Table21: Low Dropout (LDO) Regulator Market Trend Analysis 2018-2019 (US$)
Table22: Low Dropout (LDO) Regulator Market Size 2018 (US$)
Table23: Low Dropout (LDO) Regulator Market Forecast Analysis 2019-2024 (US$)
Table24: Low Dropout (LDO) Regulator Market Sales Forecast Analysis 2019-2024 (Units)
Table25: Low Dropout (LDO) Regulator Market , Revenue & Volume, By Applications, 2019-2024 ($)
Table26: Low Dropout (LDO) Regulator Market By Applications, Revenue & Volume, By Low-Dropout for Digital Loads, 2019-2024 ($)
Table27: Low Dropout (LDO) Regulator Market By Applications, Revenue & Volume, By Low-Dropout for Radio Frequency Loads, 2019-2024 ($)
Table28: Low Dropout (LDO) Regulator Market By Applications, Revenue & Volume, By Low-Dropout for Analog Loads, 2019-2024 ($)
Table29: Low Dropout (LDO) Regulator Market , Revenue & Volume, By End Use Industry, 2019-2024 ($)
Table30: Low Dropout (LDO) Regulator Market By End Use Industry, Revenue & Volume, By Telecommunication, 2019-2024 ($)
Table31: Low Dropout (LDO) Regulator Market By End Use Industry, Revenue & Volume, By Aircraft, 2019-2024 ($)
Table32: Low Dropout (LDO) Regulator Market By End Use Industry, Revenue & Volume, By Cellular Phones, 2019-2024 ($)
Table33: North America Low Dropout (LDO) Regulator Market , Revenue & Volume, By Applications, 2019-2024 ($)
Table34: North America Low Dropout (LDO) Regulator Market , Revenue & Volume, By End Use Industry, 2019-2024 ($)
Table35: South america Low Dropout (LDO) Regulator Market , Revenue & Volume, By Applications, 2019-2024 ($)
Table36: South america Low Dropout (LDO) Regulator Market , Revenue & Volume, By End Use Industry, 2019-2024 ($)
Table37: Europe Low Dropout (LDO) Regulator Market , Revenue & Volume, By Applications, 2019-2024 ($)
Table38: Europe Low Dropout (LDO) Regulator Market , Revenue & Volume, By End Use Industry, 2019-2024 ($)
Table39: APAC Low Dropout (LDO) Regulator Market , Revenue & Volume, By Applications, 2019-2024 ($)
Table40: APAC Low Dropout (LDO) Regulator Market , Revenue & Volume, By End Use Industry, 2019-2024 ($)
Table41: Middle East & Africa Low Dropout (LDO) Regulator Market , Revenue & Volume, By Applications, 2019-2024 ($)
Table42: Middle East & Africa Low Dropout (LDO) Regulator Market , Revenue & Volume, By End Use Industry, 2019-2024 ($)
Table43: Russia Low Dropout (LDO) Regulator Market , Revenue & Volume, By Applications, 2019-2024 ($)
Table44: Russia Low Dropout (LDO) Regulator Market , Revenue & Volume, By End Use Industry, 2019-2024 ($)
Table45: Israel Low Dropout (LDO) Regulator Market , Revenue & Volume, By Applications, 2019-2024 ($)
Table46: Israel Low Dropout (LDO) Regulator Market , Revenue & Volume, By End Use Industry, 2019-2024 ($)
Table47: Top Companies 2018 (US$)Low Dropout (LDO) Regulator Market , Revenue & Volume
Table48: Product Launch 2018-2019Low Dropout (LDO) Regulator Market , Revenue & Volume
Table49: Mergers & Acquistions 2018-2019Low Dropout (LDO) Regulator Market , Revenue & Volume
List of Figures
Figure 1: Overview of Low Dropout (LDO) Regulator Market 2019-2024
Figure 2: Market Share Analysis for Low Dropout (LDO) Regulator Market 2018 (US$)
Figure 3: Product Comparison in Low Dropout (LDO) Regulator Market 2018-2019 (US$)
Figure 4: End User Profile for Low Dropout (LDO) Regulator Market 2018-2019 (US$)
Figure 5: Patent Application and Grant in Low Dropout (LDO) Regulator Market 2013-2018* (US$)
Figure 6: Top 5 Companies Financial Analysis in Low Dropout (LDO) Regulator Market 2018-2019 (US$)
Figure 7: Market Entry Strategy in Low Dropout (LDO) Regulator Market 2018-2019
Figure 8: Ecosystem Analysis in Low Dropout (LDO) Regulator Market 2018
Figure 9: Average Selling Price in Low Dropout (LDO) Regulator Market 2019-2024
Figure 10: Top Opportunites in Low Dropout (LDO) Regulator Market 2018-2019
Figure 11: Market Life Cycle Analysis in Low Dropout (LDO) Regulator Market
Figure 12: GlobalBy ApplicationsLow Dropout (LDO) Regulator Market Revenue, 2019-2024 ($)
Figure 13: GlobalBy End Use IndustryLow Dropout (LDO) Regulator Market Revenue, 2019-2024 ($)
Figure 14: Global Low Dropout (LDO) Regulator Market - By Geography
Figure 15: Global Low Dropout (LDO) Regulator Market Value & Volume, By Geography, 2019-2024 ($)
Figure 16: Global Low Dropout (LDO) Regulator Market CAGR, By Geography, 2019-2024 (%)
Figure 17: North America Low Dropout (LDO) Regulator Market Value & Volume, 2019-2024 ($)
Figure 18: US Low Dropout (LDO) Regulator Market Value & Volume, 2019-2024 ($)
Figure 19: US GDP and Population, 2018-2019 ($)
Figure 20: US GDP – Composition of 2018, By Sector of Origin
Figure 21: US Export and Import Value & Volume, 2018-2019 ($)
Figure 22: Canada Low Dropout (LDO) Regulator Market Value & Volume, 2019-2024 ($)
Figure 23: Canada GDP and Population, 2018-2019 ($)
Figure 24: Canada GDP – Composition of 2018, By Sector of Origin
Figure 25: Canada Export and Import Value & Volume, 2018-2019 ($)
Figure 26: Mexico Low Dropout (LDO) Regulator Market Value & Volume, 2019-2024 ($)
Figure 27: Mexico GDP and Population, 2018-2019 ($)
Figure 28: Mexico GDP – Composition of 2018, By Sector of Origin
Figure 29: Mexico Export and Import Value & Volume, 2018-2019 ($)
Figure 30: South America Low Dropout (LDO) Regulator Market Value & Volume, 2019-2024 ($)
Figure 31: Brazil Low Dropout (LDO) Regulator Market Value & Volume, 2019-2024 ($)
Figure 32: Brazil GDP and Population, 2018-2019 ($)
Figure 33: Brazil GDP – Composition of 2018, By Sector of Origin
Figure 34: Brazil Export and Import Value & Volume, 2018-2019 ($)
Figure 35: Venezuela Low Dropout (LDO) Regulator Market Value & Volume, 2019-2024 ($)
Figure 36: Venezuela GDP and Population, 2018-2019 ($)
Figure 37: Venezuela GDP – Composition of 2018, By Sector of Origin
Figure 38: Venezuela Export and Import Value & Volume, 2018-2019 ($)
Figure 39: Argentina Low Dropout (LDO) Regulator Market Value & Volume, 2019-2024 ($)
Figure 40: Argentina GDP and Population, 2018-2019 ($)
Figure 41: Argentina GDP – Composition of 2018, By Sector of Origin
Figure 42: Argentina Export and Import Value & Volume, 2018-2019 ($)
Figure 43: Ecuador Low Dropout (LDO) Regulator Market Value & Volume, 2019-2024 ($)
Figure 44: Ecuador GDP and Population, 2018-2019 ($)
Figure 45: Ecuador GDP – Composition of 2018, By Sector of Origin
Figure 46: Ecuador Export and Import Value & Volume, 2018-2019 ($)
Figure 47: Peru Low Dropout (LDO) Regulator Market Value & Volume, 2019-2024 ($)
Figure 48: Peru GDP and Population, 2018-2019 ($)
Figure 49: Peru GDP – Composition of 2018, By Sector of Origin
Figure 50: Peru Export and Import Value & Volume, 2018-2019 ($)
Figure 51: Colombia Low Dropout (LDO) Regulator Market Value & Volume, 2019-2024 ($)
Figure 52: Colombia GDP and Population, 2018-2019 ($)
Figure 53: Colombia GDP – Composition of 2018, By Sector of Origin
Figure 54: Colombia Export and Import Value & Volume, 2018-2019 ($)
Figure 55: Costa Rica Low Dropout (LDO) Regulator Market Value & Volume, 2019-2024 ($)
Figure 56: Costa Rica GDP and Population, 2018-2019 ($)
Figure 57: Costa Rica GDP – Composition of 2018, By Sector of Origin
Figure 58: Costa Rica Export and Import Value & Volume, 2018-2019 ($)
Figure 59: Europe Low Dropout (LDO) Regulator Market Value & Volume, 2019-2024 ($)
Figure 60: U.K Low Dropout (LDO) Regulator Market Value & Volume, 2019-2024 ($)
Figure 61: U.K GDP and Population, 2018-2019 ($)
Figure 62: U.K GDP – Composition of 2018, By Sector of Origin
Figure 63: U.K Export and Import Value & Volume, 2018-2019 ($)
Figure 64: Germany Low Dropout (LDO) Regulator Market Value & Volume, 2019-2024 ($)
Figure 65: Germany GDP and Population, 2018-2019 ($)
Figure 66: Germany GDP – Composition of 2018, By Sector of Origin
Figure 67: Germany Export and Import Value & Volume, 2018-2019 ($)
Figure 68: Italy Low Dropout (LDO) Regulator Market Value & Volume, 2019-2024 ($)
Figure 69: Italy GDP and Population, 2018-2019 ($)
Figure 70: Italy GDP – Composition of 2018, By Sector of Origin
Figure 71: Italy Export and Import Value & Volume, 2018-2019 ($)
Figure 72: France Low Dropout (LDO) Regulator Market Value & Volume, 2019-2024 ($)
Figure 73: France GDP and Population, 2018-2019 ($)
Figure 74: France GDP – Composition of 2018, By Sector of Origin
Figure 75: France Export and Import Value & Volume, 2018-2019 ($)
Figure 76: Netherlands Low Dropout (LDO) Regulator Market Value & Volume, 2019-2024 ($)
Figure 77: Netherlands GDP and Population, 2018-2019 ($)
Figure 78: Netherlands GDP – Composition of 2018, By Sector of Origin
Figure 79: Netherlands Export and Import Value & Volume, 2018-2019 ($)
Figure 80: Belgium Low Dropout (LDO) Regulator Market Value & Volume, 2019-2024 ($)
Figure 81: Belgium GDP and Population, 2018-2019 ($)
Figure 82: Belgium GDP – Composition of 2018, By Sector of Origin
Figure 83: Belgium Export and Import Value & Volume, 2018-2019 ($)
Figure 84: Spain Low Dropout (LDO) Regulator Market Value & Volume, 2019-2024 ($)
Figure 85: Spain GDP and Population, 2018-2019 ($)
Figure 86: Spain GDP – Composition of 2018, By Sector of Origin
Figure 87: Spain Export and Import Value & Volume, 2018-2019 ($)
Figure 88: Denmark Low Dropout (LDO) Regulator Market Value & Volume, 2019-2024 ($)
Figure 89: Denmark GDP and Population, 2018-2019 ($)
Figure 90: Denmark GDP – Composition of 2018, By Sector of Origin
Figure 91: Denmark Export and Import Value & Volume, 2018-2019 ($)
Figure 92: APAC Low Dropout (LDO) Regulator Market Value & Volume, 2019-2024 ($)
Figure 93: China Low Dropout (LDO) Regulator Market Value & Volume, 2019-2024
Figure 94: China GDP and Population, 2018-2019 ($)
Figure 95: China GDP – Composition of 2018, By Sector of Origin
Figure 96: China Export and Import Value & Volume, 2018-2019 ($)Low Dropout (LDO) Regulator Market China Export and Import Value & Volume, 2018-2019 ($)
Figure 97: Australia Low Dropout (LDO) Regulator Market Value & Volume, 2019-2024 ($)
Figure 98: Australia GDP and Population, 2018-2019 ($)
Figure 99: Australia GDP – Composition of 2018, By Sector of Origin
Figure 100: Australia Export and Import Value & Volume, 2018-2019 ($)
Figure 101: South Korea Low Dropout (LDO) Regulator Market Value & Volume, 2019-2024 ($)
Figure 102: South Korea GDP and Population, 2018-2019 ($)
Figure 103: South Korea GDP – Composition of 2018, By Sector of Origin
Figure 104: South Korea Export and Import Value & Volume, 2018-2019 ($)
Figure 105: India Low Dropout (LDO) Regulator Market Value & Volume, 2019-2024 ($)
Figure 106: India GDP and Population, 2018-2019 ($)
Figure 107: India GDP – Composition of 2018, By Sector of Origin
Figure 108: India Export and Import Value & Volume, 2018-2019 ($)
Figure 109: Taiwan Low Dropout (LDO) Regulator Market Value & Volume, 2019-2024 ($)
Figure 110: Taiwan GDP and Population, 2018-2019 ($)
Figure 111: Taiwan GDP – Composition of 2018, By Sector of Origin
Figure 112: Taiwan Export and Import Value & Volume, 2018-2019 ($)
Figure 113: Malaysia Low Dropout (LDO) Regulator Market Value & Volume, 2019-2024 ($)
Figure 114: Malaysia GDP and Population, 2018-2019 ($)
Figure 115: Malaysia GDP – Composition of 2018, By Sector of Origin
Figure 116: Malaysia Export and Import Value & Volume, 2018-2019 ($)
Figure 117: Hong Kong Low Dropout (LDO) Regulator Market Value & Volume, 2019-2024 ($)
Figure 118: Hong Kong GDP and Population, 2018-2019 ($)
Figure 119: Hong Kong GDP – Composition of 2018, By Sector of Origin
Figure 120: Hong Kong Export and Import Value & Volume, 2018-2019 ($)
Figure 121: Middle East & Africa Low Dropout (LDO) Regulator Market Middle East & Africa 3D Printing Market Value & Volume, 2019-2024 ($)
Figure 122: Russia Low Dropout (LDO) Regulator Market Value & Volume, 2019-2024 ($)
Figure 123: Russia GDP and Population, 2018-2019 ($)
Figure 124: Russia GDP – Composition of 2018, By Sector of Origin
Figure 125: Russia Export and Import Value & Volume, 2018-2019 ($)
Figure 126: Israel Low Dropout (LDO) Regulator Market Value & Volume, 2019-2024 ($)
Figure 127: Israel GDP and Population, 2018-2019 ($)
Figure 128: Israel GDP – Composition of 2018, By Sector of Origin
Figure 129: Israel Export and Import Value & Volume, 2018-2019 ($)
Figure 130: Entropy Share, By Strategies, 2018-2019* (%)Low Dropout (LDO) Regulator Market
Figure 131: Developments, 2018-2019*Low Dropout (LDO) Regulator Market
Figure 132: Company 1 Low Dropout (LDO) Regulator Market Net Revenue, By Years, 2018-2019* ($)
Figure 133: Company 1 Low Dropout (LDO) Regulator Market Net Revenue Share, By Business segments, 2018 (%)
Figure 134: Company 1 Low Dropout (LDO) Regulator Market Net Sales Share, By Geography, 2018 (%)
Figure 135: Company 2 Low Dropout (LDO) Regulator Market Net Revenue, By Years, 2018-2019* ($)
Figure 136: Company 2 Low Dropout (LDO) Regulator Market Net Revenue Share, By Business segments, 2018 (%)
Figure 137: Company 2 Low Dropout (LDO) Regulator Market Net Sales Share, By Geography, 2018 (%)
Figure 138: Company 3 Low Dropout (LDO) Regulator Market Net Revenue, By Years, 2018-2019* ($)
Figure 139: Company 3 Low Dropout (LDO) Regulator Market Net Revenue Share, By Business segments, 2018 (%)
Figure 140: Company 3 Low Dropout (LDO) Regulator Market Net Sales Share, By Geography, 2018 (%)
Figure 141: Company 4 Low Dropout (LDO) Regulator Market Net Revenue, By Years, 2018-2019* ($)
Figure 142: Company 4 Low Dropout (LDO) Regulator Market Net Revenue Share, By Business segments, 2018 (%)
Figure 143: Company 4 Low Dropout (LDO) Regulator Market Net Sales Share, By Geography, 2018 (%)
Figure 144: Company 5 Low Dropout (LDO) Regulator Market Net Revenue, By Years, 2018-2019* ($)
Figure 145: Company 5 Low Dropout (LDO) Regulator Market Net Revenue Share, By Business segments, 2018 (%)
Figure 146: Company 5 Low Dropout (LDO) Regulator Market Net Sales Share, By Geography, 2018 (%)
Figure 147: Company 6 Low Dropout (LDO) Regulator Market Net Revenue, By Years, 2018-2019* ($)
Figure 148: Company 6 Low Dropout (LDO) Regulator Market Net Revenue Share, By Business segments, 2018 (%)
Figure 149: Company 6 Low Dropout (LDO) Regulator Market Net Sales Share, By Geography, 2018 (%)
Figure 150: Company 7 Low Dropout (LDO) Regulator Market Net Revenue, By Years, 2018-2019* ($)
Figure 151: Company 7 Low Dropout (LDO) Regulator Market Net Revenue Share, By Business segments, 2018 (%)
Figure 152: Company 7 Low Dropout (LDO) Regulator Market Net Sales Share, By Geography, 2018 (%)
Figure 153: Company 8 Low Dropout (LDO) Regulator Market Net Revenue, By Years, 2018-2019* ($)
Figure 154: Company 8 Low Dropout (LDO) Regulator Market Net Revenue Share, By Business segments, 2018 (%)
Figure 155: Company 8 Low Dropout (LDO) Regulator Market Net Sales Share, By Geography, 2018 (%)
Figure 156: Company 9 Low Dropout (LDO) Regulator Market Net Revenue, By Years, 2018-2019* ($)
Figure 157: Company 9 Low Dropout (LDO) Regulator Market Net Revenue Share, By Business segments, 2018 (%)
Figure 158: Company 9 Low Dropout (LDO) Regulator Market Net Sales Share, By Geography, 2018 (%)
Figure 159: Company 10 Low Dropout (LDO) Regulator Market Net Revenue, By Years, 2018-2019* ($)
Figure 160: Company 10 Low Dropout (LDO) Regulator Market Net Revenue Share, By Business segments, 2018 (%)
Figure 161: Company 10 Low Dropout (LDO) Regulator Market Net Sales Share, By Geography, 2018 (%)
Figure 162: Company 11 Low Dropout (LDO) Regulator Market Net Revenue, By Years, 2018-2019* ($)
Figure 163: Company 11 Low Dropout (LDO) Regulator Market Net Revenue Share, By Business segments, 2018 (%)
Figure 164: Company 11 Low Dropout (LDO) Regulator Market Net Sales Share, By Geography, 2018 (%)
Figure 165: Company 12 Low Dropout (LDO) Regulator Market Net Revenue, By Years, 2018-2019* ($)
Figure 166: Company 12 Low Dropout (LDO) Regulator Market Net Revenue Share, By Business segments, 2018 (%)
Figure 167: Company 12 Low Dropout (LDO) Regulator Market Net Sales Share, By Geography, 2018 (%)
Figure 168: Company 13 Low Dropout (LDO) Regulator Market Net Revenue, By Years, 2018-2019* ($)
Figure 169: Company 13 Low Dropout (LDO) Regulator Market Net Revenue Share, By Business segments, 2018 (%)
Figure 170: Company 13 Low Dropout (LDO) Regulator Market Net Sales Share, By Geography, 2018 (%)
Figure 171: Company 14 Low Dropout (LDO) Regulator Market Net Revenue, By Years, 2018-2019* ($)
Figure 172: Company 14 Low Dropout (LDO) Regulator Market Net Revenue Share, By Business segments, 2018 (%)
Figure 173: Company 14 Low Dropout (LDO) Regulator Market Net Sales Share, By Geography, 2018 (%)
Figure 174: Company 15 Low Dropout (LDO) Regulator Market Net Revenue, By Years, 2018-2019* ($)
Figure 175: Company 15 Low Dropout (LDO) Regulator Market Net Revenue Share, By Business segments, 2018 (%)
Figure 176: Company 15 Low Dropout (LDO) Regulator Market Net Sales Share, By Geography, 2018 (%)