 Email
Email Print
Print


Artificial Intelligence Market - Forecast(2024 - 2030)
Artificial Intelligence in Energy and Utilities Market Overview
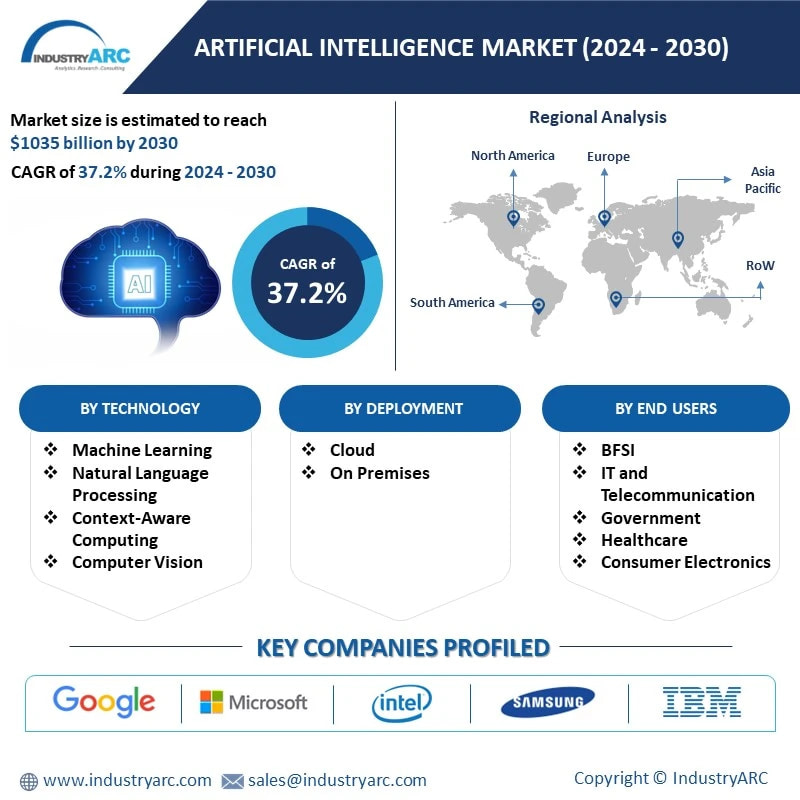
Artificial intelligence in Energy and Utilities market size was valued at USD 196.63 billion by 2030 and is projected to expand at a compound annual growth rate (CAGR) of 37.3% from 2024 to 2030.The market is driven by the rapid demand for power and dearth of information grid in power generation. Artificial intelligence (AI) is an extent of computer technology that highlights the formation of intelligent machines that work and react like humans. The energy and utility sector involves in the production and distribution of energy constitutes of oil and gas, power generation and others. As technologies are getting advanced, the energy and utility sector is experiencing a rapid change in price collision and energy storing technologies. Artificial intelligence creates drastic changes in the energy and utility sectors. The effects of AI technology can be seen in their applications such as smart autonomous grid, energy distribution system and so on. Heavy investment is one of the biggest challenge hindering the growth of this technology in energy and utilities sector.
Moreover, AI has emerged as a pivotal force in shaping the imminent digital era, with major tech players such as Amazon.com, Inc., Google LLC, Apple Inc., Facebook, International Business Machines Corporation, and Microsoft heavily investing in its research and development. This substantial investment is contributing to the growth of the artificial intelligence market. These industry giants are actively working towards enhancing the accessibility of AI for various enterprise use cases. Furthermore, numerous companies are integrating AI technology to enhance customer experiences and establish a stronger presence in the artificial intelligence industry 4.0. A noteworthy example is McDonald's
One of the key factors propelling the pace of innovation in AI is the widespread availability of historical datasets. As the cost of data storage and retrieval has become more affordable, healthcare institutions and government agencies are making unstructured data accessible to the research domain. This accessibility allows researchers to tap into rich datasets, ranging from historical weather trends to clinical imaging. With next-generation computing architectures and access to extensive datasets, information scientists and researchers are empowered to innovate at an accelerated pace.
Market Snapshot:
Report Coverage
The report “Artificial Intelligence Market – Forecast (2024-2030)”, by IndustryARC, covers an in-depth analysis of the following segments of the Artificial Intelligence Market in Energy and Utilities sector.
By Type – Solutions, Services
By Application – Robotics, Renewables Management, Demand Forecasting, Safety & Security and Infrastructure and Others
By End Use– Energy Generation, Energy Transmission, Energy Distribution, Utilities
By Geography – North America, South America, Europe, APAC, and RoW.
Key Takeaways
● Deployment of AI into energy sector resulted in drastic changes in the transmogrification of energy in energy sources distribution. AI has brought advancement in the devices for auto detection and other energy infrastructure.
● Both Energy & Utility sectors have proven to be the most innovative in the application of Artificial Intelligence.
● Energy production has been influenced by Artificial Intelligence in more ways than one. For example it helped in optimizing drilling by identifying the right spots of energy resources for drilling.
Artificial Intelligence Market In Energy & Utilities Segment Analysis - By Application
Demand Forecasting has dominated the Artificial Intelligence Market In Energy & Utilities with a share of 26.9% in 2020 as compared to the other applications due to rising demand for efficiency improvements drive the adoption of AI technology for this application. Artificial intelligence is now deployed in energy and utilities too. Some of the key applications are storage, autonomous grid, failure management, upstream exploration, energy consumption, load forecasting, yield optimizing, predictive maintenance, device management, energy theft. A significant share of companies involved in Energy and Utilities already bestowed training to their employees on AI related and other big data frameworks while the remaining are showing signs of interest to move towards AI.
Artificial Intelligence Market In Energy & Utilities Segment Analysis - By End Use Industry
Due to its intricate data-driven applications, such as text/content or speech recognition, the deep learning segment emerged as a leader in the market, contributing to approximately 36.4% of the global revenue in 2023. Deep learning presents attractive investment opportunities by addressing challenges associated with high volumes of data. For instance, in July , Zebra Medical Vision partnered with TELUS Ventures to enhance the accessibility of its deep learning solutions in North America, extending AI solutions to clinical care settings and new modalities.
Significant investments in artificial intelligence (AI) encompass both machine learning and deep learning, covering AI platforms and cognitive applications. These applications include tagging, clustering, categorization, hypothesis generation, alerting, filtering, navigation, and visualization, facilitating the development of advisory, intelligent, and cognitively enabled solutions. The increasing adoption of cloud-based computing platforms and on-premises hardware for secure data restoration has paved the way for the expansion of analytics platforms. Substantial investments in research and development by key industry players will also play a vital role in driving the adoption of artificial intelligence technologies. The NLP segment is anticipated to gain momentum during the forecast period, as it finds widespread use across various industries to better understand client preferences, evolving trends, purchasing behavior, decision-making processes, and more. AI can be integrated with all the cycles of electricity i.e. from generation to transmission and energy distribution to the end users. The autonomous energy grid is the new technology which is self-organized and can control itself by employing advanced AI machine learning techniques, and simulate to create resilient, useful, and affordable optimizing energy systems. NREL (National Renewable Energy Laboratories) is working to develop these energy grids that can be optimized for secure, resilient, and economic operations. This technology will change the whole scenario in which the energy is generated and distributed. AI will mark the paradigm shift in energy and utilities market.
By Geography - Segment Analysis
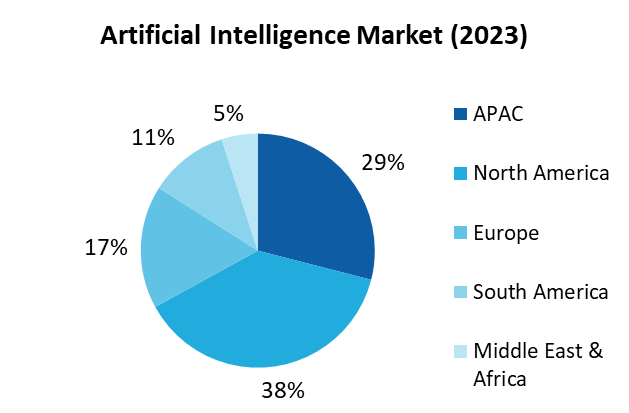
In 2022, North America emerged as the dominant force in the market, commanding a substantial 38% share of the global revenue. This significant presence is a result of favorable government initiatives aimed at fostering the widespread adoption of artificial intelligence (AI) across diverse industries. Governments in North America are actively investing in AI research and development, establishing dedicated research institutes and centers, and providing funding for various AI-related projects. The application of AI spans multiple sectors, including the enhancement of public safety and transportation, as well as the promotion of innovation in healthcare.
However, APAC is likely to witness highest growth during the forecast period. Artificial Intelligence in Energy and Utilities Market is driven by vast range of energy production in nations like the U.S and Brazil. The key applications in the region include Robotics and Demand forecasting among others.
For More Details on This Report - Request for Sample
Drivers – Artificial Intelligence Market
Technological Advancements in Display Manufacturing
● Energy and utilities sectors are innovating their products with the help of AI technology. NextEra Energy invested in machine learning based wind projects in U.S. The project is initiated to avoid any power fluctuations in nearby areas. Duke Energy implemented power plants over some areas in the U.S by converging the Industrial IOT and AI system to predict and analyze power failure. There are some other key players, such as Southern Company and Dominion Resources. Southern Company started its project to save energy consumption as they implemented AI system to predict and provide the amount of energy required in specific areas. Dominion Resources are focused towards grid analytics and control with the help of machine learning. These advancements are developing new applications in the energy sector thereby driving the market
Rise of Microgrid Adoption
The rise of Microgrid adoption, especially due to implementation of smart cities will drive the market. The microgrid market is evolving and growing rapidly. Many governmental organizations are investigating the viability of microgrids to enable continuation of service during an emergency or power outage. Emerging with different technologies such as distributed energy resources and blockchain, AI has potential to deliver the active management which is the requirement of the future. Powerful AI will have that much capability to balance grids, demands, negotiate actions, self-healing and facilitating the host of new products and services. Siemens is designing self-sufficient smart autonomous microgrid system in Finland. Currently, the investment on this project is not predicted, but concerning about renewable energy and new technology, the Ministry of Economic Affairs and Employment (MEAE) gone through their projects and taken their investments in granted. This rise of microgrid and smart grid will drive the adoption of AI in Energy sector.
Challenges – Artificial Intelligence Market
Concerns Regarding Data Privacy
Privacy concerns are cropping up as companies feed more and more consumer and vendor data into advanced, AI-fuelled algorithms to create new bits of sensitive information, unbeknownst to affected consumers and employees. This is especially prevalent in the utilities sector, where consumer data collection has been at the forefront in terms of big data challenges. These data privacy concerns will hinder the adoption of AI especially in utilities sector.
Opportunity:
The growing acceptance of artificial intelligence technology among research scientists is driven by its transformative capabilities.
This trend is expected to persist in the coming years, presenting an opportunity for the expansion of the artificial intelligence market. The technology accelerates data analysis, identifies patterns, and facilitates complex simulations, contributing to breakthroughs across diverse sectors. AI-powered tools streamline repetitive tasks, allowing scientists to focus more on innovation. In various fields, research scientists are increasingly acknowledging the significance and potential of AI in predicting outcomes, uncovering hidden insights, and optimizing experiments. Overall, the scientific community recognizes the role of AI in enhancing research efficiency and fostering new discoveries, fostering a more symbiotic relationship between technology and human expertise.
Market Landscape
Product launches, acquisitions, and R&D activities are key strategies adopted by players in the Artificial Intelligence Market In Energy & Utilities. The Artificial Intelligence Market In Energy & Utilities is dominated by major companies such as
Microsoft Corporation , Amazon.Com , Inc , IBM Corporation, Alphabet Inc, Salesforce.com, Inc, Baidu, Inc, NAVIDIA Corporation , Oracle Corporation, Hewlwtt Packard Enterprise Development LP., H2O.ai
Developments:
● In November 2023, The University of Cambridge, along with Intel Corporation and Dell Technologies announced the implementation of the co-designed fastest AI supercomputer ‘Dawn Phase 1’. Leading technical teams built the supercomputer that mobilize the power of both high-performance computing (HPC) and artificial intelligence (AI) for solving some of the world’s most critical challenges. This is projected to accelerate the future technology leadership and inward investment into the U.K. technology sector.
● Enlitic unveiled the most recent version of its platform, Enlitic Curie, in March 2023. This platform is designed to simplify workflow management for radiology departments. Within the platform, Curie|ENDEX utilizes natural language processing (NLP) and computer vision for the analysis and processing of medical images. Additionally, Curie|ENCOG harnesses artificial intelligence (AI) to identify and safeguard Protected Health Information.
● In April 2023, H2O.ai disclosed a strategic collaboration with GeoTechnologies, a Japan-based provider specializing in map data and location information solutions for vehicle navigation systems. Utilizing H2O.ai's H2O AI Cloud, GeoTechnologies has successfully crafted an AI-powered platform. This innovative platform employs on-board camera footage to assess and enhance sidewalk safety.
For More Information and Communications Technology Market Reports, Please Click Here
1. Artificial Intelligence Market – Market Overview
1.1 Definitions and Scope
2. Artificial Intelligence Market- Executive Summary
3. Artificial Intelligence Market – Market Landscape
3.1 Company Benchmarking- Key Companies
3.2 Global Financial Analysis- Key Companies
3.3 Market Share Analysis-Key Companies
4. Aniline Market - Start-up Companies Scenario
4.1. Key Start-up Company Analysis by
4.1.1. Investment
4.1.2. Revenue
4.1.3. Venture Capital and Funding Scenario
5. Aniline Market – Market Entry Scenario Premium
5.1. Regulatory Framework Overview
5.2. New Business and Ease of Doing Business Index
5.3. Case Studies of Successful Ventures
6. Aniline Market - Forces
6.1. Market Drivers
6.2. Market Constraints
6.3. Market Challenges
6.4. Porter's Five Force Model
6.4.1. Bargaining Power of Suppliers
6.4.2. Bargaining Powers of Customers
6.4.3. Threat of New Entrants
6.4.4. Rivalry Among Existing Players
6.4.5. Threat of Substitutes
7. Artificial Intelligence Market– By Application
7.1. Robotics
7.2. Renewables
7.3. Management
7.4. Demand Forecasting
7.5. Safety & Security
7.6. Infrastructure
7.7 Others
8. Artificial Intelligence Market– By End Use
8.1. Energy Genration
8.2. Energy Transmission
8.3. Energy Distribution
8.4. Utilities
9. Artificial Intelligence Market- By Geography
9.1. Introduction
9.2. Global Study
9.3. Americas
9.3.1. North America
9.3.2. Brazil
9.3.3. Argentina
9.3.4. Others
9.4. Europe
9.4.1. U.K.
9.4.2. France
9.4.3. Germany
9.4.4. Others
9.5. APAC
9.5.1. China
9.5.2. Taiwan
9.5.3. Japan
9.5.4. India
9.5.5. Others
9.6. ROW
10. Artificial Intelligence Market Entropy
10.1. New Product Launches
10.2. M&As, Collaborations, JVs and Partnerships
11. Company Profiles
11.1 Microsoft Corporation
11.2 Amazon.Com, Inc
11.3 IBM Corporation
11.4 Alphabet Inc,
11.5 Salesforce.com, Inc
11.6 Baidu, Inc
11.7 NAVIDIA Corporation
11.8 Oracle Corporation
11.9 Hewlett Packard Enterprise Development LP
11.10 H2O.ai
*More than 40 Companies are profiled in this Research Report, Complete List available on Request*
List of Tables:
Table 1: Global: Artificial Intelligence in Education Market Value (Revenue), By Type (2015-2023), $Million
Table 2: Major Acquisitions In Artificial Intelligence Since 2013
Table 3: Artificial Intelligence in Education Market Revenue, By Application, 2015-2023 ($Million)
Table 4: Artificial Intelligence in Education Market Revenue, By Model, 2015-2023 ($Million)
Table 5: Artificial Intelligence in Education Market Revenue, By Base Type, 2016-2021 ($Million)
Table 6: Global: Artificial Intelligence in Education Market Value (Revenue), By Geography (2015-2023), $Million
Table 7: North America: Artificial Intelligence in Education Market Value (Revenue), By Type (2015-2023), $Million
Table 8: North America: Artificial Intelligence in Education Market Value (Revenue), By Application (2015-2023), $Million
Table 9: North America: Artificial Intelligence in Education Market Value (Revenue), By Model (2015-2023), $Million
Table 10: North America: Artificial Intelligence in Education Market Value (Revenue), By Base Type (2015-2023), $Million
Table 11: U.S.: GDP – Composition of 2015, By End Use
Table 12: Canada : GDP – Composition of 2015, By End Use
Table 13: Mexico: GDP – Composition of 2015, By End Use
Table 14: Europe: Artificial Intelligence in Education Market Value (Revenue), By Type (2015-2023), $Million
Table 15: Europe: Artificial Intelligence in Education Market Value (Revenue), By Application (2015-2023), $Million
Table 16: Europe: Artificial Intelligence in Education Market Value (Revenue), By Model (2015-2023), $Million
Table 17: Europe: Artificial Intelligence in Education Market Value (Revenue), By Base Type (2015-2023), $Million
Table 18: U.K.: GDP – Composition of 2015, By End Use
Table 19: Germany: GDP – Composition of 2015, By End Use
Table 20: France: GDP – Composition of 2015, By End Use
Table 21: Spain: GDP – Composition of 2015, By End Use
Table 22: Italy : GDP – Composition of 2015, By End Use
Table 23: Asia-Pacific: Artificial Intelligence in Education Market Value (Revenue), By Type (2015-2023), $Million
Table 24: Asia-Pacific: Artificial Intelligence in Education Market Value (Revenue), By Application (2015-2023), $Million
Table 25: Asia-Pacific: Artificial Intelligence in Education Market Value (Revenue), By Model (2015-2023), $Million
Table 26: Asia-Pacific: Artificial Intelligence in Education Market Value (Revenue), By Base Type (2015-2023), $Million
Table 27: China: GDP – Composition of 2015, By End Use
Table 28: Japan: GDP – Composition of 2015, By End Use
Table 29: India: GDP – Composition of 2015, By End Use
Table 30: South Korea: GDP – Composition of 2015, By End Use
Table 31: Row: Artificial Intelligence in Education Market Value (Revenue), By Type (2015-2023), $Million
Table 32: Row: Artificial Intelligence in Education Market Value (Revenue), By Application (2015-2023), $Million
Table 33: Row: Artificial Intelligence in Education Market Value (Revenue), By Model (2015-2023), $Million
Table 34: Row: Artificial Intelligence in Education Market Value (Revenue), By Base Type (2015-2023), $Million
List of Figures:
Figure 1: Global: Artificial Intelligence in Education Market Value (Revenue), By Type (2015-2023), $Million
Figure 2: Artificial Intelligence Market in Education Revenue, By Type, 2015 - 2023(%)
Figure 3: Artificial Intelligence Market in Education Revenue, By Region, 2015 -2023(%)
Figure 4: Artificial Intelligence Market in Education Market Share Analysis, By Company 2016 (%)
Figure 5: Artificial Intelligence Patents, 2012-2018 (*Oct)
Figure 6: Artificial Intelligence: Patents Share, By Countries, 2012-2018 (%)
Figure 7: IBM Corporation
Figure 8: Microsoft Corporation
Figure 9: NVIDIA Corporation
Figure 10: Intel Corporation
Figure 11: EPS Comparison
Figure 12: Artificial Intelligence Market in Education Lifecycle
Figure 13: Natural Language Processing: Global Artificial Intelligence in Education Market Value (Revenue), By Type (2015-2023), $Million
Figure 14: Audio Analytics: Global Artificial Intelligence in Education Market Value (Revenue), By Type (2015-2023), $Million
Figure 15: Machine Learning& Image processing: Global Artificial Intelligence in Education Market Value (Revenue), By Type (2015-2023), $Million
Figure 16: Class Teaching: Global Artificial Intelligence in Education Market Value (Revenue), By Type (2015-2023), $Million
Figure 17: Online Tutors: Global Artificial Intelligence in Education Market Value (Revenue), By Type (2015-2023), $Million
Figure 18: Virtual Facilitators& Learning Environments: Global Artificial Intelligence in Education Market Value (Revenue), By Type (2015-2023), $Million
Figure 19: Others: Global Artificial Intelligence in Education Market Value (Revenue), By Type (2015-2023), $Million
Figure 20: Artificial Intelligence in Education Market – By Application
Figure 21: Artificial Intelligence in Education Market Share, By Application, 2016, (%)
Figure 22: Adaptive Learning: Artificial Intelligence in Education Market Revenue, 2015-2023 ($Million)
Figure 23: Insights and Virtual Environment: Artificial Intelligence in Education Market Revenue, 2015-2023 ($Million)
Figure 24: Others: Artificial Intelligence in Education Market Revenue, 2015-2023 ($Million)
Figure 25: Artificial Intelligence in Education Market – By Model
Figure 26: Artificial Intelligence in Education Market Revenue, By Model, 2016, (%)
Figure 27: Learner Model: Artificial Intelligence in Education Market Revenue, 2015-2023 ($Million)
Figure 28: Pedagogical Model: Artificial Intelligence in Education Market Revenue, 2015-2023 ($Million)
Figure 29: Domain Model: Artificial Intelligence in Education Market Revenue, 2015-2023 ($Million)
Figure 30: Others: Artificial Intelligence in Education Market Revenue, 2015-2023 ($Million)
Figure 31: Artificial Intelligence in Education Market – By Base Type
Figure 32: Artificial Intelligence in Education Market Revenue, By Base Type, 2016, (%)
Figure 33: Web Base: Artificial Intelligence in Education Market Revenue, 2015-2023 ($Million)
Figure 34: App Base: Artificial Intelligence in Education Market Revenue, 2015-2023 ($Million)
Figure 35: U.S.: GDP and Population, 2012-2015 ($Trillion, Million)
Figure 36: U.S.: GDP – Composition of 2015, By Sector of Origin
Figure 37: U.S.: Export and Import Value, 2012-2015 ($Trillion)
Figure 38: U.S.: Artificial Intelligence in Education Market Revenue, 2015—2023 ($Million)
Figure 39: Canada: GDP and Population, 2012-2015 ($Trillion, Million)
Figure 40: Canada: GDP – Composition of 2015, By Sector of Origin
Figure 41: Canada : Export and Import Value, 2012-2015 ($Billion)
Figure 42: Canada: Artificial Intelligence in Education Market Revenue, 2018—2023 ($Million)
Figure 43: Mexico: GDP and Population, 2012-2015 ($Trillion, Million)
Figure 44: Mexico: GDP – Composition of 2015, By Sector of Origin
Figure 45: Mexico: Export and Import Value, 2012-2015 ($Billion)
Figure 46: Mexico: Artificial Intelligence in Education Market Revenue, 201—2023 ($Million)
Figure 47: U.K.: GDP and Population, 2012-2015 ($Trillion, Million)
Figure 48: U.K.: GDP – Composition of 2015, By Sector of Origin
Figure 49: U.K.: Export and Import Value, 2012-2015 ($Billion)
Figure 50: U.K.: Artificial Intelligence in Education Market Revenue, 2015-2023 ($Million)
Figure 51: Germany: GDP and Population, 2012-2015 ($Trillion, Million)
Figure 52: Germany: GDP – Composition of 2015, By Sector of Origin
Figure 53: Germany: Export and Import Value, 2012-2015 ($Billion)
Figure 54: Germany: Artificial Intelligence in Education Market Revenue, 2015-2023 ($Million)
Figure 55: France: GDP and Population, 2012-2015 ($Trillion, Million)
Figure 56: France: GDP – Composition of 2015, By Sector of Origin
Figure 57: France: Export and Import Value, 2012-2015 ($Billion)
Figure 58: France: Artificial Intelligence in Education Market Revenue, 2015-2023 ($Million)
Figure 59: Spain: GDP and Population, 2012-2015 ($Trillion, Million)
Figure 60: Spain: GDP – Composition of 2015, By Sector of Origin
Figure 61: Spain: Export and Import Value, 2012-2015 ($Billion)
Figure 62: Spain: Artificial Intelligence in Education Market Revenue, 2015-2023 ($Million)
Figure 63: Italy: GDP and Population, 2012-2015 ($Trillion, Million)
Figure 64: Italy: GDP – Composition of 2015, By Sector of Origin
Figure 65: Italy : Export and Import Value, 2012-2015 ($Billion)
Figure 66: Italy: Artificial Intelligence in Education Market Revenue, 2015-2023 ($Million)
Figure 67: Rest of Europe: Artificial Intelligence in Education Market Revenue, 2015-2023 ($Million)
Figure 68: China: GDP and Population, 2012-2015 ($Trillion, Million)
Figure 69: China: GDP – Composition of 2015, By Sector of Origin
Figure 70: China: Export and Import Value, 2012-2015 ($Billion)
Figure 71: China: Artificial Intelligence in Education Market Revenue, 2015—2023 ($Million)
Figure 72: Japan: GDP and Population, 2012-2015 ($Trillion, Million)
Figure 73: Japan: GDP – Composition of 2015, By Sector of Origin
Figure 74: Japan: Export and Import Value, 2012-2015 ($Billion)
Figure 75: Japan: Artificial Intelligence in Education Market Revenue, 2015—2023 ($Million)
Figure 76: India: GDP and Population, 2012-2015 ($Trillion, Million)
Figure 77: India: GDP – Composition of 2015, By Sector of Origin
Figure 78: India: Export and Import Value, 2012-2015 ($Billion)
Figure 79: India: Artificial Intelligence in Education Market Revenue, 2015 -2023 ($Million)
Figure 80: South Korea: GDP and Population, 2012-2015 ($Trillion, Million)
Figure 81: South Korea: GDP – Composition of 2015, By Sector of Origin
Figure 82: South Korea: Export and Import Value, 2012-2015 ($Billion)
Figure 83: South Korea: Artificial Intelligence in Education Market Revenue, 2015—2023 ($Million)
Figure 84: Rest of Asia-Pacific : Artificial Intelligence in Education Market Revenue, 2015—2023 ($Million)
Figure 85: Middle East: Artificial Intelligence in Education Market Revenue, 2015-2023 ($Million)
Figure 86: Africa: Artificial Intelligence in Education Market Revenue, 2015-2023 ($Million)
Figure 87: Artificial Intelligence in Education Market Entropy Share, By Strategies (2012-2018*)
Figure 88: Artificial Intelligence in Education: Total Developments, By Year, 2012-2018*
Figure 89: Artificial Intelligence in Education: Total Number of Developments, By companies, 2012-2018*
Figure 90: IBM, Revenue, 2013-2016 ($Billion)
Figure 91: IBM, Revenue, by segment, 2016 (%)
Figure 92: IBM, Market Revenue, by Geography, 2016 (%)
Figure 93: Nuance Communications Inc., Revenue, 2013-2016 ($Billion)
Figure 94: Nuance Communications, Revenue, by segment, 2015 (%)
Figure 95: Naunce Communications, Revenue, by Geography, 2015
Figure 96: Microsoft, Revenue, 2013-2016 ($ Billion)
Figure 97: Microsoft, Revenue, By Geography, 2016
Figure 98: Microsoft, Revenue, By Business Segment, 2016
Figure 99: Pearson, Sales, by year 2015-2016 ($ billion)
Figure 100: Pearson, Sales, By Products & Services
Figure 101: Pearson, Sales, By Geographic Regions