 Email
Email Print
Print


Europe Building Information Modeling Market - Forecast(2024 - 2030)
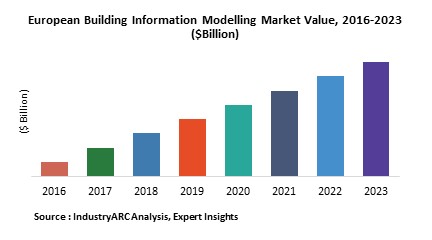
BIM is increasingly gaining popularity particularly in the European region, among construction organizations and firms involved in architecture, engineering, and construction (AEC) sector as well as the owners and the operators of the buildings such as facility and real estate managers. The European building information modeling market is projected to reach $2436.04 million by the end of 2023 with a CAGR of over 13.46% during the forecast period 2018 to 2023.
What is Europe Building Information Modeling?
Building Information Modeling is a process which is implied for creating and managing information on a construction project across the project lifecycle. The digital description of every aspect of the built asset is studied using Building Information models. They draw on information assembled collaboratively and updated at key stages of a project. The building construction actions and steps can be optimized by engineers resulting in a greater whole life value for the asset. Building Information Modeling (BIM) involves designing, building and managing building multi-dimensionally before being constructed to analyze the real time issues during and after construction.
What are the major applications for Europe Building Information Modeling?
Using BIM the processes of planning, construction and operation, processing, collaboration and reduction of error proneness and assistance in improving the efficiency are simplified. Various BIM applications have been developed to address sustainability issues in the design process. The majority of green BIM applications are designed for building performance analysis and simulations, such as energy performance analyses CO2 emission analyses, lighting simulations and some integrated building performance optimization. These BIM applications help designers by providing more integrated and 3-dimensional views of building performance in the early design phase. BIM software supports detailed analyses for different energy conservation measures. For instance, during the building operation phase, occupant behaviors have a significant influence on the whole building energy use. Therefore, simulation applications of building energy have incorporated occupant effects into the energy analysis process to evaluate energy savings based on different scenarios of schedule.
Market Research and Market Trends of Europe Building Information Modeling Ecosystem
- Currently the construction industry faces some major challenges in terms of climate change and sustainability, including the need to reduce greenhouse gas emissions from existing and new build. This is clearly reflected in increasing complex regulations (environmental, energy, waste, etc.) that must be assessed and considered by specialists in order to satisfy planning consents and public concerns. BIM is used by construction agencies for water usage analyses, thermal comfort analyses, solar radiation and lighting analyses, carbon emissions analyses and evaluations, etc. which help to ensure that regulations are strictly adhered.
- The majority is currently represented by a large proportion of SMEs which utilize the Building Information Models to provide high end designing of blueprints of huge infrastructures and also for manufacturing construction components. The current financial downturn and the concern for quality, timely and to budget delivery against the threat of financial penalties are causing the major industry players to consider reduction in count of specialists and sub-contractors they require.
- The target reflected in policies of UK Government’s policies is incorporating lower costs, faster delivery, lower emissions which will lead to improvements in exports and help for positioning UK at the forefront of international construction. The UK Government’s Construction Strategy 2011 is a framework for a range of work streams, all of which contribute to the 2025 strategy. This framework in the Construction 2025: Industrial Strategy forms the basis of the government’s BIM hypothesis.
- Digital models can serve as an efficient means for sharing rich semantic building information across different disciplines and related software application. Semantic e-Construction is an ICT-based approach for distributed engineering and has the potential to lead to a fast and flexible production of customized and industrialized complex solutions with embedded intelligence. This approach would especially rely on an extensive use of semantic construction objects and pre-defined design models.
- Digital models highlight the requirements from the client, end-users, and other relevant stakeholders; the efficient and effective use of various resources needed to deliver and operate a building from human resources, financial and supply chain perspectives; the process and product compliance with regulations across the building and facility lifecycle. The Living Building Concept in which buildings are continuously adapted to changing user and/or client needs in the form of Product/Service combinations is the future in construction industry aided by 3D printing technologies.
Who are the Major Players in Europe Building Information Modeling market?
The players profiled in the report include Bentley System Inc. (U.K.), Trimble Inc. (U.S.), Autodesk, Inc. (U.S.), ABM Europe (Ireland), WS Atkins PLC (U.K.), BIM6D Consulting and Performance, BIMCOLLAB, BIMETRICAL, BIS Structures, CALAF Constructora, Captae, Certis.
What is our report scope?
The report incorporates in-depth assessment of the competitive landscape, product market sizing, product benchmarking, market trends, product developments, financial analysis, strategic analysis and so on to gauge the impact forces and potential opportunities of the market. Apart from this the report also includes a study of major developments in the market such as product launches, agreements, acquisitions, collaborations, mergers and so on to comprehend the prevailing market dynamics at present and its impact during the forecast period 2018-2024.
All our reports are customizable to your company needs to a certain extent, we do provide 20 free consulting hours along with purchase of each report, and this will allow you to request any additional data to customize the report to your needs.
Key Takeaways from this Report
- Evaluate market potential through analyzing growth rates (CAGR %), Volume (Units) and Value ($M) data given at country level – for product types, end use applications and by different industry verticals.
- Understand the different dynamics influencing the market – key driving factors, challenges and hidden opportunities.
- Get in-depth insights on your competitor performance – market shares, strategies, financial benchmarking, product benchmarking, SWOT and more.
- Analyze the sales and distribution channels across key geographies to improve top-line revenues.
- Understand the industry supply chain with a deep-dive on the value augmentation at each step, in order to optimize value and bring efficiencies in your processes.
- Get a quick outlook on the market entropy – M&A’s, deals, partnerships, product launches of all key players for the past 4 years.
- Evaluate the supply-demand gaps, import-export statistics and regulatory landscape for more than top 20 countries globally for the market.
1. Europe Building Information Modeling- Market Overview
2. Executive Summary
3. Europe Building Information Modeling - Market Landscape
3.1. Market Share Analysis
3.2. Comparative Analysis
3.2.1. Product Benchmarking
3.2.2. End User Profiling
3.2.3. Top 5 Financials Analysis
4. Europe Building Information Modeling - Market Forces
4.1. Market Drivers
4.2. Market Constraints
4.3. Market Challenges
4.4. Attractiveness of the Europe Building Information Modeling market
4.4.1. Power of Suppliers
4.4.2. Power of Customers
4.4.3. Threat of New Entrants
4.4.4. Threat of Substitution
4.4.5. Degree of Competition
5. Europe Building Information Modeling market- Strategic Analysis
5.1. Value Chain Analysis
5.2. Pricing Analysis
5.3. Opportunities Analysis
5.4. Product/Market Life Cycle Analysis
5.5. Suppliers and Distributors
6. Europe Building Information Modeling Market– By Type
6.1. Introduction
6.2. Software
6.3. Services
7. Europe Building Information Modeling Market- By Phase
7.1. Design
7.2. Construction
7.3. Operations
7.4. Renovations and Retrofit
8. Europe Building Information Modeling Market– By Industry Vertical
8.1. Introduction
8.2. Commercial
8.3. Residential
8.4. Public Infrastructure
8.4.1. Transportation
8.4.1.1. Rail
8.4.1.2. Road
8.4.1.3. Waterway
8.4.2. Bridge
8.4.3. Tunnel
8.4.4. Dam
8.5. Educational
8.5.1. Architectural Modeling
8.5.2. Civil Engineering
8.5.3. Research Centers
8.6. Healthcare
8.6.1. Infrastructure Construction
8.6.2. Infrastructure Management
8.6.3. Patient Felicitation
8.7. Industrial
8.7.1. Industrial Infrastructure
8.7.2. Machinery Components
8.8. Sports and Entertainment
8.8.1. Infrastructure Construction
8.8.2. Infrastructure Management
8.8.3. Artificial Locations
8.8.4. Special Effects
8.9. Others
9. Europe Building Information Modeling Market– By End User Verticals
9.1. Introduction
9.2. Construction Managers/ Contractors
9.3. Architects
9.4. Engineers
9.5. Facilities Manager
9.6. Building Product Manufacturers
9.7. Owners
9.8. Others
10. Europe Building Information Modeling Market - By Country
10.1. U.K
10.2. Germany
10.3. Italy
10.4. France
10.5. Netherlands
10.6. Belgium
10.7. Spain
10.8. Denmark
10.9. Rest Of Europe
11. Market Entropy
11.1. New Product Launches
11.2. M&As, Collaborations, JVs, Partnership
12. Company Profiles (Overview, Financials, SWOT Analysis, Developments, Product Portfolio)
12.1. Bentley System Inc. (U.K.)
12.2. Trimble Inc. (U.S.)
12.3. Autodesk
12.4. ABM Europe (Ireland)
12.5. WS Atkins PLC (U.K.)
12.6. BIM6D Consulting and Performance
12.7. BIMCOLLAB
12.8. BIMETRICAL
12.9. Company 9
12.10. Company 10
*More than 10 Companies are profiled in this Research Report*
"*Financials would be provided on a best efforts basis for private companies"
13. Appendix
13.1. Abbreviations
13.2. Sources
13.3. Research Methodology
13.4. Bibliography
13.5. Compilation of Expert Insights
13.6. Disclaimer
List of Tables:
Table 1: Europe Building Information Modeling Market Overview 2019-2024
Table 2: Europe Building Information Modeling Market Leader Analysis 2018-2019 (US$)
Table 3: Europe Building Information Modeling Market Product Analysis 2018-2019 (US$)
Table 4: Europe Building Information Modeling Market End User Analysis 2018-2019 (US$)
Table 5: Europe Building Information Modeling Market Patent Analysis 2013-2018* (US$)
Table 6: Europe Building Information Modeling Market Financial Analysis 2018-2019 (US$)
Table 7: Europe Building Information Modeling Market Driver Analysis 2018-2019 (US$)
Table 8: Europe Building Information Modeling Market Challenges Analysis 2018-2019 (US$)
Table 9: Europe Building Information Modeling Market Constraint Analysis 2018-2019 (US$)
Table 10: Europe Building Information Modeling Market Supplier Bargaining Power Analysis 2018-2019 (US$)
Table 11: Europe Building Information Modeling Market Buyer Bargaining Power Analysis 2018-2019 (US$)
Table 12: Europe Building Information Modeling Market Threat of Substitutes Analysis 2018-2019 (US$)
Table 13: Europe Building Information Modeling Market Threat of New Entrants Analysis 2018-2019 (US$)
Table 14: Europe Building Information Modeling Market Degree of Competition Analysis 2018-2019 (US$)
Table 15: Europe Building Information Modeling Market Value Chain Analysis 2018-2019 (US$)
Table 16: Europe Building Information Modeling Market Pricing Analysis 2019-2024 (US$)
Table 17: Europe Building Information Modeling Market Opportunities Analysis 2019-2024 (US$)
Table 18: Europe Building Information Modeling Market Product Life Cycle Analysis 2019-2024 (US$)
Table 19: Europe Building Information Modeling Market Supplier Analysis 2018-2019 (US$)
Table 20: Europe Building Information Modeling Market Distributor Analysis 2018-2019 (US$)
Table 21: Europe Building Information Modeling Market Trend Analysis 2018-2019 (US$)
Table 22: Europe Building Information Modeling Market Size 2018 (US$)
Table 23: Europe Building Information Modeling Market Forecast Analysis 2019-2024 (US$)
Table 24: Europe Building Information Modeling Market Sales Forecast Analysis 2019-2024 (Units)
Table 25: Europe Building Information Modeling Market, Revenue & Volume, By Type, 2019-2024 ($)
Table 26: Europe Building Information Modeling Market By Type, Revenue & Volume, By Software, 2019-2024 ($)
Table 27: Europe Building Information Modeling Market By Type, Revenue & Volume, By Services, 2019-2024 ($)
Table 28: Europe Building Information Modeling Market, Revenue & Volume, By Phase, 2019-2024 ($)
Table 29: Europe Building Information Modeling Market By Phase, Revenue & Volume, By Design, 2019-2024 ($)
Table 30: Europe Building Information Modeling Market By Phase, Revenue & Volume, By Construction, 2019-2024 ($)
Table 31: Europe Building Information Modeling Market By Phase, Revenue & Volume, By Operations, 2019-2024 ($)
Table 32: Europe Building Information Modeling Market By Phase, Revenue & Volume, By Renovations and Retrofit, 2019-2024 ($)
Table 33: Europe Building Information Modeling Market, Revenue & Volume, By Industry Vertical, 2019-2024 ($)
Table 34: Europe Building Information Modeling Market By Industry Vertical, Revenue & Volume, By Commercial, 2019-2024 ($)
Table 35: Europe Building Information Modeling Market By Industry Vertical, Revenue & Volume, By Residential, 2019-2024 ($)
Table 36: Europe Building Information Modeling Market By Industry Vertical, Revenue & Volume, By Public Infrastructure, 2019-2024 ($)
Table 37: Europe Building Information Modeling Market By Industry Vertical, Revenue & Volume, By Educational, 2019-2024 ($)
Table 38: Europe Building Information Modeling Market By Industry Vertical, Revenue & Volume, By Healthcare, 2019-2024 ($)
Table 39: Europe Building Information Modeling Market, Revenue & Volume, By End User Verticals, 2019-2024 ($)
Table 40: Europe Building Information Modeling Market By End User Verticals, Revenue & Volume, By Construction Managers/ Contractors, 2019-2024 ($)
Table 41: Europe Building Information Modeling Market By End User Verticals, Revenue & Volume, By Architects, 2019-2024 ($)
Table 42: Europe Building Information Modeling Market By End User Verticals, Revenue & Volume, By Engineers, 2019-2024 ($)
Table 43: Europe Building Information Modeling Market By End User Verticals, Revenue & Volume, By Facilities Manager, 2019-2024 ($)
Table 44: Europe Building Information Modeling Market By End User Verticals, Revenue & Volume, By Building Product Manufacturers, 2019-2024 ($)
Table 45: North America Europe Building Information Modeling Market, Revenue & Volume, By Type, 2019-2024 ($)
Table 46: North America Europe Building Information Modeling Market, Revenue & Volume, By Phase, 2019-2024 ($)
Table 47: North America Europe Building Information Modeling Market, Revenue & Volume, By Industry Vertical, 2019-2024 ($)
Table 48: North America Europe Building Information Modeling Market, Revenue & Volume, By End User Verticals, 2019-2024 ($)
Table 49: South america Europe Building Information Modeling Market, Revenue & Volume, By Type, 2019-2024 ($)
Table 50: South america Europe Building Information Modeling Market, Revenue & Volume, By Phase, 2019-2024 ($)
Table 51: South america Europe Building Information Modeling Market, Revenue & Volume, By Industry Vertical, 2019-2024 ($)
Table 52: South america Europe Building Information Modeling Market, Revenue & Volume, By End User Verticals, 2019-2024 ($)
Table 53: Europe Europe Building Information Modeling Market, Revenue & Volume, By Type, 2019-2024 ($)
Table 54: Europe Europe Building Information Modeling Market, Revenue & Volume, By Phase, 2019-2024 ($)
Table 55: Europe Europe Building Information Modeling Market, Revenue & Volume, By Industry Vertical, 2019-2024 ($)
Table 56: Europe Europe Building Information Modeling Market, Revenue & Volume, By End User Verticals, 2019-2024 ($)
Table 57: APAC Europe Building Information Modeling Market, Revenue & Volume, By Type, 2019-2024 ($)
Table 58: APAC Europe Building Information Modeling Market, Revenue & Volume, By Phase, 2019-2024 ($)
Table 59: APAC Europe Building Information Modeling Market, Revenue & Volume, By Industry Vertical, 2019-2024 ($)
Table 60: APAC Europe Building Information Modeling Market, Revenue & Volume, By End User Verticals, 2019-2024 ($)
Table 61: Middle East & Africa Europe Building Information Modeling Market, Revenue & Volume, By Type, 2019-2024 ($)
Table 62: Middle East & Africa Europe Building Information Modeling Market, Revenue & Volume, By Phase, 2019-2024 ($)
Table 63: Middle East & Africa Europe Building Information Modeling Market, Revenue & Volume, By Industry Vertical, 2019-2024 ($)
Table 64: Middle East & Africa Europe Building Information Modeling Market, Revenue & Volume, By End User Verticals, 2019-2024 ($)
Table 65: Russia Europe Building Information Modeling Market, Revenue & Volume, By Type, 2019-2024 ($)
Table 66: Russia Europe Building Information Modeling Market, Revenue & Volume, By Phase, 2019-2024 ($)
Table 67: Russia Europe Building Information Modeling Market, Revenue & Volume, By Industry Vertical, 2019-2024 ($)
Table 68: Russia Europe Building Information Modeling Market, Revenue & Volume, By End User Verticals, 2019-2024 ($)
Table 69: Israel Europe Building Information Modeling Market, Revenue & Volume, By Type, 2019-2024 ($)
Table 70: Israel Europe Building Information Modeling Market, Revenue & Volume, By Phase, 2019-2024 ($)
Table 71: Israel Europe Building Information Modeling Market, Revenue & Volume, By Industry Vertical, 2019-2024 ($)
Table 72: Israel Europe Building Information Modeling Market, Revenue & Volume, By End User Verticals, 2019-2024 ($)
Table 73: Top Companies 2018 (US$) Europe Building Information Modeling Market, Revenue & Volume
Table 74: Product Launch 2018-2019 Europe Building Information Modeling Market, Revenue & Volume
Table 75: Mergers & Acquistions 2018-2019 Europe Building Information Modeling Market, Revenue & Volume
List of Figures:
Figure 1: Overview of Europe Building Information Modeling Market 2019-2024
Figure 2: Market Share Analysis for Europe Building Information Modeling Market 2018 (US$)
Figure 3: Product Comparison in Europe Building Information Modeling Market 2018-2019 (US$)
Figure 4: End User Profile for Europe Building Information Modeling Market 2018-2019 (US$)
Figure 5: Patent Application and Grant in Europe Building Information Modeling Market 2013-2018* (US$)
Figure 6: Top 5 Companies Financial Analysis in Europe Building Information Modeling Market 2018-2019 (US$)
Figure 7: Market Entry Strategy in Europe Building Information Modeling Market 2018-2019
Figure 8: Ecosystem Analysis in Europe Building Information Modeling Market 2018
Figure 9: Average Selling Price in Europe Building Information Modeling Market 2019-2024
Figure 10: Top Opportunites in Europe Building Information Modeling Market 2018-2019
Figure 11: Market Life Cycle Analysis in Europe Building Information Modeling Market
Figure 12: GlobalBy Type Europe Building Information Modeling Market Revenue, 2019-2024 ($)
Figure 13: GlobalBy Phase Europe Building Information Modeling Market Revenue, 2019-2024 ($)
Figure 14: GlobalBy Industry Vertical Europe Building Information Modeling Market Revenue, 2019-2024 ($)
Figure 15: GlobalBy End User Verticals Europe Building Information Modeling Market Revenue, 2019-2024 ($)
Figure 16: Global Europe Building Information Modeling Market - By Geography
Figure 17: Global Europe Building Information Modeling Market Value & Volume, By Geography, 2019-2024 ($)
Figure 18: Global Europe Building Information Modeling Market CAGR, By Geography, 2019-2024 (%)
Figure 19: North America Europe Building Information Modeling Market Value & Volume, 2019-2024 ($)
Figure 20: US Europe Building Information Modeling Market Value & Volume, 2019-2024 ($)
Figure 21: US GDP and Population, 2018-2019 ($)
Figure 22: US GDP – Composition of 2018, By Sector of Origin
Figure 23: US Export and Import Value & Volume, 2018-2019 ($)
Figure 24: Canada Europe Building Information Modeling Market Value & Volume, 2019-2024 ($)
Figure 25: Canada GDP and Population, 2018-2019 ($)
Figure 26: Canada GDP – Composition of 2018, By Sector of Origin
Figure 27: Canada Export and Import Value & Volume, 2018-2019 ($)
Figure 28: Mexico Europe Building Information Modeling Market Value & Volume, 2019-2024 ($)
Figure 29: Mexico GDP and Population, 2018-2019 ($)
Figure 30: Mexico GDP – Composition of 2018, By Sector of Origin
Figure 31: Mexico Export and Import Value & Volume, 2018-2019 ($)
Figure 32: South America Europe Building Information Modeling Market Value & Volume, 2019-2024 ($)
Figure 33: Brazil Europe Building Information Modeling Market Value & Volume, 2019-2024 ($)
Figure 34: Brazil GDP and Population, 2018-2019 ($)
Figure 35: Brazil GDP – Composition of 2018, By Sector of Origin
Figure 36: Brazil Export and Import Value & Volume, 2018-2019 ($)
Figure 37: Venezuela Europe Building Information Modeling Market Value & Volume, 2019-2024 ($)
Figure 38: Venezuela GDP and Population, 2018-2019 ($)
Figure 39: Venezuela GDP – Composition of 2018, By Sector of Origin
Figure 40: Venezuela Export and Import Value & Volume, 2018-2019 ($)
Figure 41: Argentina Europe Building Information Modeling Market Value & Volume, 2019-2024 ($)
Figure 42: Argentina GDP and Population, 2018-2019 ($)
Figure 43: Argentina GDP – Composition of 2018, By Sector of Origin
Figure 44: Argentina Export and Import Value & Volume, 2018-2019 ($)
Figure 45: Ecuador Europe Building Information Modeling Market Value & Volume, 2019-2024 ($)
Figure 46: Ecuador GDP and Population, 2018-2019 ($)
Figure 47: Ecuador GDP – Composition of 2018, By Sector of Origin
Figure 48: Ecuador Export and Import Value & Volume, 2018-2019 ($)
Figure 49: Peru Europe Building Information Modeling Market Value & Volume, 2019-2024 ($)
Figure 50: Peru GDP and Population, 2018-2019 ($)
Figure 51: Peru GDP – Composition of 2018, By Sector of Origin
Figure 52: Peru Export and Import Value & Volume, 2018-2019 ($)
Figure 53: Colombia Europe Building Information Modeling Market Value & Volume, 2019-2024 ($)
Figure 54: Colombia GDP and Population, 2018-2019 ($)
Figure 55: Colombia GDP – Composition of 2018, By Sector of Origin
Figure 56: Colombia Export and Import Value & Volume, 2018-2019 ($)
Figure 57: Costa Rica Europe Building Information Modeling Market Value & Volume, 2019-2024 ($)
Figure 58: Costa Rica GDP and Population, 2018-2019 ($)
Figure 59: Costa Rica GDP – Composition of 2018, By Sector of Origin
Figure 60: Costa Rica Export and Import Value & Volume, 2018-2019 ($)
Figure 61: Europe Europe Building Information Modeling Market Value & Volume, 2019-2024 ($)
Figure 62: U.K Europe Building Information Modeling Market Value & Volume, 2019-2024 ($)
Figure 63: U.K GDP and Population, 2018-2019 ($)
Figure 64: U.K GDP – Composition of 2018, By Sector of Origin
Figure 65: U.K Export and Import Value & Volume, 2018-2019 ($)
Figure 66: Germany Europe Building Information Modeling Market Value & Volume, 2019-2024 ($)
Figure 67: Germany GDP and Population, 2018-2019 ($)
Figure 68: Germany GDP – Composition of 2018, By Sector of Origin
Figure 69: Germany Export and Import Value & Volume, 2018-2019 ($)
Figure 70: Italy Europe Building Information Modeling Market Value & Volume, 2019-2024 ($)
Figure 71: Italy GDP and Population, 2018-2019 ($)
Figure 72: Italy GDP – Composition of 2018, By Sector of Origin
Figure 73: Italy Export and Import Value & Volume, 2018-2019 ($)
Figure 74: France Europe Building Information Modeling Market Value & Volume, 2019-2024 ($)
Figure 75: France GDP and Population, 2018-2019 ($)
Figure 76: France GDP – Composition of 2018, By Sector of Origin
Figure 77: France Export and Import Value & Volume, 2018-2019 ($)
Figure 78: Netherlands Europe Building Information Modeling Market Value & Volume, 2019-2024 ($)
Figure 79: Netherlands GDP and Population, 2018-2019 ($)
Figure 80: Netherlands GDP – Composition of 2018, By Sector of Origin
Figure 81: Netherlands Export and Import Value & Volume, 2018-2019 ($)
Figure 82: Belgium Europe Building Information Modeling Market Value & Volume, 2019-2024 ($)
Figure 83: Belgium GDP and Population, 2018-2019 ($)
Figure 84: Belgium GDP – Composition of 2018, By Sector of Origin
Figure 85: Belgium Export and Import Value & Volume, 2018-2019 ($)
Figure 86: Spain Europe Building Information Modeling Market Value & Volume, 2019-2024 ($)
Figure 87: Spain GDP and Population, 2018-2019 ($)
Figure 88: Spain GDP – Composition of 2018, By Sector of Origin
Figure 89: Spain Export and Import Value & Volume, 2018-2019 ($)
Figure 90: Denmark Europe Building Information Modeling Market Value & Volume, 2019-2024 ($)
Figure 91: Denmark GDP and Population, 2018-2019 ($)
Figure 92: Denmark GDP – Composition of 2018, By Sector of Origin
Figure 93: Denmark Export and Import Value & Volume, 2018-2019 ($)
Figure 94: APAC Europe Building Information Modeling Market Value & Volume, 2019-2024 ($)
Figure 95: China Europe Building Information Modeling Market Value & Volume, 2019-2024
Figure 96: China GDP and Population, 2018-2019 ($)
Figure 97: China GDP – Composition of 2018, By Sector of Origin
Figure 98: China Export and Import Value & Volume, 2018-2019 ($) Europe Building Information Modeling Market China Export and Import Value & Volume, 2018-2019 ($)
Figure 99: Australia Europe Building Information Modeling Market Value & Volume, 2019-2024 ($)
Figure 100: Australia GDP and Population, 2018-2019 ($)
Figure 101: Australia GDP – Composition of 2018, By Sector of Origin
Figure 102: Australia Export and Import Value & Volume, 2018-2019 ($)
Figure 103: South Korea Europe Building Information Modeling Market Value & Volume, 2019-2024 ($)
Figure 104: South Korea GDP and Population, 2018-2019 ($)
Figure 105: South Korea GDP – Composition of 2018, By Sector of Origin
Figure 106: South Korea Export and Import Value & Volume, 2018-2019 ($)
Figure 107: India Europe Building Information Modeling Market Value & Volume, 2019-2024 ($)
Figure 108: India GDP and Population, 2018-2019 ($)
Figure 109: India GDP – Composition of 2018, By Sector of Origin
Figure 110: India Export and Import Value & Volume, 2018-2019 ($)
Figure 111: Taiwan Europe Building Information Modeling Market Value & Volume, 2019-2024 ($)
Figure 112: Taiwan GDP and Population, 2018-2019 ($)
Figure 113: Taiwan GDP – Composition of 2018, By Sector of Origin
Figure 114: Taiwan Export and Import Value & Volume, 2018-2019 ($)
Figure 115: Malaysia Europe Building Information Modeling Market Value & Volume, 2019-2024 ($)
Figure 116: Malaysia GDP and Population, 2018-2019 ($)
Figure 117: Malaysia GDP – Composition of 2018, By Sector of Origin
Figure 118: Malaysia Export and Import Value & Volume, 2018-2019 ($)
Figure 119: Hong Kong Europe Building Information Modeling Market Value & Volume, 2019-2024 ($)
Figure 120: Hong Kong GDP and Population, 2018-2019 ($)
Figure 121: Hong Kong GDP – Composition of 2018, By Sector of Origin
Figure 122: Hong Kong Export and Import Value & Volume, 2018-2019 ($)
Figure 123: Middle East & Africa Europe Building Information Modeling Market Middle East & Africa 3D Printing Market Value & Volume, 2019-2024 ($)
Figure 124: Russia Europe Building Information Modeling Market Value & Volume, 2019-2024 ($)
Figure 125: Russia GDP and Population, 2018-2019 ($)
Figure 126: Russia GDP – Composition of 2018, By Sector of Origin
Figure 127: Russia Export and Import Value & Volume, 2018-2019 ($)
Figure 128: Israel Europe Building Information Modeling Market Value & Volume, 2019-2024 ($)
Figure 129: Israel GDP and Population, 2018-2019 ($)
Figure 130: Israel GDP – Composition of 2018, By Sector of Origin
Figure 131: Israel Export and Import Value & Volume, 2018-2019 ($)
Figure 132: Entropy Share, By Strategies, 2018-2019* (%) Europe Building Information Modeling Market
Figure 133: Developments, 2018-2019* Europe Building Information Modeling Market
Figure 134: Company 1 Europe Building Information Modeling Market Net Revenue, By Years, 2018-2019* ($)
Figure 135: Company 1 Europe Building Information Modeling Market Net Revenue Share, By Business segments, 2018 (%)
Figure 136: Company 1 Europe Building Information Modeling Market Net Sales Share, By Geography, 2018 (%)
Figure 137: Company 2 Europe Building Information Modeling Market Net Revenue, By Years, 2018-2019* ($)
Figure 138: Company 2 Europe Building Information Modeling Market Net Revenue Share, By Business segments, 2018 (%)
Figure 139: Company 2 Europe Building Information Modeling Market Net Sales Share, By Geography, 2018 (%)
Figure 140: Company 3 Europe Building Information Modeling Market Net Revenue, By Years, 2018-2019* ($)
Figure 141: Company 3 Europe Building Information Modeling Market Net Revenue Share, By Business segments, 2018 (%)
Figure 142: Company 3 Europe Building Information Modeling Market Net Sales Share, By Geography, 2018 (%)
Figure 143: Company 4 Europe Building Information Modeling Market Net Revenue, By Years, 2018-2019* ($)
Figure 144: Company 4 Europe Building Information Modeling Market Net Revenue Share, By Business segments, 2018 (%)
Figure 145: Company 4 Europe Building Information Modeling Market Net Sales Share, By Geography, 2018 (%)
Figure 146: Company 5 Europe Building Information Modeling Market Net Revenue, By Years, 2018-2019* ($)
Figure 147: Company 5 Europe Building Information Modeling Market Net Revenue Share, By Business segments, 2018 (%)
Figure 148: Company 5 Europe Building Information Modeling Market Net Sales Share, By Geography, 2018 (%)
Figure 149: Company 6 Europe Building Information Modeling Market Net Revenue, By Years, 2018-2019* ($)
Figure 150: Company 6 Europe Building Information Modeling Market Net Revenue Share, By Business segments, 2018 (%)
Figure 151: Company 6 Europe Building Information Modeling Market Net Sales Share, By Geography, 2018 (%)
Figure 152: Company 7 Europe Building Information Modeling Market Net Revenue, By Years, 2018-2019* ($)
Figure 153: Company 7 Europe Building Information Modeling Market Net Revenue Share, By Business segments, 2018 (%)
Figure 154: Company 7 Europe Building Information Modeling Market Net Sales Share, By Geography, 2018 (%)
Figure 155: Company 8 Europe Building Information Modeling Market Net Revenue, By Years, 2018-2019* ($)
Figure 156: Company 8 Europe Building Information Modeling Market Net Revenue Share, By Business segments, 2018 (%)
Figure 157: Company 8 Europe Building Information Modeling Market Net Sales Share, By Geography, 2018 (%)
Figure 158: Company 9 Europe Building Information Modeling Market Net Revenue, By Years, 2018-2019* ($)
Figure 159: Company 9 Europe Building Information Modeling Market Net Revenue Share, By Business segments, 2018 (%)
Figure 160: Company 9 Europe Building Information Modeling Market Net Sales Share, By Geography, 2018 (%)
Figure 161: Company 10 Europe Building Information Modeling Market Net Revenue, By Years, 2018-2019* ($)
Figure 162: Company 10 Europe Building Information Modeling Market Net Revenue Share, By Business segments, 2018 (%)
Figure 163: Company 10 Europe Building Information Modeling Market Net Sales Share, By Geography, 2018 (%)
Figure 164: Company 11 Europe Building Information Modeling Market Net Revenue, By Years, 2018-2019* ($)
Figure 165: Company 11 Europe Building Information Modeling Market Net Revenue Share, By Business segments, 2018 (%)
Figure 166: Company 11 Europe Building Information Modeling Market Net Sales Share, By Geography, 2018 (%)
Figure 167: Company 12 Europe Building Information Modeling Market Net Revenue, By Years, 2018-2019* ($)
Figure 168: Company 12 Europe Building Information Modeling Market Net Revenue Share, By Business segments, 2018 (%)
Figure 169: Company 12 Europe Building Information Modeling Market Net Sales Share, By Geography, 2018 (%)
Figure 170: Company 13 Europe Building Information Modeling Market Net Revenue, By Years, 2018-2019* ($)
Figure 171: Company 13 Europe Building Information Modeling Market Net Revenue Share, By Business segments, 2018 (%)
Figure 172: Company 13 Europe Building Information Modeling Market Net Sales Share, By Geography, 2018 (%)
Figure 173: Company 14 Europe Building Information Modeling Market Net Revenue, By Years, 2018-2019* ($)
Figure 174: Company 14 Europe Building Information Modeling Market Net Revenue Share, By Business segments, 2018 (%)
Figure 175: Company 14 Europe Building Information Modeling Market Net Sales Share, By Geography, 2018 (%)
Figure 176: Company 15 Europe Building Information Modeling Market Net Revenue, By Years, 2018-2019* ($)
Figure 177: Company 15 Europe Building Information Modeling Market Net Revenue Share, By Business segments, 2018 (%)
Figure 178: Company 15 Europe Building Information Modeling Market Net Sales Share, By Geography, 2018 (%)