 Email
Email Print
Print


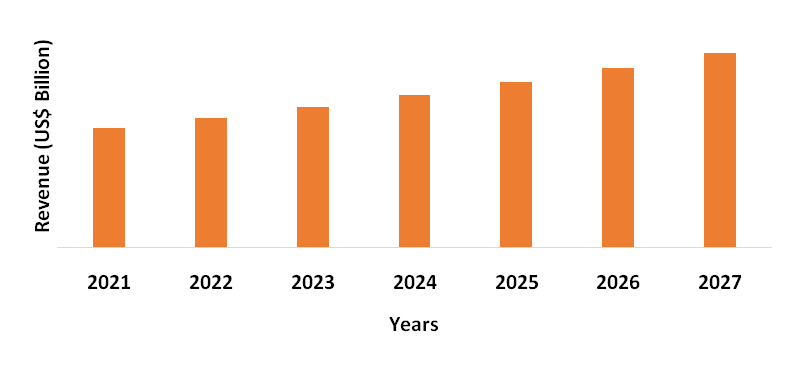
PSF from PET Recycled Bottles Market - Forecast(2024 - 2030)
PSF from PET Recycled Bottles Market Overview
The PSF from PET Recycled Bottles Market size is
projected to reach US$2.8 billion by 2027, after growing at a CAGR of 6.3%
during the forecast period 2022-2027. Polyester staple fiber is a type of
polyester fiber composed of purified terephthalic acid and monoethylene glycol
chips or PET bottle flakes. PSF is a synthetic polymer fiber derived from PET
waste and post-consumption PET bottles. PSF from PET recycled bottles are
durable and lightweight, highly wrinkle-resistant and dry quickly over polyvinyl chloride, making
them ideal for outerwear to extend product shelf life. Thus, it is commonly used
as a polyfill to stuff cushions, soft toys, pillows and a variety of other
items that require soft stuffing. The PSF from PET recycled bottles market
growth is primarily driven by the growth of the home furnishing segment.
However, in 2020, the Covid-19 pandemic caused ripples in the PSF from PET
recycled bottles industry growth. In 2021, the surge in home furnishing,
automotive and other sectors benefited the PSF from PET recycled bottles industry
growth. Moreover, the bolstering textile
industry is expected to fuel the demand for PSF from PET recycled bottles. This
will fuel the PSF from PET recycled bottles market size growth during the
forecast period of 2022-2027.
Report Coverage
The "PSF
from PET Recycled Bottles Report Market–Forecast (2022-2027)” by IndustryARC, covers an
in-depth analysis of the following segments in the PSF from PET Recycled
Bottles Market.
By Process: Mechanical and Chemical
By End-Use Industry: Automotive (Roof Insulation, Carpet and
Others), Home Furnishing (Pillows, Cushions, Mattress and Others),
Construction, Textiles and Others
By Geography: North America (the USA, Canada and Mexico), Europe (UK,
Germany, France, Italy, Netherlands, Spain, Russia, Belgium and the Rest of
Europe), Asia-Pacific (China, Japan, India, South Korea, Australia and New
Zealand, Indonesia, Taiwan, Malaysia and Rest of APAC), South America (Brazil,
Argentina, Colombia, Chile and Rest of South America), Rest of the World
(Middle East (Saudi Arabia, UAE, Israel and Rest of Middle East) and Africa
(South Africa, Nigeria and Rest of Africa))
Key Takeaways
- North America dominated the PSF from PET Recycled Bottles Market, owing to the growing home furnishing industry in the region. For instance, according to the American Home Furnishing Alliance, in 2020, the furnishing industry in the USA was valued at US$47.4 billion and in 2021, it was US$50.3 billion, an increase of 1.06%.
- The surging adoption of the chemical recycling process due to its low carbon footprint is benefiting the PSF from PET Recycled Bottles Market growth.
- Moreover, the factors such as the rapid pace of industrialization, increasing purchasing power and other similar factors are key determinants driving the automotive industry growth. As a result, demand for roof insulation, carpet and other products is increasing, this, in turn, is propelling the market growth.
- However, the high cost and slow recycling of PET bottles are estimated to limit the PSF from PET Recycled Bottles industry growth in upcoming years.
PSF from PET Recycled Bottles Market Segment Analysis
– by Process
The chemical segment held the largest
PSF from PET Recycled Bottles Market share in 2021 and is forecasted to grow at
a CAGR of 6.5% during the forecast period 2022-2027. Chemical recycling is
defined as the process of chemically converting polymers to monomers or
partially depolymerizing polymers to oligomers. The resulting monomers can be
used to perform new polymerizations to replicate the original or a related
polymeric product. The process starts with monomers, oligomers, or mixtures of
other hydrocarbon compounds, this method can transform the plastic material
into smaller molecules suitable for use as feedstock material. Furthermore,
mechanical recycling requires clean waste streams. Chemical recycling does not
require extensive sorting and can recycle the majority of plastics entirely.
Hence, due to such benefits of chemical processing, it is often adopted in the
manufacturing of PSF from PET recycled bottles, which, in turn, is expected to
fuel the growth of the market.
PSF from PET Recycled Bottles Market Segment Analysis – by End-use Industry
The Home Furnishing segment held
the largest PSF from PET Recycled Bottles Market share in 2021 and is forecasted
to grow at a CAGR of 6.8% during the forecast period. The PSF from
PET manufactured and composed
of purified terephthalic acid and monoethylene glycol chips are recycled.
These bottles are utilized in the home furnishing industry for fiber filling
and wadding of pillows, cushions, mattresses and others. Contrary to the
traditional practices of homes being decorated economically and without any
aesthetic décor, the home furnishings industry is booming with elevated demand
from consumers for do-it-yourself products and recyclable decor products. The
surging demand for outdoor home furnishing products is accelerating the home
furnishing industry's growth. For instance, according to recent statistics
published by the International Casual Furnishings Association, 90 percent of
Americans agree that their outdoor living space is more valuable than ever,
with 78 percent making outside improvements during 2020. Hence, the growing
home furnishing industry is expected to fuel the demand for pillows, cushions,
mattresses and others. This, in turn, will fuel the PSF from PET recycled
bottles market size in the upcoming few years.
PSF from PET Recycled Bottles Market Segment Analysis – by Geography
North America is the dominating region as it held the largest PSF from PET Recycled Bottles Market share in 2021 up to 36%. The North American region's economic growth is driven by the growth of various industries such as home furnishing, textile and more. The surge in the new and renovation construction activities and the surging disposable income of people in the North American region are the key determinants driving the home furnishing industry growth. For instance, according to the American Home Furnishing Alliance (AHFA), in 2019, the total sales of home furnishing in the USA was US4130.9 billion and in 2020, it was US$141.7 billion, an increase of 8.2%. Also, according to the recent statistics published by the International Casual Furnishings Association, in 2022, 63% of Americans plan to upgrade their outdoor furniture or accessories. Sofas, pillows, rugs and more are among the home furnishing products planned for purchase. Therefore, the growth of the home furnishing industry in the North American region is fueling the demand for pillows, cushions, mattresses and others. This is expected to propel the PSF from the PET Recycled Bottles market size growth during the projected forecast period.
PSF from PET Recycled Bottles Market Drivers
Government Initiatives for Textile Industry
In the textile industry, PSF from PET Recycled Bottles composed of purified terephthalic acid, monoethylene glycol chips and other materials are employed in fabric manufacturing to enhance its durability. Federal governments worldwide are taking initiatives to support sustainable growth, modernization, value addition, higher exports and overall development of the textile sector. For instance, the European Union 2030 Vision for Textiles strategy aims to make the textile industry more environmentally friendly, competitive and robust to global shocks. In addition, the federal governments of African countries have started several efforts to develop new textile factories throughout the area to boost textile production in the region. These programs aim to increase textile and garment production in Africa by 2030. Therefore, such government initiatives for the textile industry will fuel the production of the textile industry. Thus, as a result of such initiatives, the textile output will expand and owing to this demand PSF will surge, which is likely to fuel market expansion during the forecast period.
Booming Automotive Industry
PSF from PET Recycled Bottles has various benefits such as performance-benefit, superior durability and more over polyvinyl chloride. Due to such benefits, it is often deployed in automotive products such as roof insulation, carpet and others. The global automotive industry is growing due to the factors such as increasing disposable income, the rapid pace of industrialization and more. For instance, according to the Organisation Internationale des Constructeurs d'Automobiles (OICA), in 2020, the worldwide automotive production was 77,711,725 units and in 2021, it was 80,154,988 units, an increase of approximately 3%. Also, in 2020, the worldwide passenger cars were 55,908,989 units and in 2021, it was 57,054,295 units, an increase of 2%. Thus, the growing automotive industry is boosting the demand for PSF from PET recycled bottle-based products, which, in turn, is driving market growth.
PSF from PET Recycled Bottles Market Challenge
High Cost and Slow Recycling of PET Bottles
The PSF from PET Recycled Bottles has several advantages over polyvinyl chloride, including higher tensile strength, energy-saving and results in a reduction in the plastic landfill. Nonetheless, on the hand land, the high cost of PET recycled bottles. The sophisticated manufacturing process utilized for the production of PET recycled bottles adds to the overall cost of the PSF from PET recycled bottles. Moreover, color separation is also one of the difficult processes utilized during the manufacturing of PSF from PET recycled bottles. In addition, the slower phase of PET recycling limits its use in the PSF. For instance, according to a study conducted by the NGO Zero Waste Europe, new bottles placed on the EU market in 2021 contained an average of just 17 percent recycled PET, although plastic bottles have a recycling rate of around 50 percent. Therefore, the high cost of PSF from PET recycled bottles and low PET bottle recycling is restricting the market growth.
PSF from PET Recycled Bottles Industry Outlook
Technology launches, acquisitions and increased R&D activities are key strategies adopted by players in the PSF from PET Recycled Bottles Market. The top 10 companies in the PSF from PET Recycled Bottles market are:
- Toray Industries, Inc.
- Lenzing AG
- Indorama Corporation
- Mitsubishi Chemical Holdings Corporation
- Reliance Industries Limited
- Far Eastern Group
- Zhejiang Hengyi Group Co. Ltd.
- W. Barnet GmbH & Co. KG
- Alpek S.A.B. de C.V.
- DiyouFibre
Recent Developments
- In August 2021, Reliance Industries Limited (RIL) announced to double its PET recycling capacity by establishing a recycled polyester staple fiber (PSF) manufacturing facility in Andhra Pradesh, India. The expansions lie this will benefit the market growth.
- In February 2019, Indorama Corporation, a global leader in chemical-based product manufacturing, acquired M&G Fibras Brasil, which has a manufacturing capacity of 75,000 tons per year. The company intended to increase its production capacity for polyester staple fibers (PSF) and speed up the manufacturing process with the assistance of Indorama Corporation.
Relevant Reports
Report Code: CMR 42876
Report Code: CMR 13887
Report Code: CMR 93624
For more Chemicals and Materials Market reports, please click here
Table 1: PSF from PET Recycled Bottles Market Overview 2021-2026
Table 2: PSF from PET Recycled Bottles Market Leader Analysis 2018-2019 (US$)
Table 3: PSF from PET Recycled Bottles Market Product Analysis 2018-2019 (US$)
Table 4: PSF from PET Recycled Bottles Market End User Analysis 2018-2019 (US$)
Table 5: PSF from PET Recycled Bottles Market Patent Analysis 2013-2018* (US$)
Table 6: PSF from PET Recycled Bottles Market Financial Analysis 2018-2019 (US$)
Table 7: PSF from PET Recycled Bottles Market Driver Analysis 2018-2019 (US$)
Table 8: PSF from PET Recycled Bottles Market Challenges Analysis 2018-2019 (US$)
Table 9: PSF from PET Recycled Bottles Market Constraint Analysis 2018-2019 (US$)
Table 10: PSF from PET Recycled Bottles Market Supplier Bargaining Power Analysis 2018-2019 (US$)
Table 11: PSF from PET Recycled Bottles Market Buyer Bargaining Power Analysis 2018-2019 (US$)
Table 12: PSF from PET Recycled Bottles Market Threat of Substitutes Analysis 2018-2019 (US$)
Table 13: PSF from PET Recycled Bottles Market Threat of New Entrants Analysis 2018-2019 (US$)
Table 14: PSF from PET Recycled Bottles Market Degree of Competition Analysis 2018-2019 (US$)
Table 15: PSF from PET Recycled Bottles Market Value Chain Analysis 2018-2019 (US$)
Table 16: PSF from PET Recycled Bottles Market Pricing Analysis 2021-2026 (US$)
Table 17: PSF from PET Recycled Bottles Market Opportunities Analysis 2021-2026 (US$)
Table 18: PSF from PET Recycled Bottles Market Product Life Cycle Analysis 2021-2026 (US$)
Table 19: PSF from PET Recycled Bottles Market Supplier Analysis 2018-2019 (US$)
Table 20: PSF from PET Recycled Bottles Market Distributor Analysis 2018-2019 (US$)
Table 21: PSF from PET Recycled Bottles Market Trend Analysis 2018-2019 (US$)
Table 22: PSF from PET Recycled Bottles Market Size 2018 (US$)
Table 23: PSF from PET Recycled Bottles Market Forecast Analysis 2021-2026 (US$)
Table 24: PSF from PET Recycled Bottles Market Sales Forecast Analysis 2021-2026 (Units)
Table 25: PSF from PET Recycled Bottles Market , Revenue & Volume, By Process, 2021-2026 ($)
Table 26: PSF from PET Recycled Bottles Market By Process, Revenue & Volume, By Mechanical, 2021-2026 ($)
Table 27: PSF from PET Recycled Bottles Market By Process, Revenue & Volume, By Chemical, 2021-2026 ($)
Table 28: PSF from PET Recycled Bottles Market , Revenue & Volume, By Industry, 2021-2026 ($)
Table 29: PSF from PET Recycled Bottles Market By Industry, Revenue & Volume, By Automotive, 2021-2026 ($)
Table 30: PSF from PET Recycled Bottles Market By Industry, Revenue & Volume, By Home Furnishing, 2021-2026 ($)
Table 31: PSF from PET Recycled Bottles Market By Industry, Revenue & Volume, By Apparel, 2021-2026 ($)
Table 32: PSF from PET Recycled Bottles Market By Industry, Revenue & Volume, By Construction, 2021-2026 ($)
Table 33: PSF from PET Recycled Bottles Market By Industry, Revenue & Volume, By Construction, 2021-2026 ($)
Table 34: North America PSF from PET Recycled Bottles Market , Revenue & Volume, By Process, 2021-2026 ($)
Table 35: North America PSF from PET Recycled Bottles Market , Revenue & Volume, By Industry, 2021-2026 ($)
Table 36: South america PSF from PET Recycled Bottles Market , Revenue & Volume, By Process, 2021-2026 ($)
Table 37: South america PSF from PET Recycled Bottles Market , Revenue & Volume, By Industry, 2021-2026 ($)
Table 38: Europe PSF from PET Recycled Bottles Market , Revenue & Volume, By Process, 2021-2026 ($)
Table 39: Europe PSF from PET Recycled Bottles Market , Revenue & Volume, By Industry, 2021-2026 ($)
Table 40: APAC PSF from PET Recycled Bottles Market , Revenue & Volume, By Process, 2021-2026 ($)
Table 41: APAC PSF from PET Recycled Bottles Market , Revenue & Volume, By Industry, 2021-2026 ($)
Table 42: Middle East & Africa PSF from PET Recycled Bottles Market , Revenue & Volume, By Process, 2021-2026 ($)
Table 43: Middle East & Africa PSF from PET Recycled Bottles Market , Revenue & Volume, By Industry, 2021-2026 ($)
Table 44: Russia PSF from PET Recycled Bottles Market , Revenue & Volume, By Process, 2021-2026 ($)
Table 45: Russia PSF from PET Recycled Bottles Market , Revenue & Volume, By Industry, 2021-2026 ($)
Table 46: Israel PSF from PET Recycled Bottles Market , Revenue & Volume, By Process, 2021-2026 ($)
Table 47: Israel PSF from PET Recycled Bottles Market , Revenue & Volume, By Industry, 2021-2026 ($)
Table 48: Top Companies 2018 (US$) PSF from PET Recycled Bottles Market , Revenue & Volume
Table 49: Product Launch 2018-2019 PSF from PET Recycled Bottles Market , Revenue & Volume
Table 50: Mergers & Acquistions 2018-2019 PSF from PET Recycled Bottles Market , Revenue & Volume
List of Figures:
Figure 1: Overview of PSF from PET Recycled Bottles Market 2021-2026
Figure 2: Market Share Analysis for PSF from PET Recycled Bottles Market 2018 (US$)
Figure 3: Product Comparison in PSF from PET Recycled Bottles Market 2018-2019 (US$)
Figure 4: End User Profile for PSF from PET Recycled Bottles Market 2018-2019 (US$)
Figure 5: Patent Application and Grant in PSF from PET Recycled Bottles Market 2013-2018* (US$)
Figure 6: Top 5 Companies Financial Analysis in PSF from PET Recycled Bottles Market 2018-2019 (US$)
Figure 7: Market Entry Strategy in PSF from PET Recycled Bottles Market 2018-2019
Figure 8: Ecosystem Analysis in PSF from PET Recycled Bottles Market 2018
Figure 9: Average Selling Price in PSF from PET Recycled Bottles Market 2021-2026
Figure 10: Top Opportunites in PSF from PET Recycled Bottles Market 2018-2019
Figure 11: Market Life Cycle Analysis in PSF from PET Recycled Bottles Market
Figure 12: GlobalBy Process PSF from PET Recycled Bottles Market Revenue, 2021-2026 ($)
Figure 13: GlobalBy Industry PSF from PET Recycled Bottles Market Revenue, 2021-2026 ($)
Figure 14: Global PSF from PET Recycled Bottles Market - By Geography
Figure 15: Global PSF from PET Recycled Bottles Market Value & Volume, By Geography, 2021-2026 ($)
Figure 16: Global PSF from PET Recycled Bottles Market CAGR, By Geography, 2021-2026 (%)
Figure 17: North America PSF from PET Recycled Bottles Market Value & Volume, 2021-2026 ($)
Figure 18: US PSF from PET Recycled Bottles Market Value & Volume, 2021-2026 ($)
Figure 19: US GDP and Population, 2018-2019 ($)
Figure 20: US GDP – Composition of 2018, By Sector of Origin
Figure 21: US Export and Import Value & Volume, 2018-2019 ($)
Figure 22: Canada PSF from PET Recycled Bottles Market Value & Volume, 2021-2026 ($)
Figure 23: Canada GDP and Population, 2018-2019 ($)
Figure 24: Canada GDP – Composition of 2018, By Sector of Origin
Figure 25: Canada Export and Import Value & Volume, 2018-2019 ($)
Figure 26: Mexico PSF from PET Recycled Bottles Market Value & Volume, 2021-2026 ($)
Figure 27: Mexico GDP and Population, 2018-2019 ($)
Figure 28: Mexico GDP – Composition of 2018, By Sector of Origin
Figure 29: Mexico Export and Import Value & Volume, 2018-2019 ($)
Figure 30: South America PSF from PET Recycled Bottles Market Value & Volume, 2021-2026 ($)
Figure 31: Brazil PSF from PET Recycled Bottles Market Value & Volume, 2021-2026 ($)
Figure 32: Brazil GDP and Population, 2018-2019 ($)
Figure 33: Brazil GDP – Composition of 2018, By Sector of Origin
Figure 34: Brazil Export and Import Value & Volume, 2018-2019 ($)
Figure 35: Venezuela PSF from PET Recycled Bottles Market Value & Volume, 2021-2026 ($)
Figure 36: Venezuela GDP and Population, 2018-2019 ($)
Figure 37: Venezuela GDP – Composition of 2018, By Sector of Origin
Figure 38: Venezuela Export and Import Value & Volume, 2018-2019 ($)
Figure 39: Argentina PSF from PET Recycled Bottles Market Value & Volume, 2021-2026 ($)
Figure 40: Argentina GDP and Population, 2018-2019 ($)
Figure 41: Argentina GDP – Composition of 2018, By Sector of Origin
Figure 42: Argentina Export and Import Value & Volume, 2018-2019 ($)
Figure 43: Ecuador PSF from PET Recycled Bottles Market Value & Volume, 2021-2026 ($)
Figure 44: Ecuador GDP and Population, 2018-2019 ($)
Figure 45: Ecuador GDP – Composition of 2018, By Sector of Origin
Figure 46: Ecuador Export and Import Value & Volume, 2018-2019 ($)
Figure 47: Peru PSF from PET Recycled Bottles Market Value & Volume, 2021-2026 ($)
Figure 48: Peru GDP and Population, 2018-2019 ($)
Figure 49: Peru GDP – Composition of 2018, By Sector of Origin
Figure 50: Peru Export and Import Value & Volume, 2018-2019 ($)
Figure 51: Colombia PSF from PET Recycled Bottles Market Value & Volume, 2021-2026 ($)
Figure 52: Colombia GDP and Population, 2018-2019 ($)
Figure 53: Colombia GDP – Composition of 2018, By Sector of Origin
Figure 54: Colombia Export and Import Value & Volume, 2018-2019 ($)
Figure 55: Costa Rica PSF from PET Recycled Bottles Market Value & Volume, 2021-2026 ($)
Figure 56: Costa Rica GDP and Population, 2018-2019 ($)
Figure 57: Costa Rica GDP – Composition of 2018, By Sector of Origin
Figure 58: Costa Rica Export and Import Value & Volume, 2018-2019 ($)
Figure 59: Europe PSF from PET Recycled Bottles Market Value & Volume, 2021-2026 ($)
Figure 60: U.K PSF from PET Recycled Bottles Market Value & Volume, 2021-2026 ($)
Figure 61: U.K GDP and Population, 2018-2019 ($)
Figure 62: U.K GDP – Composition of 2018, By Sector of Origin
Figure 63: U.K Export and Import Value & Volume, 2018-2019 ($)
Figure 64: Germany PSF from PET Recycled Bottles Market Value & Volume, 2021-2026 ($)
Figure 65: Germany GDP and Population, 2018-2019 ($)
Figure 66: Germany GDP – Composition of 2018, By Sector of Origin
Figure 67: Germany Export and Import Value & Volume, 2018-2019 ($)
Figure 68: Italy PSF from PET Recycled Bottles Market Value & Volume, 2021-2026 ($)
Figure 69: Italy GDP and Population, 2018-2019 ($)
Figure 70: Italy GDP – Composition of 2018, By Sector of Origin
Figure 71: Italy Export and Import Value & Volume, 2018-2019 ($)
Figure 72: France PSF from PET Recycled Bottles Market Value & Volume, 2021-2026 ($)
Figure 73: France GDP and Population, 2018-2019 ($)
Figure 74: France GDP – Composition of 2018, By Sector of Origin
Figure 75: France Export and Import Value & Volume, 2018-2019 ($)
Figure 76: Netherlands PSF from PET Recycled Bottles Market Value & Volume, 2021-2026 ($)
Figure 77: Netherlands GDP and Population, 2018-2019 ($)
Figure 78: Netherlands GDP – Composition of 2018, By Sector of Origin
Figure 79: Netherlands Export and Import Value & Volume, 2018-2019 ($)
Figure 80: Belgium PSF from PET Recycled Bottles Market Value & Volume, 2021-2026 ($)
Figure 81: Belgium GDP and Population, 2018-2019 ($)
Figure 82: Belgium GDP – Composition of 2018, By Sector of Origin
Figure 83: Belgium Export and Import Value & Volume, 2018-2019 ($)
Figure 84: Spain PSF from PET Recycled Bottles Market Value & Volume, 2021-2026 ($)
Figure 85: Spain GDP and Population, 2018-2019 ($)
Figure 86: Spain GDP – Composition of 2018, By Sector of Origin
Figure 87: Spain Export and Import Value & Volume, 2018-2019 ($)
Figure 88: Denmark PSF from PET Recycled Bottles Market Value & Volume, 2021-2026 ($)
Figure 89: Denmark GDP and Population, 2018-2019 ($)
Figure 90: Denmark GDP – Composition of 2018, By Sector of Origin
Figure 91: Denmark Export and Import Value & Volume, 2018-2019 ($)
Figure 92: APAC PSF from PET Recycled Bottles Market Value & Volume, 2021-2026 ($)
Figure 93: China PSF from PET Recycled Bottles Market Value & Volume, 2021-2026
Figure 94: China GDP and Population, 2018-2019 ($)
Figure 95: China GDP – Composition of 2018, By Sector of Origin
Figure 96: China Export and Import Value & Volume, 2018-2019 ($) PSF from PET Recycled Bottles Market China Export and Import Value & Volume, 2018-2019 ($)
Figure 97: Australia PSF from PET Recycled Bottles Market Value & Volume, 2021-2026 ($)
Figure 98: Australia GDP and Population, 2018-2019 ($)
Figure 99: Australia GDP – Composition of 2018, By Sector of Origin
Figure 100: Australia Export and Import Value & Volume, 2018-2019 ($)
Figure 101: South Korea PSF from PET Recycled Bottles Market Value & Volume, 2021-2026 ($)
Figure 102: South Korea GDP and Population, 2018-2019 ($)
Figure 103: South Korea GDP – Composition of 2018, By Sector of Origin
Figure 104: South Korea Export and Import Value & Volume, 2018-2019 ($)
Figure 105: India PSF from PET Recycled Bottles Market Value & Volume, 2021-2026 ($)
Figure 106: India GDP and Population, 2018-2019 ($)
Figure 107: India GDP – Composition of 2018, By Sector of Origin
Figure 108: India Export and Import Value & Volume, 2018-2019 ($)
Figure 109: Taiwan PSF from PET Recycled Bottles Market Value & Volume, 2021-2026 ($)
Figure 110: Taiwan GDP and Population, 2018-2019 ($)
Figure 111: Taiwan GDP – Composition of 2018, By Sector of Origin
Figure 112: Taiwan Export and Import Value & Volume, 2018-2019 ($)
Figure 113: Malaysia PSF from PET Recycled Bottles Market Value & Volume, 2021-2026 ($)
Figure 114: Malaysia GDP and Population, 2018-2019 ($)
Figure 115: Malaysia GDP – Composition of 2018, By Sector of Origin
Figure 116: Malaysia Export and Import Value & Volume, 2018-2019 ($)
Figure 117: Hong Kong PSF from PET Recycled Bottles Market Value & Volume, 2021-2026 ($)
Figure 118: Hong Kong GDP and Population, 2018-2019 ($)
Figure 119: Hong Kong GDP – Composition of 2018, By Sector of Origin
Figure 120: Hong Kong Export and Import Value & Volume, 2018-2019 ($)
Figure 121: Middle East & Africa PSF from PET Recycled Bottles Market Middle East & Africa 3D Printing Market Value & Volume, 2021-2026 ($)
Figure 122: Russia PSF from PET Recycled Bottles Market Value & Volume, 2021-2026 ($)
Figure 123: Russia GDP and Population, 2018-2019 ($)
Figure 124: Russia GDP – Composition of 2018, By Sector of Origin
Figure 125: Russia Export and Import Value & Volume, 2018-2019 ($)
Figure 126: Israel PSF from PET Recycled Bottles Market Value & Volume, 2021-2026 ($)
Figure 127: Israel GDP and Population, 2018-2019 ($)
Figure 128: Israel GDP – Composition of 2018, By Sector of Origin
Figure 129: Israel Export and Import Value & Volume, 2018-2019 ($)
Figure 130: Entropy Share, By Strategies, 2018-2019* (%) PSF from PET Recycled Bottles Market
Figure 131: Developments, 2018-2019* PSF from PET Recycled Bottles Market
Figure 132: Company 1 PSF from PET Recycled Bottles Market Net Revenue, By Years, 2018-2019* ($)
Figure 133: Company 1 PSF from PET Recycled Bottles Market Net Revenue Share, By Business segments, 2018 (%)
Figure 134: Company 1 PSF from PET Recycled Bottles Market Net Sales Share, By Geography, 2018 (%)
Figure 135: Company 2 PSF from PET Recycled Bottles Market Net Revenue, By Years, 2018-2019* ($)
Figure 136: Company 2 PSF from PET Recycled Bottles Market Net Revenue Share, By Business segments, 2018 (%)
Figure 137: Company 2 PSF from PET Recycled Bottles Market Net Sales Share, By Geography, 2018 (%)
Figure 138: Company 3 PSF from PET Recycled Bottles Market Net Revenue, By Years, 2018-2019* ($)
Figure 139: Company 3 PSF from PET Recycled Bottles Market Net Revenue Share, By Business segments, 2018 (%)
Figure 140: Company 3 PSF from PET Recycled Bottles Market Net Sales Share, By Geography, 2018 (%)
Figure 141: Company 4 PSF from PET Recycled Bottles Market Net Revenue, By Years, 2018-2019* ($)
Figure 142: Company 4 PSF from PET Recycled Bottles Market Net Revenue Share, By Business segments, 2018 (%)
Figure 143: Company 4 PSF from PET Recycled Bottles Market Net Sales Share, By Geography, 2018 (%)
Figure 144: Company 5 PSF from PET Recycled Bottles Market Net Revenue, By Years, 2018-2019* ($)
Figure 145: Company 5 PSF from PET Recycled Bottles Market Net Revenue Share, By Business segments, 2018 (%)
Figure 146: Company 5 PSF from PET Recycled Bottles Market Net Sales Share, By Geography, 2018 (%)
Figure 147: Company 6 PSF from PET Recycled Bottles Market Net Revenue, By Years, 2018-2019* ($)
Figure 148: Company 6 PSF from PET Recycled Bottles Market Net Revenue Share, By Business segments, 2018 (%)
Figure 149: Company 6 PSF from PET Recycled Bottles Market Net Sales Share, By Geography, 2018 (%)
Figure 150: Company 7 PSF from PET Recycled Bottles Market Net Revenue, By Years, 2018-2019* ($)
Figure 151: Company 7 PSF from PET Recycled Bottles Market Net Revenue Share, By Business segments, 2018 (%)
Figure 152: Company 7 PSF from PET Recycled Bottles Market Net Sales Share, By Geography, 2018 (%)
Figure 153: Company 8 PSF from PET Recycled Bottles Market Net Revenue, By Years, 2018-2019* ($)
Figure 154: Company 8 PSF from PET Recycled Bottles Market Net Revenue Share, By Business segments, 2018 (%)
Figure 155: Company 8 PSF from PET Recycled Bottles Market Net Sales Share, By Geography, 2018 (%)
Figure 156: Company 9 PSF from PET Recycled Bottles Market Net Revenue, By Years, 2018-2019* ($)
Figure 157: Company 9 PSF from PET Recycled Bottles Market Net Revenue Share, By Business segments, 2018 (%)
Figure 158: Company 9 PSF from PET Recycled Bottles Market Net Sales Share, By Geography, 2018 (%)
Figure 159: Company 10 PSF from PET Recycled Bottles Market Net Revenue, By Years, 2018-2019* ($)
Figure 160: Company 10 PSF from PET Recycled Bottles Market Net Revenue Share, By Business segments, 2018 (%)
Figure 161: Company 10 PSF from PET Recycled Bottles Market Net Sales Share, By Geography, 2018 (%)
Figure 162: Company 11 PSF from PET Recycled Bottles Market Net Revenue, By Years, 2018-2019* ($)
Figure 163: Company 11 PSF from PET Recycled Bottles Market Net Revenue Share, By Business segments, 2018 (%)
Figure 164: Company 11 PSF from PET Recycled Bottles Market Net Sales Share, By Geography, 2018 (%)
Figure 165: Company 12 PSF from PET Recycled Bottles Market Net Revenue, By Years, 2018-2019* ($)
Figure 166: Company 12 PSF from PET Recycled Bottles Market Net Revenue Share, By Business segments, 2018 (%)
Figure 167: Company 12 PSF from PET Recycled Bottles Market Net Sales Share, By Geography, 2018 (%)
Figure 168: Company 13 PSF from PET Recycled Bottles Market Net Revenue, By Years, 2018-2019* ($)
Figure 169: Company 13 PSF from PET Recycled Bottles Market Net Revenue Share, By Business segments, 2018 (%)
Figure 170: Company 13 PSF from PET Recycled Bottles Market Net Sales Share, By Geography, 2018 (%)
Figure 171: Company 14 PSF from PET Recycled Bottles Market Net Revenue, By Years, 2018-2019* ($)
Figure 172: Company 14 PSF from PET Recycled Bottles Market Net Revenue Share, By Business segments, 2018 (%)
Figure 173: Company 14 PSF from PET Recycled Bottles Market Net Sales Share, By Geography, 2018 (%)
Figure 174: Company 15 PSF from PET Recycled Bottles Market Net Revenue, By Years, 2018-2019* ($)
Figure 175: Company 15 PSF from PET Recycled Bottles Market Net Revenue Share, By Business segments, 2018 (%)
Figure 176: Company 15 PSF from PET Recycled Bottles Market Net Sales Share, By Geography, 2018 (%)