 Email
Email Print
Print


North America Adsorbent Market - Forecast(2024 - 2030)
North America Adsorbent Market Overview
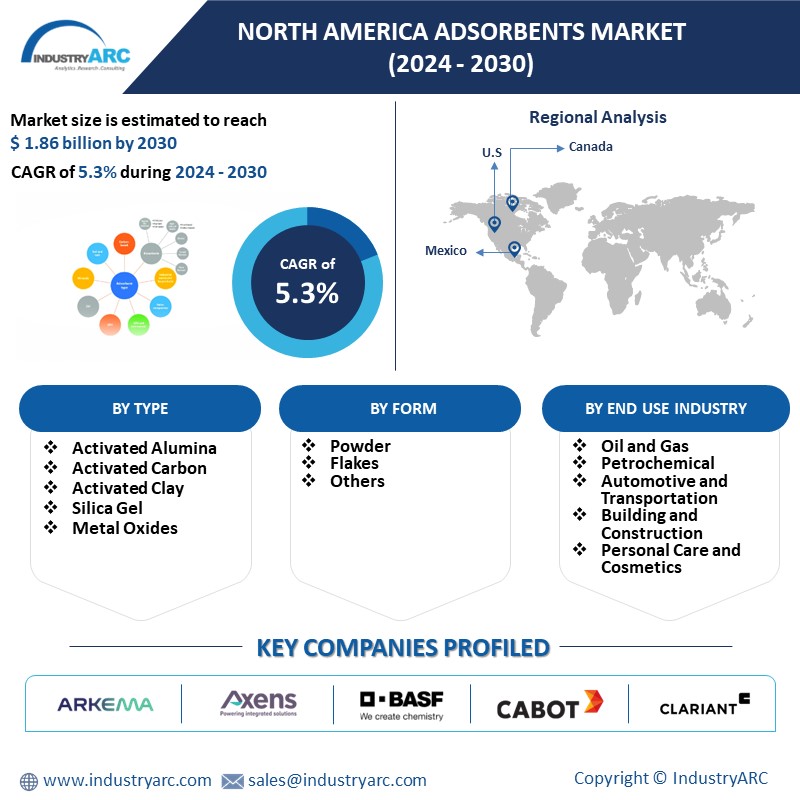
The North America Adsorbent Market size is forecasted to grow at a CAGR of 5.3% during the forecast period 2024-2030 and reach US$1.86 billion by 2030. Adsorbents are substances that are primarily used to extract pollutants from a liquid or gas. It can be categorized into various types which include activated carbon, molecular sieves, activated alumina, clay, silica gel and more. Adsorbents are used in a wide range of industries such as petrochemical, water treatment, medical, metallurgy, textile and other industries. Among these, activated carbon holds the largest market share due to its extensive use in water treatment plants and air purification applications. The U.S. dominates the North American market, accounting for the majority of the market share. This is attributed to the presence of a large number of petrochemical industries and stringent environmental regulations in the country. The COVID-19 lockdown had significantly reduced production activities as a result of the country-wise shutdown of manufacturing sites, shortage of labor and the decline of the supply and demand chain all across North America, which temporarily halted production from some of the major industries such as petrochemical, water treatment and more. This, in turn, reduced the demand for adsorbents that are primarily used in such industries for petroleum refining, water purification and other similar applications, thus, affecting the North American adsorbent industry. However, a steady recovery in development activities from multiple industries has been witnessed across North America, this led to an increase in demand for adsorbents for use in water treatment and purification applications, thus, fueling the market growth. The surging development of wastewater treatment facilities along with the increasing demand from the petrochemical industry is expected to drive the growth of the North America adsorbent market size in the upcoming years. On the other hand, the lower shelf life of adsorbents may confine the growth of the market. In conclusion, the North America adsorbent market is expected to witness significant growth in the coming years, driven by increasing demand from various end-use industries and stringent environmental regulations. However, challenges such as the lower shelf life of adsorbents may hinder market growth.
Market Snapshot:
North America Adsorbent Market Report Coverage
The report: “North America Adsorbent Market Report – Forecast (2024-2030)” by IndustryARC, covers an in-depth analysis of the following segments in the North America Adsorbent Market.
By Type: Activated Alumina, Activated Carbon, Activated Clay, Silica Gel, Metal Oxides, Polymer Adsorbents, Zeolites (Molecular Sieves) (Type 3A, Others) and Others.
By Form: Powder, Flakes and Others.
By End-Use Application: Oil and Gas Industry (Natural Gas Purification, Gasoline, Diesel and Jet Fuel Production, Others), Petrochemical Industry (Ethylene Production, Propylene Production, Xylene Separation, Others), Chemical Industry (Industrial Gases, CASE (Coatings, Sealants, Adhesives and Elastomers), Others), Automotive and Transportation, Pharmaceutical and Food, Water Treatment, Nuclear Waste Remediation, Refrigerant (Commercial, Industrial), Building & Construction, Personal Care and Cosmetic and Others.
By Country: The USA, Canada and Mexico.
Key Takeaways
• The activated carbon segment held a significant share in the North America Adsorbent Market in 2023. Its wide range of characteristics and operational efficiency made it stand out in comparison to other types of adsorbents in the market.
• Petrochemical industry held the largest share in the North America Adsorbent Market in 2023, owing to the increasing demand for adsorbents for petroleum refining applications in the petrochemical sectors.
• The United States dominated the North America Adsorbent Market in 2021, owing to the increasing demand for adsorbents from the petrochemical sectors in the country.
• A detailed analysis of strengths, weaknesses, opportunities and threats will be provided in the North America Adsorbent Market Report.
For More Details on This Report - Request for Sample
North America Adsorbent Market Segment Analysis – by Type
The activated carbon segment held a significant North America Adsorbent Market share in 2023, owing to its increasing demand due to the characteristics and benefits it offers over other types of adsorbents. For instance, activated carbon offers a very high removal capacity of organic impurities and toxic substances as compared to activated alumina, clay, silica gel and other types of adsorbents. They offer excellent removal of odor and are capable of removing carbon-based, organic chemicals as well as some microorganisms. Moreover, activated carbon is easy to use and maintain and has higher efficiency for VOC (Volatile Organic Compounds) removal in comparison to other types of adsorbents. Furthermore, they as more economical and cost-effective as opposed to other adsorbents. Hence, all of these benefits are driving its demand over other types of adsorbents, which in turn, is expected to boost the market growth in North America during the forecast period.
North America Adsorbent Market Segment Analysis – by End-use Industry
The petrochemical industry held the largest North America Adsorbent Market share of over 25% in 2023, owing to its increasing demand from the petrochemical sectors in the region. Adsorbents such as activated carbon, molecular sieves, activated alumina and silica gel are primarily used in petrochemical plants or refineries as a medium for the separation process in order to extract a component from a mixture. They are also used for the recovery or removal of sulfur from oil along with the removal of various pollutants and recovery of oil from wastewater in such petrochemical plants. For instance, Qatar Petroleum partnered with ExxonMobil for the development of the LNG expansion liquefaction plant worth US$10 billion in Texas, United States. The facility is scheduled for completion in 2024. In this way, such new development of petrochemical plants in the region is expected to increase the demand for adsorbents as a medium for petroleum refining applications as stated above. This is expected to expand the North American adsorbent market size during the forecast period.
Following closely behind is the water treatment sector, accounting for around 18% of the market. Adsorbents play a crucial role in purifying drinking water, treating wastewater, and removing contaminants in industrial applications. Other notable players include the chemical industry (12%), which leverages adsorbents for gas purification, air separation, and catalyst recovery. The automotive and transportation sector (10%) employs them for air and fuel filtration, while the building and construction industry (8%) utilizes them for air and water purification in enclosed spaces.
North America Adsorbent Market Segment Analysis – by Country
The United States held a dominant North America Adsorbent Market share of over 38% in the year 2023. The consumption of adsorbents is particularly high in this region due to its increasing demand from the petrochemical sectors in the country. For instance, Royal Dutch Shell invested around US$6 billion for the development of the petrochemicals plant in Pennsylvania, U.S.
Canada trails behind with a respectable 15.2% share. Its mining and oil & gas industries drive the demand for adsorbents, and environmental regulations are further propelling market growth. The presence of key manufacturing players also contributes to Canada's significant market presence.
Adsorbents are primarily used in petrochemical plants as a medium for the separation process in order to extract a component from a mixture. They are also used for the removal of various pollutants and recovery of oil from wastewater in such petrochemical plants. Thus, the surging development associated with the petrochemical sectors in the country is expected to increase the demand for adsorbents for refining applications in such plants. This is expected to accelerate the growth of the North America adsorbent market during the forecast period.
North America Adsorbent Market Drivers
Surging development of wastewater treatment facilities
Adsorbents such as activated carbon and activated alumina are primarily used for tertiary purification in the wastewater treatment facilities in order to remove organic micro-pollutants, COD (Chemical Oxygen Demand), along with the removal of specific contaminants such as heavy metals and oily molecules from wastewater. For instance, Government initiatives in the US and Canada, like the Infrastructure Investment and Jobs Act and the Investing in Canada Infrastructure Plan, are allocating billions towards water infrastructure projects. This financial backing is translating into concrete developments like Pennsylvania American Water's new $8.7 million treatment plant and Acciona's $159 million project in Mexico. Furthermore, Acciona announced its plans to build a water treatment plant in the municipality of Los Cabos in Mexico. The project has a budget of around US$159 million. The project is estimated to have a water treatment capacity of 250 liters per second, equivalent to 7,884,000 m3 per year. The new facility is scheduled to be delivered by 2023.
In this way, such surging development of wastewater treatment facilities in North America is expected to increase the demand for adsorbents for use in water purification and treatment applications in such facilities. This is expected to accelerate the growth of the market in North America in the upcoming years.
An increase in textile production
Adsorbents such as activated carbon, silica gel and molecular sieves are primarily used in the textile industry for the removal of textile dyes and for treating dyes contained in textile wastewaters and effluents, owing to their low cost and ease of operation. The surging investments, new facility development and government initiatives related to the textile industry are the key determinants that are driving the growth of the textile industry in North America. This increasing production from the textile industry in North America is expected to increase the demand for adsorbents utilized in such industries for the removal of textile dyes and treatment of dyes contained in textile wastewater and effluents. This is anticipated to drive the growth of the market in North America in the upcoming years.
Increased textile production might indirectly lead to higher demand for adsorbents in wastewater treatment. Textile manufacturing generates wastewater laden with dyes, chemicals, and fibers that require treatment before discharge. However, this effect wouldn't be solely attributable to textile production growth and would depend on overall industrial activity and stricter regulations. Similarly, adsorbents are used in air filtration systems within textile factories to control dust and emissions. Growth in textile production could translate to more demand for such filtration systems, leading to increased use of adsorbents.
North America Adsorbent Market Challenge
Lower shelf life of adsorbents may confine the market growth
The overall shelf life of a specific type of adsorbents used in separation, refining and purification procedures in multiple industries is limited, thus, it needs frequent replacement after a specific period of time. Adsorbents that are primarily employed in various industries such as petrochemical, wastewater treatment and more are highly susceptible to fouling, resulting in the degradation of their functional and operational quality. Applications such as the treatment of wastewater, petroleum refining, or any other purification process would result in unwanted components and pollutants forming precipitate on the adsorbent surface. This may foul the adsorbent and decrease the overall life expectancy of the adsorbent, as a result, frequent replacement of the adsorbents would be required. Thus, such issues associated with the lower shelf life of adsorbents may confine the growth of the North American adsorbent industry during the forecast period.
North America Adsorbent Industry Outlook
Technology launches, acquisitions and R&D activities are key strategies adopted by players in the North America Adsorbent Market. The top companies in North America Adsorbent Market are:
- Arkema S.A
- Axens S.A
- BASF SE
- Cabot Corporation
- Clariant AG
- Calgon Carbon Corporation
- Graver Technologies
- W.R. Grace & Company
- Sorbead India
- Adsorbents Carbons and others
Acquisitions/Technology Launches
• In October 2022, Clariant acquired BASF's U.S. Attapulgite business assets for $60 million. This deal strengthened Clariant's position in the growing markets for purification of edible oils and renewable fuels, expanding its footprint in North America.
• In September 2022, Honeywell International Inc. acquired Performance Materials and Technologies (PMT) from Solenis LLC for $5.3 billion. This acquisition included PMT's activated carbon business, which provided Honeywell with a broader portfolio of adsorbents and strengthened its presence in the water treatment and industrial gas purification markets.
For more Chemicals and Materials Market reports, please click here
1. North America Adsorbent Market - Market Overview
1.1 Definitions and Scope
2. North America Adsorbent Market - Executive Summary
2.1 Key Trends by Type
2.2 Key Trends by Form
2.3 Key Trends by End-use Industry
2.4 Key Trends by Country
3. North America Adsorbent Market – Comparative analysis
3.1 Market Share Analysis - Major Companies
3.2 Product Benchmarking - Major Companies
3.3 Top 5 Financials Analysis
3.4 Patent Analysis - Major Companies
3.5 Pricing Analysis (ASPs will be provided)
4. North America Adsorbent Market - Startup companies Scenario Premium Premium Premium
4.1 Major startup company analysis:
4.1.1 Investment
4.1.2 Revenue
4.1.3 Product portfolio
4.1.4 Venture Capital and Funding Scenario
5. North America Adsorbent Market – Industry Market Entry Scenario Premium Premium Premium
5.1 Regulatory Framework Overview
5.2 New Business and Ease of Doing Business Index
5.3 Successful Venture Profiles
5.4 Customer Analysis – Major companies
6. North America Adsorbent Market - Market Forces
6.1 Market Drivers
6.2 Market Constraints
6.3 Porter Five Force Model
6.3.1 Bargaining Power of Suppliers
6.3.2 Bargaining Powers of Buyers
6.3.3 Threat of New Entrants
6.3.4 Competitive Rivalry
6.3.5 Threat of Substitutes
7. North America Adsorbent Market – Strategic Analysis
7.1 Value/Supply Chain Analysis
7.2 Opportunity Analysis
7.3 Product/Market Life Cycle
7.4 Distributor Analysis – Major Companies
8. North America Adsorbent Market – by Type (Market Size - US$ Million/Billion)
8.1 Activated Alumina
8.2 Activated Carbon
8.3 Activated Clay
8.4 Silica Gel
8.5 Metal Oxides
8.6 Polymer Adsorbents
8.7 Zeolites (Molecular Sieves)
8.7.1 Type 3A
8.7.2 Others
8.8 Others
9. North America Adsorbent Market – by Form (Market Size - US$ Million/Billion)
9.1 Powder
9.2 Flakes
9.3 Others
10. North America Adsorbent Market - by End-use Industry (Market Size - US$ Million/Billion)
10.1 Oil and Gas Industry
10.1.1 Natural Gas Purification
10.1.2 Gasoline, Diesel and Jet Fuel Production
10.1.3 Others
10.2 Petrochemical Industry
10.2.1 Ethylene Production
10.2.2 Propylene Production
10.2.3 Xylene Separation
10.2.4 Others
10.3 Chemical Industry
10.3.1 Industrial Gases
10.3.1.1 Hydrogen Purification
10.3.1.2 Air Purification
10.3.1.3 Carbon Purification
10.3.1.4 Cryogenic Air Separation
10.3.1.5 Medical & Industrial Oxygen Concentrator
10.3.1.6 Others
10.3.2 CASE (Coatings, Sealants, Adhesives and Elastomers)
10.3.3 Others
10.4 Automotive and Transportation
10.5 Pharmaceutical and Food
10.6 Water Treatment
10.7 Nuclear Waste Remediation
10.8 Refrigerant
10.8.1 Commercial
10.8.2 Industrial
10.9 Building & Construction
10.10 Personal Care and Cosmetic
10.11 Others
11. North America Adsorbent Market - by Country (Market Size - US$ Million/Billion)
11.1 the USA
11.2 Canada
11.3 Mexico
12. North America Adsorbent Market – Entropy
12.1 New Product Launches
12.2 M&As, Collaborations, JVs and Partnerships
13. North America Adsorbent Market – Industry/Segment Competition Landscape Premium
13.1 Company Benchmarking Matrix – Major Companies
13.2 Market Share at Regional Level - Major companies
13.3 Market Share by Country - Major companies
13.4 Market Share by Key Product Type/Product category - Major companies
14. North America Adsorbent Market – Key Company List by Country Premium Premium Premium
15. North America Adsorbent Market Company Analysis - Business Overview, Product Portfolio, Financials and Developments
15.1. Arkema S.A
15.2. Axens S.A
15.3. BASF SE
15.4. Cabot Corporation
15.5. Clariant AG
15.6. Calgon Carbon Corporation
15.7. Graver Technologies
15.8. W.R. Grace & Company
15.9. Sorbead India
15.10 .Adsorbents Carbons and others
16. North America Adsorbent Market - Acquisitions/Technology Launches
* "Financials would be provided to private companies on best-efforts basis."
Connect with our experts to get customized reports that best suit your requirements. Our reports include global-level data, niche markets and competitive landscape.
List of Tables:
Table 1: North America Adsorbent Market Overview 2021-2026
Table 2: North America Adsorbent Market Leader Analysis 2018-2019 (US$)
Table 3: North America Adsorbent Market Product Analysis 2018-2019 (US$)
Table 4: North America Adsorbent Market End User Analysis 2018-2019 (US$)
Table 5: North America Adsorbent Market Patent Analysis 2013-2018* (US$)
Table 6: North America Adsorbent Market Financial Analysis 2018-2019 (US$)
Table 7: North America Adsorbent Market Driver Analysis 2018-2019 (US$)
Table 8: North America Adsorbent Market Challenges Analysis 2018-2019 (US$)
Table 9: North America Adsorbent Market Constraint Analysis 2018-2019 (US$)
Table 10: North America Adsorbent Market Supplier Bargaining Power Analysis 2018-2019 (US$)
Table 11: North America Adsorbent Market Buyer Bargaining Power Analysis 2018-2019 (US$)
Table 12: North America Adsorbent Market Threat of Substitutes Analysis 2018-2019 (US$)
Table 13: North America Adsorbent Market Threat of New Entrants Analysis 2018-2019 (US$)
Table 14: North America Adsorbent Market Degree of Competition Analysis 2018-2019 (US$)
Table 15: North America Adsorbent Market Value Chain Analysis 2018-2019 (US$)
Table 16: North America Adsorbent Market Pricing Analysis 2021-2026 (US$)
Table 17: North America Adsorbent Market Opportunities Analysis 2021-2026 (US$)
Table 18: North America Adsorbent Market Product Life Cycle Analysis 2021-2026 (US$)
Table 19: North America Adsorbent Market Supplier Analysis 2018-2019 (US$)
Table 20: North America Adsorbent Market Distributor Analysis 2018-2019 (US$)
Table 21: North America Adsorbent Market Trend Analysis 2018-2019 (US$)
Table 22: North America Adsorbent Market Size 2018 (US$)
Table 23: North America Adsorbent Market Forecast Analysis 2021-2026 (US$)
Table 24: North America Adsorbent Market Sales Forecast Analysis 2021-2026 (Units)
Table 25: North America Adsorbent Market, Revenue & Volume, By Application, 2021-2026 ($)
Table 26: North America Adsorbent Market By Application, Revenue & Volume, By Refrigeration, 2021-2026 ($)
Table 27: North America Adsorbent Market By Application, Revenue & Volume, By Air Conditioning, 2021-2026 ($)
Table 28: North America Adsorbent Market By Application, Revenue & Volume, By Automotive, 2021-2026 ($)
Table 29: North America Adsorbent Market By Application, Revenue & Volume, By Pharmaceutical, 2021-2026 ($)
Table 30: North America North America Adsorbent Market, Revenue & Volume, By Application, 2021-2026 ($)
Table 31: South america North America Adsorbent Market, Revenue & Volume, By Application, 2021-2026 ($)
Table 32: Europe North America Adsorbent Market, Revenue & Volume, By Application, 2021-2026 ($)
Table 33: APAC North America Adsorbent Market, Revenue & Volume, By Application, 2021-2026 ($)
Table 34: Middle East & Africa North America Adsorbent Market, Revenue & Volume, By Application, 2021-2026 ($)
Table 35: Russia North America Adsorbent Market, Revenue & Volume, By Application, 2021-2026 ($)
Table 36: Israel North America Adsorbent Market, Revenue & Volume, By Application, 2021-2026 ($)
Table 37: Top Companies 2018 (US$) North America Adsorbent Market, Revenue & Volume
Table 38: Product Launch 2018-2019 North America Adsorbent Market, Revenue & Volume
Table 39: Mergers & Acquistions 2018-2019 North America Adsorbent Market, Revenue & Volume
List of Figures:
Figure 1: Overview of North America Adsorbent Market 2021-2026
Figure 2: Market Share Analysis for North America Adsorbent Market 2018 (US$)
Figure 3: Product Comparison in North America Adsorbent Market 2018-2019 (US$)
Figure 4: End User Profile for North America Adsorbent Market 2018-2019 (US$)
Figure 5: Patent Application and Grant in North America Adsorbent Market 2013-2018* (US$)
Figure 6: Top 5 Companies Financial Analysis in North America Adsorbent Market 2018-2019 (US$)
Figure 7: Market Entry Strategy in North America Adsorbent Market 2018-2019
Figure 8: Ecosystem Analysis in North America Adsorbent Market 2018
Figure 9: Average Selling Price in North America Adsorbent Market 2021-2026
Figure 10: Top Opportunites in North America Adsorbent Market 2018-2019
Figure 11: Market Life Cycle Analysis in North America Adsorbent Market
Figure 12: GlobalBy Application North America Adsorbent Market Revenue, 2021-2026 ($)
Figure 13: Global North America Adsorbent Market - By Geography
Figure 14: Global North America Adsorbent Market Value & Volume, By Geography, 2021-2026 ($)
Figure 15: Global North America Adsorbent Market CAGR, By Geography, 2021-2026 (%)
Figure 16: North America North America Adsorbent Market Value & Volume, 2021-2026 ($)
Figure 17: US North America Adsorbent Market Value & Volume, 2021-2026 ($)
Figure 18: US GDP and Population, 2018-2019 ($)
Figure 19: US GDP – Composition of 2018, By Sector of Origin
Figure 20: US Export and Import Value & Volume, 2018-2019 ($)
Figure 21: Canada North America Adsorbent Market Value & Volume, 2021-2026 ($)
Figure 22: Canada GDP and Population, 2018-2019 ($)
Figure 23: Canada GDP – Composition of 2018, By Sector of Origin
Figure 24: Canada Export and Import Value & Volume, 2018-2019 ($)
Figure 25: Mexico North America Adsorbent Market Value & Volume, 2021-2026 ($)
Figure 26: Mexico GDP and Population, 2018-2019 ($)
Figure 27: Mexico GDP – Composition of 2018, By Sector of Origin
Figure 28: Mexico Export and Import Value & Volume, 2018-2019 ($)
Figure 29: South America North America Adsorbent Market Value & Volume, 2021-2026 ($)
Figure 30: Brazil North America Adsorbent Market Value & Volume, 2021-2026 ($)
Figure 31: Brazil GDP and Population, 2018-2019 ($)
Figure 32: Brazil GDP – Composition of 2018, By Sector of Origin
Figure 33: Brazil Export and Import Value & Volume, 2018-2019 ($)
Figure 34: Venezuela North America Adsorbent Market Value & Volume, 2021-2026 ($)
Figure 35: Venezuela GDP and Population, 2018-2019 ($)
Figure 36: Venezuela GDP – Composition of 2018, By Sector of Origin
Figure 37: Venezuela Export and Import Value & Volume, 2018-2019 ($)
Figure 38: Argentina North America Adsorbent Market Value & Volume, 2021-2026 ($)
Figure 39: Argentina GDP and Population, 2018-2019 ($)
Figure 40: Argentina GDP – Composition of 2018, By Sector of Origin
Figure 41: Argentina Export and Import Value & Volume, 2018-2019 ($)
Figure 42: Ecuador North America Adsorbent Market Value & Volume, 2021-2026 ($)
Figure 43: Ecuador GDP and Population, 2018-2019 ($)
Figure 44: Ecuador GDP – Composition of 2018, By Sector of Origin
Figure 45: Ecuador Export and Import Value & Volume, 2018-2019 ($)
Figure 46: Peru North America Adsorbent Market Value & Volume, 2021-2026 ($)
Figure 47: Peru GDP and Population, 2018-2019 ($)
Figure 48: Peru GDP – Composition of 2018, By Sector of Origin
Figure 49: Peru Export and Import Value & Volume, 2018-2019 ($)
Figure 50: Colombia North America Adsorbent Market Value & Volume, 2021-2026 ($)
Figure 51: Colombia GDP and Population, 2018-2019 ($)
Figure 52: Colombia GDP – Composition of 2018, By Sector of Origin
Figure 53: Colombia Export and Import Value & Volume, 2018-2019 ($)
Figure 54: Costa Rica North America Adsorbent Market Value & Volume, 2021-2026 ($)
Figure 55: Costa Rica GDP and Population, 2018-2019 ($)
Figure 56: Costa Rica GDP – Composition of 2018, By Sector of Origin
Figure 57: Costa Rica Export and Import Value & Volume, 2018-2019 ($)
Figure 58: Europe North America Adsorbent Market Value & Volume, 2021-2026 ($)
Figure 59: U.K North America Adsorbent Market Value & Volume, 2021-2026 ($)
Figure 60: U.K GDP and Population, 2018-2019 ($)
Figure 61: U.K GDP – Composition of 2018, By Sector of Origin
Figure 62: U.K Export and Import Value & Volume, 2018-2019 ($)
Figure 63: Germany North America Adsorbent Market Value & Volume, 2021-2026 ($)
Figure 64: Germany GDP and Population, 2018-2019 ($)
Figure 65: Germany GDP – Composition of 2018, By Sector of Origin
Figure 66: Germany Export and Import Value & Volume, 2018-2019 ($)
Figure 67: Italy North America Adsorbent Market Value & Volume, 2021-2026 ($)
Figure 68: Italy GDP and Population, 2018-2019 ($)
Figure 69: Italy GDP – Composition of 2018, By Sector of Origin
Figure 70: Italy Export and Import Value & Volume, 2018-2019 ($)
Figure 71: France North America Adsorbent Market Value & Volume, 2021-2026 ($)
Figure 72: France GDP and Population, 2018-2019 ($)
Figure 73: France GDP – Composition of 2018, By Sector of Origin
Figure 74: France Export and Import Value & Volume, 2018-2019 ($)
Figure 75: Netherlands North America Adsorbent Market Value & Volume, 2021-2026 ($)
Figure 76: Netherlands GDP and Population, 2018-2019 ($)
Figure 77: Netherlands GDP – Composition of 2018, By Sector of Origin
Figure 78: Netherlands Export and Import Value & Volume, 2018-2019 ($)
Figure 79: Belgium North America Adsorbent Market Value & Volume, 2021-2026 ($)
Figure 80: Belgium GDP and Population, 2018-2019 ($)
Figure 81: Belgium GDP – Composition of 2018, By Sector of Origin
Figure 82: Belgium Export and Import Value & Volume, 2018-2019 ($)
Figure 83: Spain North America Adsorbent Market Value & Volume, 2021-2026 ($)
Figure 84: Spain GDP and Population, 2018-2019 ($)
Figure 85: Spain GDP – Composition of 2018, By Sector of Origin
Figure 86: Spain Export and Import Value & Volume, 2018-2019 ($)
Figure 87: Denmark North America Adsorbent Market Value & Volume, 2021-2026 ($)
Figure 88: Denmark GDP and Population, 2018-2019 ($)
Figure 89: Denmark GDP – Composition of 2018, By Sector of Origin
Figure 90: Denmark Export and Import Value & Volume, 2018-2019 ($)
Figure 91: APAC North America Adsorbent Market Value & Volume, 2021-2026 ($)
Figure 92: China North America Adsorbent Market Value & Volume, 2021-2026
Figure 93: China GDP and Population, 2018-2019 ($)
Figure 94: China GDP – Composition of 2018, By Sector of Origin
Figure 95: China Export and Import Value & Volume, 2018-2019 ($) North America Adsorbent Market China Export and Import Value & Volume, 2018-2019 ($)
Figure 96: Australia North America Adsorbent Market Value & Volume, 2021-2026 ($)
Figure 97: Australia GDP and Population, 2018-2019 ($)
Figure 98: Australia GDP – Composition of 2018, By Sector of Origin
Figure 99: Australia Export and Import Value & Volume, 2018-2019 ($)
Figure 100: South Korea North America Adsorbent Market Value & Volume, 2021-2026 ($)
Figure 101: South Korea GDP and Population, 2018-2019 ($)
Figure 102: South Korea GDP – Composition of 2018, By Sector of Origin
Figure 103: South Korea Export and Import Value & Volume, 2018-2019 ($)
Figure 104: India North America Adsorbent Market Value & Volume, 2021-2026 ($)
Figure 105: India GDP and Population, 2018-2019 ($)
Figure 106: India GDP – Composition of 2018, By Sector of Origin
Figure 107: India Export and Import Value & Volume, 2018-2019 ($)
Figure 108: Taiwan North America Adsorbent Market Value & Volume, 2021-2026 ($)
Figure 109: Taiwan GDP and Population, 2018-2019 ($)
Figure 110: Taiwan GDP – Composition of 2018, By Sector of Origin
Figure 111: Taiwan Export and Import Value & Volume, 2018-2019 ($)
Figure 112: Malaysia North America Adsorbent Market Value & Volume, 2021-2026 ($)
Figure 113: Malaysia GDP and Population, 2018-2019 ($)
Figure 114: Malaysia GDP – Composition of 2018, By Sector of Origin
Figure 115: Malaysia Export and Import Value & Volume, 2018-2019 ($)
Figure 116: Hong Kong North America Adsorbent Market Value & Volume, 2021-2026 ($)
Figure 117: Hong Kong GDP and Population, 2018-2019 ($)
Figure 118: Hong Kong GDP – Composition of 2018, By Sector of Origin
Figure 119: Hong Kong Export and Import Value & Volume, 2018-2019 ($)
Figure 120: Middle East & Africa North America Adsorbent Market Middle East & Africa 3D Printing Market Value & Volume, 2021-2026 ($)
Figure 121: Russia North America Adsorbent Market Value & Volume, 2021-2026 ($)
Figure 122: Russia GDP and Population, 2018-2019 ($)
Figure 123: Russia GDP – Composition of 2018, By Sector of Origin
Figure 124: Russia Export and Import Value & Volume, 2018-2019 ($)
Figure 125: Israel North America Adsorbent Market Value & Volume, 2021-2026 ($)
Figure 126: Israel GDP and Population, 2018-2019 ($)
Figure 127: Israel GDP – Composition of 2018, By Sector of Origin
Figure 128: Israel Export and Import Value & Volume, 2018-2019 ($)
Figure 129: Entropy Share, By Strategies, 2018-2019* (%) North America Adsorbent Market
Figure 130: Developments, 2018-2019* North America Adsorbent Market
Figure 131: Company 1 North America Adsorbent Market Net Revenue, By Years, 2018-2019* ($)
Figure 132: Company 1 North America Adsorbent Market Net Revenue Share, By Business segments, 2018 (%)
Figure 133: Company 1 North America Adsorbent Market Net Sales Share, By Geography, 2018 (%)
Figure 134: Company 2 North America Adsorbent Market Net Revenue, By Years, 2018-2019* ($)
Figure 135: Company 2 North America Adsorbent Market Net Revenue Share, By Business segments, 2018 (%)
Figure 136: Company 2 North America Adsorbent Market Net Sales Share, By Geography, 2018 (%)
Figure 137: Company 3 North America Adsorbent Market Net Revenue, By Years, 2018-2019* ($)
Figure 138: Company 3 North America Adsorbent Market Net Revenue Share, By Business segments, 2018 (%)
Figure 139: Company 3 North America Adsorbent Market Net Sales Share, By Geography, 2018 (%)
Figure 140: Company 4 North America Adsorbent Market Net Revenue, By Years, 2018-2019* ($)
Figure 141: Company 4 North America Adsorbent Market Net Revenue Share, By Business segments, 2018 (%)
Figure 142: Company 4 North America Adsorbent Market Net Sales Share, By Geography, 2018 (%)
Figure 143: Company 5 North America Adsorbent Market Net Revenue, By Years, 2018-2019* ($)
Figure 144: Company 5 North America Adsorbent Market Net Revenue Share, By Business segments, 2018 (%)
Figure 145: Company 5 North America Adsorbent Market Net Sales Share, By Geography, 2018 (%)
Figure 146: Company 6 North America Adsorbent Market Net Revenue, By Years, 2018-2019* ($)
Figure 147: Company 6 North America Adsorbent Market Net Revenue Share, By Business segments, 2018 (%)
Figure 148: Company 6 North America Adsorbent Market Net Sales Share, By Geography, 2018 (%)
Figure 149: Company 7 North America Adsorbent Market Net Revenue, By Years, 2018-2019* ($)
Figure 150: Company 7 North America Adsorbent Market Net Revenue Share, By Business segments, 2018 (%)
Figure 151: Company 7 North America Adsorbent Market Net Sales Share, By Geography, 2018 (%)
Figure 152: Company 8 North America Adsorbent Market Net Revenue, By Years, 2018-2019* ($)
Figure 153: Company 8 North America Adsorbent Market Net Revenue Share, By Business segments, 2018 (%)
Figure 154: Company 8 North America Adsorbent Market Net Sales Share, By Geography, 2018 (%)
Figure 155: Company 9 North America Adsorbent Market Net Revenue, By Years, 2018-2019* ($)
Figure 156: Company 9 North America Adsorbent Market Net Revenue Share, By Business segments, 2018 (%)
Figure 157: Company 9 North America Adsorbent Market Net Sales Share, By Geography, 2018 (%)
Figure 158: Company 10 North America Adsorbent Market Net Revenue, By Years, 2018-2019* ($)
Figure 159: Company 10 North America Adsorbent Market Net Revenue Share, By Business segments, 2018 (%)
Figure 160: Company 10 North America Adsorbent Market Net Sales Share, By Geography, 2018 (%)
Figure 161: Company 11 North America Adsorbent Market Net Revenue, By Years, 2018-2019* ($)
Figure 162: Company 11 North America Adsorbent Market Net Revenue Share, By Business segments, 2018 (%)
Figure 163: Company 11 North America Adsorbent Market Net Sales Share, By Geography, 2018 (%)
Figure 164: Company 12 North America Adsorbent Market Net Revenue, By Years, 2018-2019* ($)
Figure 165: Company 12 North America Adsorbent Market Net Revenue Share, By Business segments, 2018 (%)
Figure 166: Company 12 North America Adsorbent Market Net Sales Share, By Geography, 2018 (%)
Figure 167: Company 13 North America Adsorbent Market Net Revenue, By Years, 2018-2019* ($)
Figure 168: Company 13 North America Adsorbent Market Net Revenue Share, By Business segments, 2018 (%)
Figure 169: Company 13 North America Adsorbent Market Net Sales Share, By Geography, 2018 (%)
Figure 170: Company 14 North America Adsorbent Market Net Revenue, By Years, 2018-2019* ($)
Figure 171: Company 14 North America Adsorbent Market Net Revenue Share, By Business segments, 2018 (%)
Figure 172: Company 14 North America Adsorbent Market Net Sales Share, By Geography, 2018 (%)
Figure 173: Company 15 North America Adsorbent Market Net Revenue, By Years, 2018-2019* ($)
Figure 174: Company 15 North America Adsorbent Market Net Revenue Share, By Business segments, 2018 (%)
Figure 175: Company 15 North America Adsorbent Market Net Sales Share, By Geography, 2018 (%)