 Email
Email Print
Print


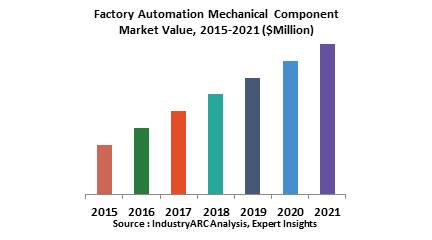
Factory Automation Mechanical Component Market - Forecast(2024 - 2030)
The Global Factory Automation Mechanical Components market is valued at $ 495.3 billion in 2017 and is expected to grow with a CAGR of 5.08% during the forecast period 2017 -2023. Mechanical components are the building blocks of factory automation equipment and processes, many of these components are interdependent and form a solution for any process automation in production, assembly lines, warehousing and others. Some of the key products are Linear Shafts, Shaft Collar, Tubes, Screws, Nuts, Washers, Bushings, Cable Glands, Lens, Bearing Units, General Motors, Valves, Actuators, Adaptors, Solenoid Valves, Cylinders, and many others
What is Factory Automation Mechanical Components?
Mechanical Components are an indivisible module in a factory and industrial automation which are fabricated in a particular continuous order to execute a required function. These components are varied in size and design depend upon the function it performs.
What are the major applications of Factory Automation Mechanical Components?
Sensors are most significant contact or non-contact mechanical devices which provides information on absence, presence and strength of measured occurrences. These sensors plays vital role in HMI (Human Machine Interface), a software application which allows human to interact with manufacturing execution system. Controllers vary from the simple processor from complex controllers with multicore which analyses visualization, motion, safety, measurement functions, and logic of an automated system. It is predicted that, in small and medium enterprises this machine automation would make the production 30% faster and 25 % efficient. These efficiency of these machine automation can be measured and reported by linking it in to an ERP (Enterprise Resource Planning) system.
Market Research and Market Trends of Factory Automation Mechanical Components
- Innovation & Development: Sensor-enabled rollers and belts which is capable to measure the quantitative metrics of an object, becomes contemporary material in the production planning. This sensor enabled rollers can weigh the products or collects other quantitative measures from the object as the pass on the belts, which in turn helps to minimize the errors and improves the consistency and quality of the output.
- Mergers & Acquisitions: B&R, one of the predominant player in providing product and Technical based solution in industrial automation has been acquired by ABB, the market leader in the factory and industrial automation. This acquisition will provide global opportunities and expertise in large-scale technical and functional knowledge. It is expected that the sales target of B&R would reach more than $1billion in next fiscal year due to ABB’s commitment in B&R’s operational expansion, investment in R&D and other strategies to promote the business model of the company.
- Investments Strategies: Recently, a largest organic investment was made by ABB, an industrial market leader in industrial automation, in Austria. This investment was around 100 million Euro to develop factory automation for future and to create 1000 new jobs. This investment is to build an innovation and training centers by the end of 2020. It is estimated that the company has decided to invest $1.4 billion every year for R&D purposes.
Who are the Major Players in market?
The key players operating in the Factory Automation Mechanical Components Market are 3M., ABB Ltd., Schneider Electric., Rockwell Automation., General Electric., Honeywell International., Mitsubishi Electric Corp., and other 10 more companies.
What is our report scope?
The report incorporates in-depth assessment of the competitive landscape, product market sizing, product benchmarking, market trends, product developments, financial analysis, strategic analysis and so on to gauge the impact forces and potential opportunities of the market. Apart from this the report also includes a study of major developments in the market such as product launches, agreements, acquisitions, collaborations, mergers and so on to comprehend the prevailing market dynamics at present and its impact during the forecast period 2017-2023.
All our reports are customizable to your company needs to a certain extent, we do provide 20 free consulting hours along with purchase of each report, and this will allow you to request any additional data to customize the report to your needs.
Key Takeaways from this Report
- Evaluate market potential through analyzing growth rates (CAGR %), Volume (Units) and Value ($M) data given at country level – for product types, end use applications and by different industry verticals.
- Understand the different dynamics influencing the market – key driving factors, challenges and hidden opportunities.
- Get in-depth insights on your competitor performance – market shares, strategies, financial benchmarking, product benchmarking, SWOT and more.
- Analyze the sales and distribution channels across key geographies to improve top-line revenues.
- Understand the industry supply chain with a deep-dive on the value augmentation at each step, in order to optimize value and bring efficiencies in your processes.
- Get a quick outlook on the market entropy – M&A’s, deals, partnerships, product launches of all key players for the past 4 years.
- Evaluate the supply-demand gaps, import-export statistics and regulatory landscape for more than top 20 countries globally for the market.
1. Factory Automation Mechanical Component Market - Overview
1.1. Definitions and Scope
2. Factory Automation Mechanical Component Market - Executive summary
2.1. Market Revenue, Market Size and Key Trends by Company
2.2. Key Trends by type of Application
2.3. Key Trends segmented by Geography
3. Factory Automation Mechanical Component Market
3.1. Comparative analysis
3.1.1. Product Benchmarking - Top 10 companies
3.1.2. Top 5 Financials Analysis
3.1.3. Market Value split by Top 10 companies
3.1.4. Patent Analysis - Top 10 companies
3.1.5. Pricing Analysis
4. Factory Automation Mechanical Component Market – Startup companies Scenario Premium
4.1. Top 10 startup company Analysis by
4.1.1. Investment
4.1.2. Revenue
4.1.3. Market Shares
4.1.4. Market Size and Application Analysis
4.1.5. Venture Capital and Funding Scenario
5. Factory Automation Mechanical Component Market – Industry Market Entry Scenario Premium
5.1. Regulatory Framework Overview
5.2. New Business and Ease of Doing business index
5.3. Case studies of successful ventures
5.4. Customer Analysis – Top 10 companies
6. Factory Automation Mechanical Component Market Forces
6.1. Drivers
6.2. Constraints
6.3. Challenges
6.4. Porters five force model
6.4.1. Bargaining power of suppliers
6.4.2. Bargaining powers of customers
6.4.3. Threat of new entrants
6.4.4. Rivalry among existing players
6.4.5. Threat of substitutes
7. Factory Automation Mechanical Component Market -Strategic analysis
7.1. Value chain analysis
7.2. Opportunities analysis
7.3. Product life cycle
7.4. Suppliers and distributors Market Share
8. Factory Automation Mechanical Component Market – By Mechanical Components (Market Size -$Million / $Billion)
8.1. Market Size and Market Share Analysis
8.2. Application Revenue and Trend Research
8.3. Product Segment Analysis
8.3.1. Linear Shafts
8.3.2. Shafts Support
8.3.3. Bushings
8.3.4. Washers
8.3.5. Screws
8.3.6. Stages
8.3.7. Sensors
8.3.8. Switches
8.3.9. Followers
8.3.10. Motors
8.3.11. Belts
8.3.12. Rollers
8.3.13. Others (Nozzles, Couplers, Valves, Pipes)
9. Factory Automation Mechanical Component Market – By Application (Market Size -$Million / $Billion)
9.1. Packaging & Material Handling
9.2. Quality Control and Inspection
9.3. Metal Fabrication
9.4. Planning and Decision Making
9.5. Numerical Control
10. Factory Automation Mechanical Component – By End Use Industry(Market Size -$Million / $Billion)
10.1. Segment type Size and Market Share Analysis
10.2. Application Revenue and Trends by type of Application
10.3. Application Segment Analysis by Type
10.3.1. Automotive
10.3.2. Chemical
10.3.3. Oil & Gas
10.3.4. Pharmaceutical
10.3.5. Food & Beverages
10.3.6. Paper & Pulp
10.3.7. Packaging
10.3.8. Construction
10.3.9. Power & Energy
10.3.10. Material Handling
11. Factory Automation Mechanical Component - By Geography (Market Size -$Million / $Billion)
11.1. Factory Automation Mechanical Component Market - North America Segment Research
11.2. North America Market Research (Million / $Billion)
11.2.1. Segment type Size and Market Size Analysis
11.2.2. Revenue and Trends
11.2.3. Application Revenue and Trends by type of Application
11.2.4. Company Revenue and Product Analysis
11.2.5. North America Product type and Application Market Size
11.2.5.1. U.S.
11.2.5.2. Canada
11.2.5.3. Mexico
11.2.5.4. Rest of North America
11.3. Factory Automation Mechanical Component - South America Segment Research
11.4. South America Market Research (Market Size -$Million / $Billion)
11.4.1. Segment type Size and Market Size Analysis
11.4.2. Revenue and Trends
11.4.3. Application Revenue and Trends by type of Application
11.4.4. Company Revenue and Product Analysis
11.4.5. South America Product type and Application Market Size
11.4.5.1. Brazil
11.4.5.2. Venezuela
11.4.5.3. Argentina
11.4.5.4. Ecuador
11.4.5.5. Peru
11.4.5.6. Colombia
11.4.5.7. Costa Rica
11.4.5.8. Rest of South America
11.5. Factory Automation Mechanical Component - Europe Segment Research
11.6. Europe Market Research (Market Size -$Million / $Billion)
11.6.1. Segment type Size and Market Size Analysis
11.6.2. Revenue and Trends
11.6.3. Application Revenue and Trends by type of Application
11.6.4. Company Revenue and Product Analysis
11.6.5. Europe Segment Product type and Application Market Size
11.6.5.1. U.K
11.6.5.2. Germany
11.6.5.3. Italy
11.6.5.4. France
11.6.5.5. Netherlands
11.6.5.6. Belgium
11.6.5.7. Spain
11.6.5.8. Denmark
11.6.5.9. Rest of Europe
11.7. Factory Automation Mechanical Component – APAC Segment Research
11.8. APAC Market Research (Market Size -$Million / $Billion)
11.8.1. Segment type Size and Market Size Analysis
11.8.2. Revenue and Trends
11.8.3. Application Revenue and Trends by type of Application
11.8.4. Company Revenue and Product Analysis
11.8.5. APAC Segment – Product type and Application Market Size
11.8.5.1. China
11.8.5.2. Australia
11.8.5.3. Japan
11.8.5.4. South Korea
11.8.5.5. India
11.8.5.6. Taiwan
11.8.5.7. Malaysia
12. Factory Automation Mechanical Component Market - Entropy
12.1. New product launches
12.2. M&A's, collaborations, JVs and partnerships
13. Factory Automation Mechanical Component Market – Industry / Segment Competition landscape Premium
13.1. Market Share Analysis
13.1.1. Market Share by Country- Top companies
13.1.2. Market Share by Region- Top 10 companies
13.1.3. Market Share by type of Application – Top 10 companies
13.1.4. Market Share by type of Product / Product category- Top 10 companies
13.1.5. Market Share at global level- Top 10 companies
13.1.6. Best Practises for companies
14. Factory Automation Mechanical Component Market – Key Company List by Country Premium
15. Factory Automation Mechanical Component Market Company Analysis
15.1. Market Share, Company Revenue, Products, M&A, Developments
15.2. 3M
15.3. ABB Ltd
15.4. Schneider Electric
15.5. Rockwell Automation
15.6. General Electric
15.7. Honeywell International
15.8. Mitsubishi Electric Corp
15.9. Company 8
15.10. Company 9
15.11. Company 10
15.12. Company 11
15.13. Company 12
15.14. Company 13
15.15. Company 14 and more
"*Financials would be provided on a best efforts basis for private companies"
16. Factory Automation Mechanical Component Market -Appendix
16.1. Abbreviations
16.2. Sources
17. Factory Automation Mechanical Component Market -Methodology Premium
17.1. Research Methodology
17.1.1. Company Expert Interviews
17.1.2. Industry Databases
17.1.3. Associations
17.1.4. Company News
17.1.5. Company Annual Reports
17.1.6. Application Trends
17.1.7. New Products and Product database
17.1.8. Company Transcripts
17.1.9. R&D Trends
17.1.10. Key Opinion Leaders Interviews
17.1.11. Supply and Demand Trends
List of Tables
Table 1 Factory Automation Mechanical Component Market Overview 2021-2026
Table 2 Factory Automation Mechanical Component Market Leader Analysis 2018-2019 (US$)
Table 3 Factory Automation Mechanical Component Market Product Analysis 2018-2019 (US$)
Table 4 Factory Automation Mechanical Component Market End User Analysis 2018-2019 (US$)
Table 5 Factory Automation Mechanical Component Market Patent Analysis 2013-2018* (US$)
Table 6 Factory Automation Mechanical Component Market Financial Analysis 2018-2019 (US$)
Table 7 Factory Automation Mechanical Component Market Driver Analysis 2018-2019 (US$)
Table 8 Factory Automation Mechanical Component Market Challenges Analysis 2018-2019 (US$)
Table 9 Factory Automation Mechanical Component Market Constraint Analysis 2018-2019 (US$)
Table 10 Factory Automation Mechanical Component Market Supplier Bargaining Power Analysis 2018-2019 (US$)
Table 11 Factory Automation Mechanical Component Market Buyer Bargaining Power Analysis 2018-2019 (US$)
Table 12 Factory Automation Mechanical Component Market Threat of Substitutes Analysis 2018-2019 (US$)
Table 13 Factory Automation Mechanical Component Market Threat of New Entrants Analysis 2018-2019 (US$)
Table 14 Factory Automation Mechanical Component Market Degree of Competition Analysis 2018-2019 (US$)
Table 15 Factory Automation Mechanical Component Market Value Chain Analysis 2018-2019 (US$)
Table 16 Factory Automation Mechanical Component Market Pricing Analysis 2021-2026 (US$)
Table 17 Factory Automation Mechanical Component Market Opportunities Analysis 2021-2026 (US$)
Table 18 Factory Automation Mechanical Component Market Product Life Cycle Analysis 2021-2026 (US$)
Table 19 Factory Automation Mechanical Component Market Supplier Analysis 2018-2019 (US$)
Table 20 Factory Automation Mechanical Component Market Distributor Analysis 2018-2019 (US$)
Table 21 Factory Automation Mechanical Component Market Trend Analysis 2018-2019 (US$)
Table 22 Factory Automation Mechanical Component Market Size 2018 (US$)
Table 23 Factory Automation Mechanical Component Market Forecast Analysis 2021-2026 (US$)
Table 24 Factory Automation Mechanical Component Market Sales Forecast Analysis 2021-2026 (Units)
Table 25 Factory Automation Mechanical Component Market, Revenue & Volume,By Mechanical Components, 2021-2026 ($)
Table 26 Factory Automation Mechanical Component Market By Mechanical Components, Revenue & Volume,By Linear Shafts, 2021-2026 ($)
Table 27 Factory Automation Mechanical Component Market By Mechanical Components, Revenue & Volume,By Shaft Supports, 2021-2026 ($)
Table 28 Factory Automation Mechanical Component Market By Mechanical Components, Revenue & Volume,By Shaft Collar, 2021-2026 ($)
Table 29 Factory Automation Mechanical Component Market By Mechanical Components, Revenue & Volume,By Linear Bushings, 2021-2026 ($)
Table 30 Factory Automation Mechanical Component Market By Mechanical Components, Revenue & Volume,By Oil Free Bushings, 2021-2026 ($)
Table 31 Factory Automation Mechanical Component Market, Revenue & Volume,By End Use, 2021-2026 ($)
Table 32 Factory Automation Mechanical Component Market By End Use, Revenue & Volume,By Automotive, 2021-2026 ($)
Table 33 Factory Automation Mechanical Component Market By End Use, Revenue & Volume,By Chemical, 2021-2026 ($)
Table 34 Factory Automation Mechanical Component Market By End Use, Revenue & Volume,By Oil and Gas, 2021-2026 ($)
Table 35 Factory Automation Mechanical Component Market By End Use, Revenue & Volume,By Pharmaceutical, 2021-2026 ($)
Table 36 Factory Automation Mechanical Component Market By End Use, Revenue & Volume,By Food and Beverage, 2021-2026 ($)
Table 37 North America Factory Automation Mechanical Component Market, Revenue & Volume,By Mechanical Components, 2021-2026 ($)
Table 38 North America Factory Automation Mechanical Component Market, Revenue & Volume,By End Use, 2021-2026 ($)
Table 39 South america Factory Automation Mechanical Component Market, Revenue & Volume,By Mechanical Components, 2021-2026 ($)
Table 40 South america Factory Automation Mechanical Component Market, Revenue & Volume,By End Use, 2021-2026 ($)
Table 41 Europe Factory Automation Mechanical Component Market, Revenue & Volume,By Mechanical Components, 2021-2026 ($)
Table 42 Europe Factory Automation Mechanical Component Market, Revenue & Volume,By End Use, 2021-2026 ($)
Table 43 APAC Factory Automation Mechanical Component Market, Revenue & Volume,By Mechanical Components, 2021-2026 ($)
Table 44 APAC Factory Automation Mechanical Component Market, Revenue & Volume,By End Use, 2021-2026 ($)
Table 45 Middle East & Africa Factory Automation Mechanical Component Market, Revenue & Volume,By Mechanical Components, 2021-2026 ($)
Table 46 Middle East & Africa Factory Automation Mechanical Component Market, Revenue & Volume,By End Use, 2021-2026 ($)
Table 47 Russia Factory Automation Mechanical Component Market, Revenue & Volume,By Mechanical Components, 2021-2026 ($)
Table 48 Russia Factory Automation Mechanical Component Market, Revenue & Volume,By End Use, 2021-2026 ($)
Table 49 Israel Factory Automation Mechanical Component Market, Revenue & Volume,By Mechanical Components, 2021-2026 ($)
Table 50 Israel Factory Automation Mechanical Component Market, Revenue & Volume,By End Use, 2021-2026 ($)
Table 51 Top Companies 2018 (US$)Factory Automation Mechanical Component Market, Revenue & Volume,
Table 52 Product Launch 2018-2019Factory Automation Mechanical Component Market, Revenue & Volume,
Table 53 Mergers & Acquistions 2018-2019Factory Automation Mechanical Component Market, Revenue & Volume,
List of Figures
Figure 1 Overview of Factory Automation Mechanical Component Market 2021-2026
Figure 2 Market Share Analysis for Factory Automation Mechanical Component Market 2018 (US$)
Figure 3 Product Comparison in Factory Automation Mechanical Component Market 2018-2019 (US$)
Figure 4 End User Profile for Factory Automation Mechanical Component Market 2018-2019 (US$)
Figure 5 Patent Application and Grant in Factory Automation Mechanical Component Market 2013-2018* (US$)
Figure 6 Top 5 Companies Financial Analysis in Factory Automation Mechanical Component Market 2018-2019 (US$)
Figure 7 Market Entry Strategy in Factory Automation Mechanical Component Market 2018-2019
Figure 8 Ecosystem Analysis in Factory Automation Mechanical Component Market 2018
Figure 9 Average Selling Price in Factory Automation Mechanical Component Market 2021-2026
Figure 10 Top Opportunites in Factory Automation Mechanical Component Market 2018-2019
Figure 11 Market Life Cycle Analysis in Factory Automation Mechanical Component Market
Figure 12 GlobalBy Mechanical ComponentsFactory Automation Mechanical Component Market Revenue, 2021-2026 ($)
Figure 13 GlobalBy End UseFactory Automation Mechanical Component Market Revenue, 2021-2026 ($)
Figure 14 Global Factory Automation Mechanical Component Market - By Geography
Figure 15 Global Factory Automation Mechanical Component Market Value & Volume, By Geography, 2021-2026 ($)
Figure 16 Global Factory Automation Mechanical Component Market CAGR, By Geography, 2021-2026 (%)
Figure 17 North America Factory Automation Mechanical Component Market Value & Volume, 2021-2026 ($)
Figure 18 US Factory Automation Mechanical Component Market Value & Volume, 2021-2026 ($)
Figure 19 US GDP and Population, 2018-2019 ($)
Figure 20 US GDP – Composition of 2018, By Sector of Origin
Figure 21 US Export and Import Value & Volume, 2018-2019 ($)
Figure 22 Canada Factory Automation Mechanical Component Market Value & Volume, 2021-2026 ($)
Figure 23 Canada GDP and Population, 2018-2019 ($)
Figure 24 Canada GDP – Composition of 2018, By Sector of Origin
Figure 25 Canada Export and Import Value & Volume, 2018-2019 ($)
Figure 26 Mexico Factory Automation Mechanical Component Market Value & Volume, 2021-2026 ($)
Figure 27 Mexico GDP and Population, 2018-2019 ($)
Figure 28 Mexico GDP – Composition of 2018, By Sector of Origin
Figure 29 Mexico Export and Import Value & Volume, 2018-2019 ($)
Figure 30 South America Factory Automation Mechanical Component Market Value & Volume, 2021-2026 ($)
Figure 31 Brazil Factory Automation Mechanical Component Market Value & Volume, 2021-2026 ($)
Figure 32 Brazil GDP and Population, 2018-2019 ($)
Figure 33 Brazil GDP – Composition of 2018, By Sector of Origin
Figure 34 Brazil Export and Import Value & Volume, 2018-2019 ($)
Figure 35 Venezuela Factory Automation Mechanical Component Market Value & Volume, 2021-2026 ($)
Figure 36 Venezuela GDP and Population, 2018-2019 ($)
Figure 37 Venezuela GDP – Composition of 2018, By Sector of Origin
Figure 38 Venezuela Export and Import Value & Volume, 2018-2019 ($)
Figure 39 Argentina Factory Automation Mechanical Component Market Value & Volume, 2021-2026 ($)
Figure 40 Argentina GDP and Population, 2018-2019 ($)
Figure 41 Argentina GDP – Composition of 2018, By Sector of Origin
Figure 42 Argentina Export and Import Value & Volume, 2018-2019 ($)
Figure 43 Ecuador Factory Automation Mechanical Component Market Value & Volume, 2021-2026 ($)
Figure 44 Ecuador GDP and Population, 2018-2019 ($)
Figure 45 Ecuador GDP – Composition of 2018, By Sector of Origin
Figure 46 Ecuador Export and Import Value & Volume, 2018-2019 ($)
Figure 47 Peru Factory Automation Mechanical Component Market Value & Volume, 2021-2026 ($)
Figure 48 Peru GDP and Population, 2018-2019 ($)
Figure 49 Peru GDP – Composition of 2018, By Sector of Origin
Figure 50 Peru Export and Import Value & Volume, 2018-2019 ($)
Figure 51 Colombia Factory Automation Mechanical Component Market Value & Volume, 2021-2026 ($)
Figure 52 Colombia GDP and Population, 2018-2019 ($)
Figure 53 Colombia GDP – Composition of 2018, By Sector of Origin
Figure 54 Colombia Export and Import Value & Volume, 2018-2019 ($)
Figure 55 Costa Rica Factory Automation Mechanical Component Market Value & Volume, 2021-2026 ($)
Figure 56 Costa Rica GDP and Population, 2018-2019 ($)
Figure 57 Costa Rica GDP – Composition of 2018, By Sector of Origin
Figure 58 Costa Rica Export and Import Value & Volume, 2018-2019 ($)
Figure 59 Europe Factory Automation Mechanical Component Market Value & Volume, 2021-2026 ($)
Figure 60 U.K Factory Automation Mechanical Component Market Value & Volume, 2021-2026 ($)
Figure 61 U.K GDP and Population, 2018-2019 ($)
Figure 62 U.K GDP – Composition of 2018, By Sector of Origin
Figure 63 U.K Export and Import Value & Volume, 2018-2019 ($)
Figure 64 Germany Factory Automation Mechanical Component Market Value & Volume, 2021-2026 ($)
Figure 65 Germany GDP and Population, 2018-2019 ($)
Figure 66 Germany GDP – Composition of 2018, By Sector of Origin
Figure 67 Germany Export and Import Value & Volume, 2018-2019 ($)
Figure 68 Italy Factory Automation Mechanical Component Market Value & Volume, 2021-2026 ($)
Figure 69 Italy GDP and Population, 2018-2019 ($)
Figure 70 Italy GDP – Composition of 2018, By Sector of Origin
Figure 71 Italy Export and Import Value & Volume, 2018-2019 ($)
Figure 72 France Factory Automation Mechanical Component Market Value & Volume, 2021-2026 ($)
Figure 73 France GDP and Population, 2018-2019 ($)
Figure 74 France GDP – Composition of 2018, By Sector of Origin
Figure 75 France Export and Import Value & Volume, 2018-2019 ($)
Figure 76 Netherlands Factory Automation Mechanical Component Market Value & Volume, 2021-2026 ($)
Figure 77 Netherlands GDP and Population, 2018-2019 ($)
Figure 78 Netherlands GDP – Composition of 2018, By Sector of Origin
Figure 79 Netherlands Export and Import Value & Volume, 2018-2019 ($)
Figure 80 Belgium Factory Automation Mechanical Component Market Value & Volume, 2021-2026 ($)
Figure 81 Belgium GDP and Population, 2018-2019 ($)
Figure 82 Belgium GDP – Composition of 2018, By Sector of Origin
Figure 83 Belgium Export and Import Value & Volume, 2018-2019 ($)
Figure 84 Spain Factory Automation Mechanical Component Market Value & Volume, 2021-2026 ($)
Figure 85 Spain GDP and Population, 2018-2019 ($)
Figure 86 Spain GDP – Composition of 2018, By Sector of Origin
Figure 87 Spain Export and Import Value & Volume, 2018-2019 ($)
Figure 88 Denmark Factory Automation Mechanical Component Market Value & Volume, 2021-2026 ($)
Figure 89 Denmark GDP and Population, 2018-2019 ($)
Figure 90 Denmark GDP – Composition of 2018, By Sector of Origin
Figure 91 Denmark Export and Import Value & Volume, 2018-2019 ($)
Figure 92 APAC Factory Automation Mechanical Component Market Value & Volume, 2021-2026 ($)
Figure 93 China Factory Automation Mechanical Component Market Value & Volume, 2021-2026
Figure 94 China GDP and Population, 2018-2019 ($)
Figure 95 China GDP – Composition of 2018, By Sector of Origin
Figure 96 China Export and Import Value & Volume, 2018-2019 ($)Factory Automation Mechanical Component Market China Export and Import Value & Volume, 2018-2019 ($)
Figure 97 Australia Factory Automation Mechanical Component Market Value & Volume, 2021-2026 ($)
Figure 98 Australia GDP and Population, 2018-2019 ($)
Figure 99 Australia GDP – Composition of 2018, By Sector of Origin
Figure 100 Australia Export and Import Value & Volume, 2018-2019 ($)
Figure 101 South Korea Factory Automation Mechanical Component Market Value & Volume, 2021-2026 ($)
Figure 102 South Korea GDP and Population, 2018-2019 ($)
Figure 103 South Korea GDP – Composition of 2018, By Sector of Origin
Figure 104 South Korea Export and Import Value & Volume, 2018-2019 ($)
Figure 105 India Factory Automation Mechanical Component Market Value & Volume, 2021-2026 ($)
Figure 106 India GDP and Population, 2018-2019 ($)
Figure 107 India GDP – Composition of 2018, By Sector of Origin
Figure 108 India Export and Import Value & Volume, 2018-2019 ($)
Figure 109 Taiwan Factory Automation Mechanical Component Market Value & Volume, 2021-2026 ($)
Figure 110 Taiwan GDP and Population, 2018-2019 ($)
Figure 111 Taiwan GDP – Composition of 2018, By Sector of Origin
Figure 112 Taiwan Export and Import Value & Volume, 2018-2019 ($)
Figure 113 Malaysia Factory Automation Mechanical Component Market Value & Volume, 2021-2026 ($)
Figure 114 Malaysia GDP and Population, 2018-2019 ($)
Figure 115 Malaysia GDP – Composition of 2018, By Sector of Origin
Figure 116 Malaysia Export and Import Value & Volume, 2018-2019 ($)
Figure 117 Hong Kong Factory Automation Mechanical Component Market Value & Volume, 2021-2026 ($)
Figure 118 Hong Kong GDP and Population, 2018-2019 ($)
Figure 119 Hong Kong GDP – Composition of 2018, By Sector of Origin
Figure 120 Hong Kong Export and Import Value & Volume, 2018-2019 ($)
Figure 121 Middle East & Africa Factory Automation Mechanical Component Market Middle East & Africa 3D Printing Market Value & Volume, 2021-2026 ($)
Figure 122 Russia Factory Automation Mechanical Component Market Value & Volume, 2021-2026 ($)
Figure 123 Russia GDP and Population, 2018-2019 ($)
Figure 124 Russia GDP – Composition of 2018, By Sector of Origin
Figure 125 Russia Export and Import Value & Volume, 2018-2019 ($)
Figure 126 Israel Factory Automation Mechanical Component Market Value & Volume, 2021-2026 ($)
Figure 127 Israel GDP and Population, 2018-2019 ($)
Figure 128 Israel GDP – Composition of 2018, By Sector of Origin
Figure 129 Israel Export and Import Value & Volume, 2018-2019 ($)
Figure 130 Entropy Share, By Strategies, 2018-2019* (%)Factory Automation Mechanical Component Market
Figure 131 Developments, 2018-2019*Factory Automation Mechanical Component Market
Figure 132 Company 1 Factory Automation Mechanical Component Market Net Revenue, By Years, 2018-2019* ($)
Figure 133 Company 1 Factory Automation Mechanical Component Market Net Revenue Share, By Business segments, 2018 (%)
Figure 134 Company 1 Factory Automation Mechanical Component Market Net Sales Share, By Geography, 2018 (%)
Figure 135 Company 2 Factory Automation Mechanical Component Market Net Revenue, By Years, 2018-2019* ($)
Figure 136 Company 2 Factory Automation Mechanical Component Market Net Revenue Share, By Business segments, 2018 (%)
Figure 137 Company 2 Factory Automation Mechanical Component Market Net Sales Share, By Geography, 2018 (%)
Figure 138 Company 3Factory Automation Mechanical Component Market Net Revenue, By Years, 2018-2019* ($)
Figure 139 Company 3Factory Automation Mechanical Component Market Net Revenue Share, By Business segments, 2018 (%)
Figure 140 Company 3Factory Automation Mechanical Component Market Net Sales Share, By Geography, 2018 (%)
Figure 141 Company 4 Factory Automation Mechanical Component Market Net Revenue, By Years, 2018-2019* ($)
Figure 142 Company 4 Factory Automation Mechanical Component Market Net Revenue Share, By Business segments, 2018 (%)
Figure 143 Company 4 Factory Automation Mechanical Component Market Net Sales Share, By Geography, 2018 (%)
Figure 144 Company 5 Factory Automation Mechanical Component Market Net Revenue, By Years, 2018-2019* ($)
Figure 145 Company 5 Factory Automation Mechanical Component Market Net Revenue Share, By Business segments, 2018 (%)
Figure 146 Company 5 Factory Automation Mechanical Component Market Net Sales Share, By Geography, 2018 (%)
Figure 147 Company 6 Factory Automation Mechanical Component Market Net Revenue, By Years, 2018-2019* ($)
Figure 148 Company 6 Factory Automation Mechanical Component Market Net Revenue Share, By Business segments, 2018 (%)
Figure 149 Company 6 Factory Automation Mechanical Component Market Net Sales Share, By Geography, 2018 (%)
Figure 150 Company 7 Factory Automation Mechanical Component Market Net Revenue, By Years, 2018-2019* ($)
Figure 151 Company 7 Factory Automation Mechanical Component Market Net Revenue Share, By Business segments, 2018 (%)
Figure 152 Company 7 Factory Automation Mechanical Component Market Net Sales Share, By Geography, 2018 (%)
Figure 153 Company 8 Factory Automation Mechanical Component Market Net Revenue, By Years, 2018-2019* ($)
Figure 154 Company 8 Factory Automation Mechanical Component Market Net Revenue Share, By Business segments, 2018 (%)
Figure 155 Company 8 Factory Automation Mechanical Component Market Net Sales Share, By Geography, 2018 (%)
Figure 156 Company 9 Factory Automation Mechanical Component Market Net Revenue, By Years, 2018-2019* ($)
Figure 157 Company 9 Factory Automation Mechanical Component Market Net Revenue Share, By Business segments, 2018 (%)
Figure 158 Company 9 Factory Automation Mechanical Component Market Net Sales Share, By Geography, 2018 (%)
Figure 159 Company 10 Factory Automation Mechanical Component Market Net Revenue, By Years, 2018-2019* ($)
Figure 160 Company 10 Factory Automation Mechanical Component Market Net Revenue Share, By Business segments, 2018 (%)
Figure 161 Company 10 Factory Automation Mechanical Component Market Net Sales Share, By Geography, 2018 (%)
Figure 162 Company 11 Factory Automation Mechanical Component Market Net Revenue, By Years, 2018-2019* ($)
Figure 163 Company 11 Factory Automation Mechanical Component Market Net Revenue Share, By Business segments, 2018 (%)
Figure 164 Company 11 Factory Automation Mechanical Component Market Net Sales Share, By Geography, 2018 (%)
Figure 165 Company 12 Factory Automation Mechanical Component Market Net Revenue, By Years, 2018-2019* ($)
Figure 166 Company 12 Factory Automation Mechanical Component Market Net Revenue Share, By Business segments, 2018 (%)
Figure 167 Company 12 Factory Automation Mechanical Component Market Net Sales Share, By Geography, 2018 (%)
Figure 168 Company 13Factory Automation Mechanical Component Market Net Revenue, By Years, 2018-2019* ($)
Figure 169 Company 13Factory Automation Mechanical Component Market Net Revenue Share, By Business segments, 2018 (%)
Figure 170 Company 13Factory Automation Mechanical Component Market Net Sales Share, By Geography, 2018 (%)
Figure 171 Company 14 Factory Automation Mechanical Component Market Net Revenue, By Years, 2018-2019* ($)
Figure 172 Company 14 Factory Automation Mechanical Component Market Net Revenue Share, By Business segments, 2018 (%)
Figure 173 Company 14 Factory Automation Mechanical Component Market Net Sales Share, By Geography, 2018 (%)
Figure 174 Company 15 Factory Automation Mechanical Component Market Net Revenue, By Years, 2018-2019* ($)
Figure 175 Company 15 Factory Automation Mechanical Component Market Net Revenue Share, By Business segments, 2018 (%)
Figure 176 Company 15 Factory Automation Mechanical Component Market Net Sales Share, By Geography, 2018 (%)