 Email
Email Print
Print


Rheology Modifiers Market Overview:
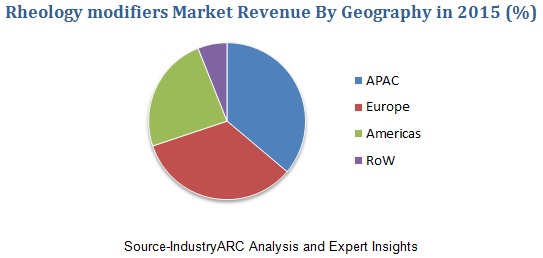
Rheological Modifier are an important part of the Additives sector across various industries. Due to the growing demand for Adhesives and Sealants and the application of rheology modifiers in the personal care industry its demand is expected to grow with a CAGR of 3.8%. The Rheology modifiers market was estimated to be worth around $2 billion in 2017. The Asia-Pacific region is the largest revenue earner in this market followed by Europe, America and then the rest of the world.
Rheology Modifiers Market Outlook:
Rheology modifiers, also known as thickeners or viscofiers are additives that are added to liquid and semi-solid products to control the viscosity and flow characteristics of the products. They are categorized based on the chemistry of the material used: Inorganic and Organic matter. Inorganic Rheology Modifier consist of Clays, Fumed silica and other specialty Clays. Organic Rheology modifiers consist of Cellulose, Guar Gum, Xanthan Gum, Synthetic polymer made of polyamides, polyurethanes, alkali acrylics and others. They are also categorized on the basis of the solution whether they are water based or some other solvent based. These additives are very important in various application such as creams, lotions and shampoos to maintain their flow and viscosity; in formulations to maintain the fluid structural integrity of the formulated chemicals for agrochemical industries and chemical industries, in adhesives, sealants, paints, inks and dyes to reduce splatter and dripping and to give a premium feel during application and after application. It is also used extensively in the Oil and gas industry during drilling and extraction of oil to control the characteristics of the mud when drilling at high angles and horizontal wells.
The pricing for Rheology Modifiers depends upon the type of modifiers used and can range anywhere from $1400 to $3500 per metric ton.
Rheology Modifiers Market Growth drivers:
The demand for personal care products is driven by the increase in population and increase in disposable incomes form emerging economies and developed economies. The demand for premium products in the personal care market is also a driver for the rheology market.
The rise in population and improving economic conditions in emerging economies has led to larger housing transaction and more disposable income which is driving the market for paints, adhesives and coatings in the construction industry which has a direct effect on the Rheology Modifiers Market.
Rheology Modifiers Market Challenges:
Major challenges in this market pertain to the technological capabilities and formulation capabilities of the different players in the market and how well they are able to service and provide to the demands of the customers while maintaining a competitive pricing level.
Rheology Modifiers Market Research Scope:
The base year of the study is 2017, with forecast done up to 2023. The study presents a thorough analysis of the competitive landscape, taking into account the market shares of the leading companies. It also provides information on unit shipments. These provide the key market participants with the necessary business intelligence and help them understand the future of the Rheology Modifiers Market. The assessment includes the forecast, an overview of the competitive structure, the market shares of the competitors, as well as the market trends, market demands, market drivers, market challenges, and product analysis. The market drivers and restraints have been assessed to fathom their impact over the forecast period. This report further identifies the key opportunities for growth while also detailing the key challenges and possible threats. The key areas of focus include the types of plastics in the electric vehicle market, and their specific applications in different types of vehicles.
Rheology Modifiers (SAP) Market Report: Industry Coverage
Rheology Modifiers Market– By Type: Inorganic and Organic; Clays: Bentonite Clay, Hectorite Clay, Organoclays; Fumed Silica; Specialty Clays: Attapulgite and others. Cellulosic, Gums: Guar Gum, Xanthan Gum, Diutan gum, Gellan gum and others. Synthetics: Associative Type: Hydrophobically Modified Polyurethanes (HEUR), Hydrophobically Modified Polyethers (HMPE), Hydrophbically Modified Alkali Swellabale Emulsions (HASE). Non-Associative Type: Alkali Swellable Emulsions (ASE) and Other Solvent based.
Rheology Modifiers Market– By Chemistry: Water based: Cellulosic, Acrylics (ASE, HASE), Associative (HEUR/HPME), Specialty clays. Solvent based: Organoclays, Hydrogenated Castor Oil, Polyamides, and Fumed Silica.
Rheology Modifiers Market– By Form: Liquid, Solids: Powder, Granules and others.
Rheology Modifiers Market– by Functions leveling Agent, Pour Point Depressants, Flow Promoters/ Thinners, Thickener/ Gelling Agents, Thixotropic Agents and others.
Rheology Modifiers Market– By Applications: Adhesives and Sealants, Cement and Concrete, Cleaners and Disinfectants, Coolants, Rubber products, Fermentation, Lubricants and greases and others.
Rheology Modifiers Market – By End User: Agricultural Industry, Paints and Coating Industry, Cosmetics and Personal Care, Construction Industry, Rubbers and Plastics Industry, Textiles Industry, Paper and Pulp Industry, Chemical Industry, Food and beverage Industry, Electronics Industry, Oil and gas Industry, Mining and Minerals Industry, Water treatment Industry and others.
The Rheology Modifiers Market report also analyzes the major geographic regions for the market as well as the major countries for the market in these regions. The regions and countries covered in the study include:
- North America: The U.S., Canada, Mexico
- South America: Brazil, Venezuela, Argentina, Ecuador, Peru, Colombia, Costa Rica
- Europe: The U.K., Germany, Italy, France, The Netherlands, Belgium, Spain, Denmark
- APAC: China, Japan, Australia, South Korea, India, Taiwan, Malaysia, Hong Kong
- Middle East and Africa: Israel, South Africa, Saudi Arabia
Rheology Modifiers Market Key Players Perspective:
Some of the Key players in this market that have been studied for this report include: Elementis specialty Chemicals, BASF, Altana, Arkema, Croda Chemicals, Brenntag, Munzing Chemie Gmbh, Ashland, Lubrizol, Dow and many more.
Market Research and Market Trends of Rheology Modifiers Market
- Key players BYK, a subsidiary of ALTANA, and Elementis Specialty Chemicals have invested in expanding their production facilities for rheological modifiers to ensure continuous supply for the growing demand in the Market from the Personal Care and hygiene, Construction, Coatings and Adhesives and other sectors.
- Another trend that is seen in the industry is the use of natural products as raw materials for application in various industries, especially the personal care industry. This has led to many companies coming up with new all natural products such as Elementis Specialty Chemical’s BENTONE GEL MSO V and BENTONE GEL ABO V which are based on Meadow Foam seed oil and Abbyssinian Seed Oil and find application in skin care, lip care, makeup and eye care.
- Coatex, a subsidiary of Arkema chemicals, has recently launched new rheology modifiers that are emulsifier free, for sensitive skin application in the personal care sector. Trade marked as Rheostyl, it also boast of excellent water resistance.
- With the Personal care and hygiene sectors growing with the growth in population, economic activities and the increase in disposable income many companies are investing in R&D activities related to making more premium personal care products which is resulting in increasing R&D activities for rheology modifiers in the personal care industry.
1. Rheology Modifiers Market - Overview
1.1. Definitions and Scope
2. Rheology Modifiers Market - Executive summary
2.1. Market Revenue, Market Size and Key Trends by Company
2.2. Key Trends by type of Application
2.3. Key Trends segmented by Geography
3. Rheology Modifiers Market
3.1. Comparative analysis
3.1.1. Product Benchmarking - Top 10 companies
3.1.2. Top 5 Financials Analysis
3.1.3. Market Value split by Top 10 companies
3.1.4. Patent Analysis - Top 10 companies
3.1.5. Pricing Analysis
4. Rheology Modifiers Market Forces
4.1. Drivers
4.2. Constraints
4.3. Challenges
4.4. Porters five force model
4.4.1. Bargaining power of suppliers
4.4.2. Bargaining powers of customers
4.4.3. Threat of new entrants
4.4.4. Rivalry among existing players
4.4.5. Threat of substitutes
5. Rheology Modifiers Market -Strategic analysis
5.1. Value chain analysis
5.2. Opportunities analysis
5.3. Product life cycle
6. Rheology Modifiers Market– By Type (Market Size -$Million / $Billion)
6.1. Segment type Size and Market Share Analysis
6.2. Application Revenue and Trends by type of Application
6.3. Application Segment Analysis by Type
6.3.1. Inorganic
6.3.1.1. Clays
6.3.1.1.1. Bentonite Clay
6.3.1.1.2. Hectorite Clay
6.3.1.1.3. Organoclays
6.3.1.2. Fumed Silica
6.3.1.3. Specialty Clays
6.3.1.3.1. Attapulgite
6.3.1.3.2. Others
6.3.2. Organic
6.3.2.1. Cellulosic
6.3.2.2. Gums
6.3.2.2.1. Guar Gum
6.3.2.2.2. Xanthan Gum
6.3.2.2.3. Diutan gum
6.3.2.2.4. Gellan gum
6.3.2.2.5. Others
6.3.2.3. Synthetics
6.3.2.3.1. Associative type
6.3.2.3.1.1. Hydrophobically Modified Polyurethanes (HEUR)
6.3.2.3.1.2. Hydrophobically Modified Polyethers (HMPE)
6.3.2.3.1.3. Hydrophbically Modified Alkali Swellabale Emulsions(HASE)
6.3.2.3.2. Non-Associative Type
6.3.2.3.2.1. Alkali Swellable Emulsions (ASE)
6.3.2.3.3. Other Solvent based
7. Rheology Modifiers Market– By Chemistry (Market Size -$Million / $Billion)
7.3.1. Water based
7.3.1.1. Cellulosics
7.3.1.2. Acrylics (ASE, HASE)
7.3.1.3. Associative (HEUR/HPME)
7.3.1.4. Specialty clays
7.3.2. Solvent based
7.3.2.1. Organoclays
7.3.2.2. Hydrogenated Castor Oil
7.3.2.3. Polyamides
7.3.2.4. Fumed Silica
8. Rheology Modifiers Market– By Form (Market Size -$Million / $Billion)
8.3.1. Liquid
8.3.2. Solids
8.3.2.1. Powder
8.3.2.2. Granules
8.3.2.3. Others
9. Rheology Modifiers Market– By Functions (Market Size -$Million / $Billion)
9.3.1. Leveling Agent
9.3.2. Pour Point Depressants
9.3.3. Flow Promoters/ Thinners
9.3.4. Thickener/ Gelling Agents
9.3.5. Thixotropic Agents
9.3.6. Others
10. Rheology Modifiers Market– By Applications (Market Size -$Million / $Billion)
10.3.1. Adhesives and Sealants
10.3.2. Cement and Concrete
10.3.3. Cleaners and Disinfectants
10.3.4. Coolants
10.3.5. Rubber products
10.3.6. Fermentation
10.3.7. Lubricants and greases
10.3.8. Others
11. Rheology Modifiers Market – By End User Industry (Market Size -$Million / $Billion)
11.1. Market Size and Market Share Analysis
11.2. Application Revenue and Trend Research
11.3. Product Segment Analysis
11.3.1. Agricultural Industry
11.3.2. Paints and Coating Industry
11.3.3. Cosmetics and Personal Care
11.3.4. Construction Industry
11.3.5. Rubbers and Plastics Industry
11.3.6. Textiles Industry
11.3.7. Paper and Pulp Industry
11.3.8. Chemical Industry
11.3.9. Food and beverage Industry
11.3.10. Electronics Industry
11.3.11. Oil and gas Industry
11.3.12. Mining and Minerals Industry
11.3.13. Water treatment Industry
11.3.14. Others
12. Rheology Modifiers - By Geography (Market Size -$Million / $Billion)
12.1. Rheology Modifiers Market - North America Segment Research
12.2. North America Market Research (Million / $Billion)
12.2.1. Segment type Size and Market Size Analysis
12.2.2. Revenue and Trends
12.2.3. Application Revenue and Trends by type of Application
12.2.4. Company Revenue and Product Analysis
12.2.5. North America Product type and Application Market Size
12.2.5.1. U.S.
12.2.5.2. Canada
12.2.5.3. Mexico
12.2.5.4. Rest of North America
12.3. Rheology Modifiers - South America Segment Research
12.4. South America Market Research (Market Size -$Million / $Billion)
12.4.1. Segment type Size and Market Size Analysis
12.4.2. Revenue and Trends
12.4.3. Application Revenue and Trends by type of Application
12.4.4. Company Revenue and Product Analysis
12.4.5. South America Product type and Application Market Size
12.4.5.1. Brazil
12.4.5.2. Venezuela
12.4.5.3. Argentina
12.4.5.4. Ecuador
12.4.5.5. Peru
12.4.5.6. Colombia
12.4.5.7. Costa Rica
12.4.5.8. Rest of South America
12.5. Rheology Modifiers - Europe Segment Research
12.6. Europe Market Research (Market Size -$Million / $Billion)
12.6.1. Segment type Size and Market Size Analysis
12.6.2. Revenue and Trends
12.6.3. Application Revenue and Trends by type of Application
12.6.4. Company Revenue and Product Analysis
12.6.5. Europe Segment Product type and Application Market Size
12.6.5.1. U.K
12.6.5.2. Germany
12.6.5.3. Italy
12.6.5.4. France
12.6.5.5. Netherlands
12.6.5.6. Belgium
12.6.5.7. Spain
12.6.5.8. Denmark
12.6.5.9. Rest of Europe
12.7. Rheology Modifiers – APAC Segment Research
12.8. APAC Market Research (Market Size -$Million / $Billion)
12.8.1. Segment type Size and Market Size Analysis
12.8.2. Revenue and Trends
12.8.3. Application Revenue and Trends by type of Application
12.8.4. Company Revenue and Product Analysis
12.8.5. APAC Segment – Product type and Application Market Size
12.8.5.1. China
12.8.5.2. Australia
12.8.5.3. Japan
12.8.5.4. South Korea
12.8.5.5. India
12.8.5.6. Taiwan
12.8.5.7. Malaysia
13. Rheology Modifiers Market - Entropy
13.1. New product launches
13.2. M&A's, collaborations, JVs and partnerships
14. Rheology Modifiers Market – Industry / Segment Competition landscape Premium
14.1. Market Share Analysis
14.1.1. Market Share by Country- Top companies
14.1.2. Market Share by Region- Top 10 companies
14.1.3. Market Share by type of Application – Top 10 companies
14.1.4. Market Share by type of Product / Product category- Top 10 companies
14.1.5. Market Share at global level- Top 10 companies
14.1.6. Best Practises for companies
15. Rheology Modifiers Market – Key Company List by Country Premium
16. Rheology Modifiers Market Company Analysis
16.1. Market Share, Company Revenue, Products, M&A, Developments
16.2. Elementis specialty Chemicals
16.3. BASF
16.4. Altana
16.5. Arkema
16.6. Croda Chemicals
16.7. Brenntag
16.8. Munzing Chemie Gmbh
16.9. Ashland
16.10. Lubrizol
16.11. Company 10
16.12. Company 11
16.13. Company 12 and more
"*Financials would be provided on a best efforts basis for private companies"
17. Rheology Modifiers Market -Appendix
17.1. Abbreviations
17.2. Sources
18. Rheology Modifiers Market -Methodology Premium
18.1. Research Methodology
18.1.1. Company Expert Interviews
18.1.2. Industry Databases
18.1.3. Associations
18.1.4. Company News
18.1.5. Company Annual Reports
18.1.6. Application Trends
18.1.7. New Products and Product database
18.1.8. Company Transcripts
18.1.9. R&D Trends
18.1.10. Key Opinion Leaders Interviews
18.1.11. Supply and Demand Trends
List of Tables
Table 1: Rheology Modifiers Market Overview 2021-2026
Table 2: Rheology Modifiers Market Leader Analysis 2018-2019 (US$)
Table 3: Rheology Modifiers Market Product Analysis 2018-2019 (US$)
Table 4: Rheology Modifiers Market End User Analysis 2018-2019 (US$)
Table 5: Rheology Modifiers Market Patent Analysis 2013-2018* (US$)
Table 6: Rheology Modifiers Market Financial Analysis 2018-2019 (US$)
Table 7: Rheology Modifiers Market Driver Analysis 2018-2019 (US$)
Table 8: Rheology Modifiers Market Challenges Analysis 2018-2019 (US$)
Table 9: Rheology Modifiers Market Constraint Analysis 2018-2019 (US$)
Table 10: Rheology Modifiers Market Supplier Bargaining Power Analysis 2018-2019 (US$)
Table 11: Rheology Modifiers Market Buyer Bargaining Power Analysis 2018-2019 (US$)
Table 12: Rheology Modifiers Market Threat of Substitutes Analysis 2018-2019 (US$)
Table 13: Rheology Modifiers Market Threat of New Entrants Analysis 2018-2019 (US$)
Table 14: Rheology Modifiers Market Degree of Competition Analysis 2018-2019 (US$)
Table 15: Rheology Modifiers Market Value Chain Analysis 2018-2019 (US$)
Table 16: Rheology Modifiers Market Pricing Analysis 2021-2026 (US$)
Table 17: Rheology Modifiers Market Opportunities Analysis 2021-2026 (US$)
Table 18: Rheology Modifiers Market Product Life Cycle Analysis 2021-2026 (US$)
Table 19: Rheology Modifiers Market Supplier Analysis 2018-2019 (US$)
Table 20: Rheology Modifiers Market Distributor Analysis 2018-2019 (US$)
Table 21: Rheology Modifiers Market Trend Analysis 2018-2019 (US$)
Table 22: Rheology Modifiers Market Size 2018 (US$)
Table 23: Rheology Modifiers Market Forecast Analysis 2021-2026 (US$)
Table 24: Rheology Modifiers Market Sales Forecast Analysis 2021-2026 (Units)
Table 25: Rheology Modifiers Market, Revenue & Volume, By Type, 2021-2026 ($)
Table 26: Rheology Modifiers Market By Type, Revenue & Volume, By Inorganic, 2021-2026 ($)
Table 27: Rheology Modifiers Market By Type, Revenue & Volume, By Organic, 2021-2026 ($)
Table 28: Rheology Modifiers Market, Revenue & Volume, By Chemistry, 2021-2026 ($)
Table 29: Rheology Modifiers Market By Chemistry, Revenue & Volume, By Water Based, 2021-2026 ($)
Table 30: Rheology Modifiers Market By Chemistry, Revenue & Volume, By Solvent Based, 2021-2026 ($)
Table 31: Rheology Modifiers Market, Revenue & Volume, By Form, 2021-2026 ($)
Table 32: Rheology Modifiers Market By Form, Revenue & Volume, By Liquid, 2021-2026 ($)
Table 33: Rheology Modifiers Market By Form, Revenue & Volume, By Powder, 2021-2026 ($)
Table 34: Rheology Modifiers Market By Form, Revenue & Volume, By Bulk Solid / Granules, 2021-2026 ($)
Table 35: Rheology Modifiers Market, Revenue & Volume, By Applications, 2021-2026 ($)
Table 36: Rheology Modifiers Market By Applications, Revenue & Volume, By Adhesives / Sealants, 2021-2026 ($)
Table 37: Rheology Modifiers Market By Applications, Revenue & Volume, By Cement/Concrete, 2021-2026 ($)
Table 38: Rheology Modifiers Market By Applications, Revenue & Volume, By Cleaners / Disinfectant, 2021-2026 ($)
Table 39: Rheology Modifiers Market By Applications, Revenue & Volume, By Coolants, 2021-2026 ($)
Table 40: Rheology Modifiers Market By Applications, Revenue & Volume, By Elastomers/Rubbers, 2021-2026 ($)
Table 41: Rheology Modifiers Market, Revenue & Volume, By End Use, 2021-2026 ($)
Table 42: Rheology Modifiers Market By End Use, Revenue & Volume, By Agriculture, 2021-2026 ($)
Table 43: Rheology Modifiers Market By End Use, Revenue & Volume, By Paints and Coatings, 2021-2026 ($)
Table 44: Rheology Modifiers Market By End Use, Revenue & Volume, By Ceramics, 2021-2026 ($)
Table 45: Rheology Modifiers Market By End Use, Revenue & Volume, By Cosmetics and Personal Care, 2021-2026 ($)
Table 46: Rheology Modifiers Market By End Use, Revenue & Volume, By Construction, 2021-2026 ($)
Table 47: North America Rheology Modifiers Market, Revenue & Volume, By Type, 2021-2026 ($)
Table 48: North America Rheology Modifiers Market, Revenue & Volume, By Chemistry, 2021-2026 ($)
Table 49: North America Rheology Modifiers Market, Revenue & Volume, By Form, 2021-2026 ($)
Table 50: North America Rheology Modifiers Market, Revenue & Volume, By Applications, 2021-2026 ($)
Table 51: North America Rheology Modifiers Market, Revenue & Volume, By End Use, 2021-2026 ($)
Table 52: South america Rheology Modifiers Market, Revenue & Volume, By Type, 2021-2026 ($)
Table 53: South america Rheology Modifiers Market, Revenue & Volume, By Chemistry, 2021-2026 ($)
Table 54: South america Rheology Modifiers Market, Revenue & Volume, By Form, 2021-2026 ($)
Table 55: South america Rheology Modifiers Market, Revenue & Volume, By Applications, 2021-2026 ($)
Table 56: South america Rheology Modifiers Market, Revenue & Volume, By End Use, 2021-2026 ($)
Table 57: Europe Rheology Modifiers Market, Revenue & Volume, By Type, 2021-2026 ($)
Table 58: Europe Rheology Modifiers Market, Revenue & Volume, By Chemistry, 2021-2026 ($)
Table 59: Europe Rheology Modifiers Market, Revenue & Volume, By Form, 2021-2026 ($)
Table 60: Europe Rheology Modifiers Market, Revenue & Volume, By Applications, 2021-2026 ($)
Table 61: Europe Rheology Modifiers Market, Revenue & Volume, By End Use, 2021-2026 ($)
Table 62: APAC Rheology Modifiers Market, Revenue & Volume, By Type, 2021-2026 ($)
Table 63: APAC Rheology Modifiers Market, Revenue & Volume, By Chemistry, 2021-2026 ($)
Table 64: APAC Rheology Modifiers Market, Revenue & Volume, By Form, 2021-2026 ($)
Table 65: APAC Rheology Modifiers Market, Revenue & Volume, By Applications, 2021-2026 ($)
Table 66: APAC Rheology Modifiers Market, Revenue & Volume, By End Use, 2021-2026 ($)
Table 67: Middle East & Africa Rheology Modifiers Market, Revenue & Volume, By Type, 2021-2026 ($)
Table 68: Middle East & Africa Rheology Modifiers Market, Revenue & Volume, By Chemistry, 2021-2026 ($)
Table 69: Middle East & Africa Rheology Modifiers Market, Revenue & Volume, By Form, 2021-2026 ($)
Table 70: Middle East & Africa Rheology Modifiers Market, Revenue & Volume, By Applications, 2021-2026 ($)
Table 71: Middle East & Africa Rheology Modifiers Market, Revenue & Volume, By End Use, 2021-2026 ($)
Table 72: Russia Rheology Modifiers Market, Revenue & Volume, By Type, 2021-2026 ($)
Table 73: Russia Rheology Modifiers Market, Revenue & Volume, By Chemistry, 2021-2026 ($)
Table 74: Russia Rheology Modifiers Market, Revenue & Volume, By Form, 2021-2026 ($)
Table 75: Russia Rheology Modifiers Market, Revenue & Volume, By Applications, 2021-2026 ($)
Table 76: Russia Rheology Modifiers Market, Revenue & Volume, By End Use, 2021-2026 ($)
Table 77: Israel Rheology Modifiers Market, Revenue & Volume, By Type, 2021-2026 ($)
Table 78: Israel Rheology Modifiers Market, Revenue & Volume, By Chemistry, 2021-2026 ($)
Table 79: Israel Rheology Modifiers Market, Revenue & Volume, By Form, 2021-2026 ($)
Table 80: Israel Rheology Modifiers Market, Revenue & Volume, By Applications, 2021-2026 ($)
Table 81: Israel Rheology Modifiers Market, Revenue & Volume, By End Use, 2021-2026 ($)
Table 82: Top Companies 2018 (US$)Rheology Modifiers Market, Revenue & Volume
Table 83: Product Launch 2018-2019Rheology Modifiers Market, Revenue & Volume
Table 84: Mergers & Acquistions 2018-2019Rheology Modifiers Market, Revenue & Volume
List of Figures
Figure 1: Overview of Rheology Modifiers Market 2021-2026
Figure 2: Market Share Analysis for Rheology Modifiers Market 2018 (US$)
Figure 3: Product Comparison in Rheology Modifiers Market 2018-2019 (US$)
Figure 4: End User Profile for Rheology Modifiers Market 2018-2019 (US$)
Figure 5: Patent Application and Grant in Rheology Modifiers Market 2013-2018* (US$)
Figure 6: Top 5 Companies Financial Analysis in Rheology Modifiers Market 2018-2019 (US$)
Figure 7: Market Entry Strategy in Rheology Modifiers Market 2018-2019
Figure 8: Ecosystem Analysis in Rheology Modifiers Market 2018
Figure 9: Average Selling Price in Rheology Modifiers Market 2021-2026
Figure 10: Top Opportunites in Rheology Modifiers Market 2018-2019
Figure 11: Market Life Cycle Analysis in Rheology Modifiers Market
Figure 12: GlobalBy TypeRheology Modifiers Market Revenue, 2021-2026 ($)
Figure 13: GlobalBy ChemistryRheology Modifiers Market Revenue, 2021-2026 ($)
Figure 14: GlobalBy FormRheology Modifiers Market Revenue, 2021-2026 ($)
Figure 15: GlobalBy ApplicationsRheology Modifiers Market Revenue, 2021-2026 ($)
Figure 16: GlobalBy End UseRheology Modifiers Market Revenue, 2021-2026 ($)
Figure 17: Global Rheology Modifiers Market - By Geography
Figure 18: Global Rheology Modifiers Market Value & Volume, By Geography, 2021-2026 ($)
Figure 19: Global Rheology Modifiers Market CAGR, By Geography, 2021-2026 (%)
Figure 20: North America Rheology Modifiers Market Value & Volume, 2021-2026 ($)
Figure 21: US Rheology Modifiers Market Value & Volume, 2021-2026 ($)
Figure 22: US GDP and Population, 2018-2019 ($)
Figure 23: US GDP – Composition of 2018, By Sector of Origin
Figure 24: US Export and Import Value & Volume, 2018-2019 ($)
Figure 25: Canada Rheology Modifiers Market Value & Volume, 2021-2026 ($)
Figure 26: Canada GDP and Population, 2018-2019 ($)
Figure 27: Canada GDP – Composition of 2018, By Sector of Origin
Figure 28: Canada Export and Import Value & Volume, 2018-2019 ($)
Figure 29: Mexico Rheology Modifiers Market Value & Volume, 2021-2026 ($)
Figure 30: Mexico GDP and Population, 2018-2019 ($)
Figure 31: Mexico GDP – Composition of 2018, By Sector of Origin
Figure 32: Mexico Export and Import Value & Volume, 2018-2019 ($)
Figure 33: South America Rheology Modifiers Market Value & Volume, 2021-2026 ($)
Figure 34: Brazil Rheology Modifiers Market Value & Volume, 2021-2026 ($)
Figure 35: Brazil GDP and Population, 2018-2019 ($)
Figure 36: Brazil GDP – Composition of 2018, By Sector of Origin
Figure 37: Brazil Export and Import Value & Volume, 2018-2019 ($)
Figure 38: Venezuela Rheology Modifiers Market Value & Volume, 2021-2026 ($)
Figure 39: Venezuela GDP and Population, 2018-2019 ($)
Figure 40: Venezuela GDP – Composition of 2018, By Sector of Origin
Figure 41: Venezuela Export and Import Value & Volume, 2018-2019 ($)
Figure 42: Argentina Rheology Modifiers Market Value & Volume, 2021-2026 ($)
Figure 43: Argentina GDP and Population, 2018-2019 ($)
Figure 44: Argentina GDP – Composition of 2018, By Sector of Origin
Figure 45: Argentina Export and Import Value & Volume, 2018-2019 ($)
Figure 46: Ecuador Rheology Modifiers Market Value & Volume, 2021-2026 ($)
Figure 47: Ecuador GDP and Population, 2018-2019 ($)
Figure 48: Ecuador GDP – Composition of 2018, By Sector of Origin
Figure 49: Ecuador Export and Import Value & Volume, 2018-2019 ($)
Figure 50: Peru Rheology Modifiers Market Value & Volume, 2021-2026 ($)
Figure 51: Peru GDP and Population, 2018-2019 ($)
Figure 52: Peru GDP – Composition of 2018, By Sector of Origin
Figure 53: Peru Export and Import Value & Volume, 2018-2019 ($)
Figure 54: Colombia Rheology Modifiers Market Value & Volume, 2021-2026 ($)
Figure 55: Colombia GDP and Population, 2018-2019 ($)
Figure 56: Colombia GDP – Composition of 2018, By Sector of Origin
Figure 57: Colombia Export and Import Value & Volume, 2018-2019 ($)
Figure 58: Costa Rica Rheology Modifiers Market Value & Volume, 2021-2026 ($)
Figure 59: Costa Rica GDP and Population, 2018-2019 ($)
Figure 60: Costa Rica GDP – Composition of 2018, By Sector of Origin
Figure 61: Costa Rica Export and Import Value & Volume, 2018-2019 ($)
Figure 62: Europe Rheology Modifiers Market Value & Volume, 2021-2026 ($)
Figure 63: U.K Rheology Modifiers Market Value & Volume, 2021-2026 ($)
Figure 64: U.K GDP and Population, 2018-2019 ($)
Figure 65: U.K GDP – Composition of 2018, By Sector of Origin
Figure 66: U.K Export and Import Value & Volume, 2018-2019 ($)
Figure 67: Germany Rheology Modifiers Market Value & Volume, 2021-2026 ($)
Figure 68: Germany GDP and Population, 2018-2019 ($)
Figure 69: Germany GDP – Composition of 2018, By Sector of Origin
Figure 70: Germany Export and Import Value & Volume, 2018-2019 ($)
Figure 71: Italy Rheology Modifiers Market Value & Volume, 2021-2026 ($)
Figure 72: Italy GDP and Population, 2018-2019 ($)
Figure 73: Italy GDP – Composition of 2018, By Sector of Origin
Figure 74: Italy Export and Import Value & Volume, 2018-2019 ($)
Figure 75: France Rheology Modifiers Market Value & Volume, 2021-2026 ($)
Figure 76: France GDP and Population, 2018-2019 ($)
Figure 77: France GDP – Composition of 2018, By Sector of Origin
Figure 78: France Export and Import Value & Volume, 2018-2019 ($)
Figure 79: Netherlands Rheology Modifiers Market Value & Volume, 2021-2026 ($)
Figure 80: Netherlands GDP and Population, 2018-2019 ($)
Figure 81: Netherlands GDP – Composition of 2018, By Sector of Origin
Figure 82: Netherlands Export and Import Value & Volume, 2018-2019 ($)
Figure 83: Belgium Rheology Modifiers Market Value & Volume, 2021-2026 ($)
Figure 84: Belgium GDP and Population, 2018-2019 ($)
Figure 85: Belgium GDP – Composition of 2018, By Sector of Origin
Figure 86: Belgium Export and Import Value & Volume, 2018-2019 ($)
Figure 87: Spain Rheology Modifiers Market Value & Volume, 2021-2026 ($)
Figure 88: Spain GDP and Population, 2018-2019 ($)
Figure 89: Spain GDP – Composition of 2018, By Sector of Origin
Figure 90: Spain Export and Import Value & Volume, 2018-2019 ($)
Figure 91: Denmark Rheology Modifiers Market Value & Volume, 2021-2026 ($)
Figure 92: Denmark GDP and Population, 2018-2019 ($)
Figure 93: Denmark GDP – Composition of 2018, By Sector of Origin
Figure 94: Denmark Export and Import Value & Volume, 2018-2019 ($)
Figure 95: APAC Rheology Modifiers Market Value & Volume, 2021-2026 ($)
Figure 96: China Rheology Modifiers Market Value & Volume, 2021-2026
Figure 97: China GDP and Population, 2018-2019 ($)
Figure 98: China GDP – Composition of 2018, By Sector of Origin
Figure 99: China Export and Import Value & Volume, 2018-2019 ($)Rheology Modifiers Market China Export and Import Value & Volume, 2018-2019 ($)
Figure 100: Australia Rheology Modifiers Market Value & Volume, 2021-2026 ($)
Figure 101: Australia GDP and Population, 2018-2019 ($)
Figure 102: Australia GDP – Composition of 2018, By Sector of Origin
Figure 103: Australia Export and Import Value & Volume, 2018-2019 ($)
Figure 104: South Korea Rheology Modifiers Market Value & Volume, 2021-2026 ($)
Figure 105: South Korea GDP and Population, 2018-2019 ($)
Figure 106: South Korea GDP – Composition of 2018, By Sector of Origin
Figure 107: South Korea Export and Import Value & Volume, 2018-2019 ($)
Figure 108: India Rheology Modifiers Market Value & Volume, 2021-2026 ($)
Figure 109: India GDP and Population, 2018-2019 ($)
Figure 110: India GDP – Composition of 2018, By Sector of Origin
Figure 111: India Export and Import Value & Volume, 2018-2019 ($)
Figure 112: Taiwan Rheology Modifiers Market Value & Volume, 2021-2026 ($)
Figure 113: Taiwan GDP and Population, 2018-2019 ($)
Figure 114: Taiwan GDP – Composition of 2018, By Sector of Origin
Figure 115: Taiwan Export and Import Value & Volume, 2018-2019 ($)
Figure 116: Malaysia Rheology Modifiers Market Value & Volume, 2021-2026 ($)
Figure 117: Malaysia GDP and Population, 2018-2019 ($)
Figure 118: Malaysia GDP – Composition of 2018, By Sector of Origin
Figure 119: Malaysia Export and Import Value & Volume, 2018-2019 ($)
Figure 120: Hong Kong Rheology Modifiers Market Value & Volume, 2021-2026 ($)
Figure 121: Hong Kong GDP and Population, 2018-2019 ($)
Figure 122: Hong Kong GDP – Composition of 2018, By Sector of Origin
Figure 123: Hong Kong Export and Import Value & Volume, 2018-2019 ($)
Figure 124: Middle East & Africa Rheology Modifiers Market Middle East & Africa 3D Printing Market Value & Volume, 2021-2026 ($)
Figure 125: Russia Rheology Modifiers Market Value & Volume, 2021-2026 ($)
Figure 126: Russia GDP and Population, 2018-2019 ($)
Figure 127: Russia GDP – Composition of 2018, By Sector of Origin
Figure 128: Russia Export and Import Value & Volume, 2018-2019 ($)
Figure 129: Israel Rheology Modifiers Market Value & Volume, 2021-2026 ($)
Figure 130: Israel GDP and Population, 2018-2019 ($)
Figure 131: Israel GDP – Composition of 2018, By Sector of Origin
Figure 132: Israel Export and Import Value & Volume, 2018-2019 ($)
Figure 133: Entropy Share, By Strategies, 2018-2019* (%)Rheology Modifiers Market
Figure 134: Developments, 2018-2019*Rheology Modifiers Market
Figure 135: Company 1 Rheology Modifiers Market Net Revenue, By Years, 2018-2019* ($)
Figure 136: Company 1 Rheology Modifiers Market Net Revenue Share, By Business segments, 2018 (%)
Figure 137: Company 1 Rheology Modifiers Market Net Sales Share, By Geography, 2018 (%)
Figure 138: Company 2 Rheology Modifiers Market Net Revenue, By Years, 2018-2019* ($)
Figure 139: Company 2 Rheology Modifiers Market Net Revenue Share, By Business segments, 2018 (%)
Figure 140: Company 2 Rheology Modifiers Market Net Sales Share, By Geography, 2018 (%)
Figure 141: Company 3 Rheology Modifiers Market Net Revenue, By Years, 2018-2019* ($)
Figure 142: Company 3 Rheology Modifiers Market Net Revenue Share, By Business segments, 2018 (%)
Figure 143: Company 3 Rheology Modifiers Market Net Sales Share, By Geography, 2018 (%)
Figure 144: Company 4 Rheology Modifiers Market Net Revenue, By Years, 2018-2019* ($)
Figure 145: Company 4 Rheology Modifiers Market Net Revenue Share, By Business segments, 2018 (%)
Figure 146: Company 4 Rheology Modifiers Market Net Sales Share, By Geography, 2018 (%)
Figure 147: Company 5 Rheology Modifiers Market Net Revenue, By Years, 2018-2019* ($)
Figure 148: Company 5 Rheology Modifiers Market Net Revenue Share, By Business segments, 2018 (%)
Figure 149: Company 5 Rheology Modifiers Market Net Sales Share, By Geography, 2018 (%)
Figure 150: Company 6 Rheology Modifiers Market Net Revenue, By Years, 2018-2019* ($)
Figure 151: Company 6 Rheology Modifiers Market Net Revenue Share, By Business segments, 2018 (%)
Figure 152: Company 6 Rheology Modifiers Market Net Sales Share, By Geography, 2018 (%)
Figure 153: Company 7 Rheology Modifiers Market Net Revenue, By Years, 2018-2019* ($)
Figure 154: Company 7 Rheology Modifiers Market Net Revenue Share, By Business segments, 2018 (%)
Figure 155: Company 7 Rheology Modifiers Market Net Sales Share, By Geography, 2018 (%)
Figure 156: Company 8 Rheology Modifiers Market Net Revenue, By Years, 2018-2019* ($)
Figure 157: Company 8 Rheology Modifiers Market Net Revenue Share, By Business segments, 2018 (%)
Figure 158: Company 8 Rheology Modifiers Market Net Sales Share, By Geography, 2018 (%)
Figure 159: Company 9 Rheology Modifiers Market Net Revenue, By Years, 2018-2019* ($)
Figure 160: Company 9 Rheology Modifiers Market Net Revenue Share, By Business segments, 2018 (%)
Figure 161: Company 9 Rheology Modifiers Market Net Sales Share, By Geography, 2018 (%)
Figure 162: Company 10 Rheology Modifiers Market Net Revenue, By Years, 2018-2019* ($)
Figure 163: Company 10 Rheology Modifiers Market Net Revenue Share, By Business segments, 2018 (%)
Figure 164: Company 10 Rheology Modifiers Market Net Sales Share, By Geography, 2018 (%)
Figure 165: Company 11 Rheology Modifiers Market Net Revenue, By Years, 2018-2019* ($)
Figure 166: Company 11 Rheology Modifiers Market Net Revenue Share, By Business segments, 2018 (%)
Figure 167: Company 11 Rheology Modifiers Market Net Sales Share, By Geography, 2018 (%)
Figure 168: Company 12 Rheology Modifiers Market Net Revenue, By Years, 2018-2019* ($)
Figure 169: Company 12 Rheology Modifiers Market Net Revenue Share, By Business segments, 2018 (%)
Figure 170: Company 12 Rheology Modifiers Market Net Sales Share, By Geography, 2018 (%)
Figure 171: Company 13 Rheology Modifiers Market Net Revenue, By Years, 2018-2019* ($)
Figure 172: Company 13 Rheology Modifiers Market Net Revenue Share, By Business segments, 2018 (%)
Figure 173: Company 13 Rheology Modifiers Market Net Sales Share, By Geography, 2018 (%)
Figure 174: Company 14 Rheology Modifiers Market Net Revenue, By Years, 2018-2019* ($)
Figure 175: Company 14 Rheology Modifiers Market Net Revenue Share, By Business segments, 2018 (%)
Figure 176: Company 14 Rheology Modifiers Market Net Sales Share, By Geography, 2018 (%)
Figure 177: Company 15 Rheology Modifiers Market Net Revenue, By Years, 2018-2019* ($)
Figure 178: Company 15 Rheology Modifiers Market Net Revenue Share, By Business segments, 2018 (%)
Figure 179: Company 15 Rheology Modifiers Market Net Sales Share, By Geography, 2018 (%)