 Email
Email Print
Print


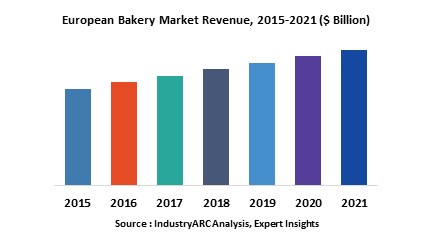
In 2017, the Global European Bakery Market revenue is estimated at $226 billion and forecasted to grow at a CAGR of more than 3.3 % during 2018 to 2023. Europe remains one of the vital markets for bakery industry owing to its penetration as a staple food in many nations. The market is well established in terms of product array, distribution channels, regulations, innovation platforms and consumer preferences.
Europe Bakery Market
Convenience is considered as an important factor to Europeans when it comes to selecting food. With extra wage-earning women and single-person households, people have no time to cook. However, the younger generation is looking for convenience with products that can be eaten on the go. Majorly, consumers are increasingly preferred to shop for all their grocery needs once a week, for the sake of convenience. Resulting in the reduction of conventional bakeries, as consumers are shopping at in-store bakeries. Europe is a refreshing publishing concept which contains an emerging study of the recent research, innovation, and development. Technology and efficiency in energy are never seen in one place with all competitiveness and the fast pacing world changes large-scale baking, confectionery industries in Europe.
This report incorporates an in-depth assessment of European Bakery Market by Type, Category Distribution Channel and Geography.
Market Research and Market Trends of European Bakery Market
- With an aging population and the focus on health, EU consumers are looking for healthier alternatives such as fresh, organic, artisanal, added-value and ethnic baked goods. Gluten-free and organic products are the latest key factors which are driving bakery market as the nutritional demand is increasing significantly. The bakery sector is dynamic in terms of innovation and quick response to consumer demand.
- The market is well established and organized in terms of product arrays, distribution channels, consumer preference and innovation platforms. Analyzing one distribution channel such as Supermarket whose sales are largely responsible on artisan bakers where more consumers are preferring baked goods, trends of organic, free-from, natural ingredients, high nutritional profile and environmental packaging are set to impact the consumer choices as well as manufacturer’s product mix and promotional strategies
Who are the Major Players in European Bakery market?
The companies referred to in the market research report includes Agrofert A.S., Associated British Foods Plc, Cereal Partners Worldwide Plc, Harry Brot GmbH, Kellogg Company, Kronenbrot KG Franz Mainz, Premier Foods Plc, Dr Schar AG/SPA, Warburtons, Yildiz Holding AS and more than 20 companies.
What is our report scope?
The report incorporates in-depth assessment of the competitive landscape, product market sizing, product benchmarking, market trends, product developments, financial analysis, strategic analysis and so on to gauge the impact forces and potential opportunities of the market. Apart from this the report also includes a study of major developments in the market such as product launches, agreements, acquisitions, collaborations, mergers and so on to comprehend the prevailing market dynamics at present and its impact during the forecast period 2018-2023.
All our reports are customizable to your company needs to a certain extent, we do provide 20 free consulting hours along with purchase of each report, and this will allow you to request any additional data to customize the report to your needs.
Key Takeaways from this Report
- Evaluate market potential through analyzing growth rates (CAGR %), Volume (Units) and Value ($M) data given at country level – for product types, end use applications and by different industry verticals.
- Understand the different dynamics influencing the market – key driving factors, challenges and hidden opportunities.
- Get in-depth insights on your competitor performance – market shares, strategies, financial benchmarking, product benchmarking, SWOT and more.
- Analyze the sales and distribution channels across key geographies to improve top-line revenues.
- Understand the industry supply chain with a deep-dive on the value augmentation at each step, in order to optimize value and bring efficiencies in your processes.
- Get a quick outlook on the market entropy – M&A’s, deals, partnerships, product launches of all key players for the past 4 years.
- Evaluate the supply-demand gaps, import-export statistics and regulatory landscape for more than top 20 countries globally for the market.
For more Food and Beverages
related reports, please click here
1. European Bakery - Market Overview
2. European Bakery Market Executive Summary
3. European Bakery Market Landscape
3.1. Market Share Analysis
3.2. Comparative Analysis
3.2.1. Product Benchmarking
3.2.2. End User profiling
3.2.3. Patent Analysis
3.2.4. Top 5 Financials Analysis
4. European Bakery Market Forces
4.1. Market Drivers
4.2. Market Constraints and Market Challenges
4.3. Attractiveness of the Industry
4.3.1. Power of Suppliers
4.3.2. Power of Customers
4.3.3. Threat of New entrants
4.3.4. Threat of Substitution
4.3.5. Degree of Competition
5. European Bakery Market – Strategic Analysis
5.1. Value Chain Analysis
5.2.Pricing Analysis
5.3. Opportunities Analysis
5.4. Product/Market Life Cycle Analysis
5.5.Suppliers and Distributors
6. European Bakery Market – By Type
6.1. Introduction
6.2. Baked Goods
6.2.1. Baked Desserts
6.2.1.1. Cakes & Pastries
6.2.1.2. Pies & Tarts
6.2.1.3. Others
6.2.2. Breads & Rolls
6.2.3. Biscuits
6.2.3.1. Savory Biscuits & Crackers
6.2.3.2. Sweet Biscuits
6.2.4. Pizzas
6.2.4.1. Fresh
6.2.4.2. Frozen/ Chilled
6.3. Breakfast Cereals
6.3.1. Hot Cereals
6.3.2. Ready-to-Eat Cereals
7. European Bakery Market - By Category
7.1. Fresh Bakery Products
7.2. Frozen Bakery Products
8. European Bakery Market – By Distribution Channel
8.1. Introduction
8.2. Retail
8.2.1. Supermarkets/Hypermarkets
8.2.2. Small Grocery Stores
8.2.3. Discounters
8.2.4. Specialty Food Stores
8.2.5. Convenience Stores
8.2.6. Bakery Outlets
8.2.7. Others
8.3. Artisan Bakers
8.4. Catering
9. European Bakery Market – By Geography
9.1. Europe
9.1. U.K
9.2. Germany
9.3. Italy
9.4. France
9.5. Netherlands
9.6. Belgium
9.7. Spain
9.8. Denmark
9.9. Rest of Europe
10. European Bakery Market Entropy
10.1. New Product Launches
10.2. M&As, Collaborations, JVs, Partnership
11. Company Profiles (Overview, Financials, SWOT Analysis, Developments, Product Portfolio)
11.1. Agrofert A.S.
11.2. Associated British Foods Plc
11.3. Cereal Partners Worldwide Plc
11.4. Harry Brot GmbH
11.5. Kellogg Company
11.6. Kronenbrot KG Franz Mainz
11.7. Premier Foods Plc
11.8. Dr Schar AG/SPA
11.9. Warburtons
11.10. Yildiz Holding AS
*More than 10 Companies are profiled in this Research Report*
"*Financials would be provided on a best efforts basis for private companies"
12. Appendix
12.1. Abbreviations
12.2. Sources
12.3. Research Methodology
12.4. Bibliography
12.5. Compilation of Expert Insights
12.6. Disclaimer
List of Tables
Table 1 European Bakery Market Overview 2021-2026
Table 2 European Bakery Market Leader Analysis 2018-2019 (US$)
Table 3 European Bakery MarketProduct Analysis 2018-2019 (US$)
Table 4 European Bakery MarketEnd User Analysis 2018-2019 (US$)
Table 5 European Bakery MarketPatent Analysis 2013-2018* (US$)
Table 6 European Bakery MarketFinancial Analysis 2018-2019 (US$)
Table 7 European Bakery Market Driver Analysis 2018-2019 (US$)
Table 8 European Bakery MarketChallenges Analysis 2018-2019 (US$)
Table 9 European Bakery MarketConstraint Analysis 2018-2019 (US$)
Table 10 European Bakery Market Supplier Bargaining Power Analysis 2018-2019 (US$)
Table 11 European Bakery Market Buyer Bargaining Power Analysis 2018-2019 (US$)
Table 12 European Bakery Market Threat of Substitutes Analysis 2018-2019 (US$)
Table 13 European Bakery Market Threat of New Entrants Analysis 2018-2019 (US$)
Table 14 European Bakery Market Degree of Competition Analysis 2018-2019 (US$)
Table 15 European Bakery MarketValue Chain Analysis 2018-2019 (US$)
Table 16 European Bakery MarketPricing Analysis 2021-2026 (US$)
Table 17 European Bakery MarketOpportunities Analysis 2021-2026 (US$)
Table 18 European Bakery MarketProduct Life Cycle Analysis 2021-2026 (US$)
Table 19 European Bakery MarketSupplier Analysis 2018-2019 (US$)
Table 20 European Bakery MarketDistributor Analysis 2018-2019 (US$)
Table 21 European Bakery Market Trend Analysis 2018-2019 (US$)
Table 22 European Bakery Market Size 2018 (US$)
Table 23 European Bakery Market Forecast Analysis 2021-2026 (US$)
Table 24 European Bakery Market Sales Forecast Analysis 2021-2026 (Units)
Table 25 European Bakery Market, Revenue & Volume,By Type, 2021-2026 ($)
Table 26 European Bakery MarketBy Type, Revenue & Volume,By Baked Goods, 2021-2026 ($)
Table 27 European Bakery MarketBy Type, Revenue & Volume,By Baked Desserts, 2021-2026 ($)
Table 28 European Bakery MarketBy Type, Revenue & Volume,By Breads & Rolls, 2021-2026 ($)
Table 29 European Bakery MarketBy Type, Revenue & Volume,By Biscuits, 2021-2026 ($)
Table 30 European Bakery MarketBy Type, Revenue & Volume,By Breakfast Cereals, 2021-2026 ($)
Table 31 European Bakery Market, Revenue & Volume,By Distribution Channel, 2021-2026 ($)
Table 32 European Bakery MarketBy Distribution Channel, Revenue & Volume,By Retail, 2021-2026 ($)
Table 33 European Bakery MarketBy Distribution Channel, Revenue & Volume,By Supermarkets/Hypermarkets, 2021-2026 ($)
Table 34 European Bakery MarketBy Distribution Channel, Revenue & Volume,By Small Grocery Stores, 2021-2026 ($)
Table 35 European Bakery MarketBy Distribution Channel, Revenue & Volume,By Artisan Bakers, 2021-2026 ($)
Table 36 European Bakery MarketBy Distribution Channel, Revenue & Volume,By Catering, 2021-2026 ($)
Table 37 North America European Bakery Market, Revenue & Volume,By Type, 2021-2026 ($)
Table 38 North America European Bakery Market, Revenue & Volume,By Distribution Channel, 2021-2026 ($)
Table 39 South america European Bakery Market, Revenue & Volume,By Type, 2021-2026 ($)
Table 40 South america European Bakery Market, Revenue & Volume,By Distribution Channel, 2021-2026 ($)
Table 41 Europe European Bakery Market, Revenue & Volume,By Type, 2021-2026 ($)
Table 42 Europe European Bakery Market, Revenue & Volume,By Distribution Channel, 2021-2026 ($)
Table 43 APAC European Bakery Market, Revenue & Volume,By Type, 2021-2026 ($)
Table 44 APAC European Bakery Market, Revenue & Volume,By Distribution Channel, 2021-2026 ($)
Table 45 Middle East & Africa European Bakery Market, Revenue & Volume,By Type, 2021-2026 ($)
Table 46 Middle East & Africa European Bakery Market, Revenue & Volume,By Distribution Channel, 2021-2026 ($)
Table 47 Russia European Bakery Market, Revenue & Volume,By Type, 2021-2026 ($)
Table 48 Russia European Bakery Market, Revenue & Volume,By Distribution Channel, 2021-2026 ($)
Table 49 Israel European Bakery Market, Revenue & Volume,By Type, 2021-2026 ($)
Table 50 Israel European Bakery Market, Revenue & Volume,By Distribution Channel, 2021-2026 ($)
Table 51 Top Companies 2018 (US$)European Bakery Market, Revenue & Volume,,
Table 52 Product Launch 2018-2019European Bakery Market, Revenue & Volume,,
Table 53 Mergers & Acquistions 2018-2019European Bakery Market, Revenue & Volume,,
List of Figures
Figure 1 Overview of European Bakery Market 2021-2026
Figure 2 Market Share Analysis for European Bakery Market 2018 (US$)
Figure 3 Product Comparison in European Bakery Market 2018-2019 (US$)
Figure 4 End User Profile for European Bakery Market 2018-2019 (US$)
Figure 5 Patent Application and Grant in European Bakery Market 2013-2018* (US$)
Figure 6 Top 5 Companies Financial Analysis in European Bakery Market 2018-2019 (US$)
Figure 7 Market Entry Strategy in European Bakery Market 2018-2019
Figure 8 Ecosystem Analysis in European Bakery Market2018
Figure 9 Average Selling Price in European Bakery Market 2021-2026
Figure 10 Top Opportunites in European Bakery Market 2018-2019
Figure 11 Market Life Cycle Analysis in European Bakery Market
Figure 12 GlobalBy TypeEuropean Bakery Market Revenue, 2021-2026 ($)
Figure 13 GlobalBy Distribution ChannelEuropean Bakery Market Revenue, 2021-2026 ($)
Figure 14 Global European Bakery Market - By European
Figure 15 Global European Bakery Market Value & Volume, By European, 2021-2026 ($)
Figure 16 Global European Bakery Market CAGR, By European, 2021-2026 (%)
Figure 17 North America European Bakery Market Value & Volume, 2021-2026 ($)
Figure 18 US European Bakery Market Value & Volume, 2021-2026 ($)
Figure 19 US GDP and Population, 2018-2019 ($)
Figure 20 US GDP – Composition of 2018, By Sector of Origin
Figure 21 US Export and Import Value & Volume, 2018-2019 ($)
Figure 22 Canada European Bakery Market Value & Volume, 2021-2026 ($)
Figure 23 Canada GDP and Population, 2018-2019 ($)
Figure 24 Canada GDP – Composition of 2018, By Sector of Origin
Figure 25 Canada Export and Import Value & Volume, 2018-2019 ($)
Figure 26 Mexico European Bakery Market Value & Volume, 2021-2026 ($)
Figure 27 Mexico GDP and Population, 2018-2019 ($)
Figure 28 Mexico GDP – Composition of 2018, By Sector of Origin
Figure 29 Mexico Export and Import Value & Volume, 2018-2019 ($)
Figure 30 South America European Bakery MarketSouth America 3D Printing Market Value & Volume, 2021-2026 ($)
Figure 31 Brazil European Bakery Market Value & Volume, 2021-2026 ($)
Figure 32 Brazil GDP and Population, 2018-2019 ($)
Figure 33 Brazil GDP – Composition of 2018, By Sector of Origin
Figure 34 Brazil Export and Import Value & Volume, 2018-2019 ($)
Figure 35 Venezuela European Bakery Market Value & Volume, 2021-2026 ($)
Figure 36 Venezuela GDP and Population, 2018-2019 ($)
Figure 37 Venezuela GDP – Composition of 2018, By Sector of Origin
Figure 38 Venezuela Export and Import Value & Volume, 2018-2019 ($)
Figure 39 Argentina European Bakery Market Value & Volume, 2021-2026 ($)
Figure 40 Argentina GDP and Population, 2018-2019 ($)
Figure 41 Argentina GDP – Composition of 2018, By Sector of Origin
Figure 42 Argentina Export and Import Value & Volume, 2018-2019 ($)
Figure 43 Ecuador European Bakery Market Value & Volume, 2021-2026 ($)
Figure 44 Ecuador GDP and Population, 2018-2019 ($)
Figure 45 Ecuador GDP – Composition of 2018, By Sector of Origin
Figure 46 Ecuador Export and Import Value & Volume, 2018-2019 ($)
Figure 47 Peru European Bakery Market Value & Volume, 2021-2026 ($)
Figure 48 Peru GDP and Population, 2018-2019 ($)
Figure 49 Peru GDP – Composition of 2018, By Sector of Origin
Figure 50 Peru Export and Import Value & Volume, 2018-2019 ($)
Figure 51 Colombia European Bakery Market Value & Volume, 2021-2026 ($)
Figure 52 Colombia GDP and Population, 2018-2019 ($)
Figure 53 Colombia GDP – Composition of 2018, By Sector of Origin
Figure 54 Colombia Export and Import Value & Volume, 2018-2019 ($)
Figure 55 Costa Rica European Bakery MarketCosta Rica 3D Printing Market Value & Volume, 2021-2026 ($)
Figure 56 Costa Rica GDP and Population, 2018-2019 ($)
Figure 57 Costa Rica GDP – Composition of 2018, By Sector of Origin
Figure 58 Costa Rica Export and Import Value & Volume, 2018-2019 ($)
Figure 59 Europe European Bakery Market Value & Volume, 2021-2026 ($)
Figure 60 U.K European Bakery Market Value & Volume, 2021-2026 ($)
Figure 61 U.K GDP and Population, 2018-2019 ($)
Figure 62 U.K GDP – Composition of 2018, By Sector of Origin
Figure 63 U.K Export and Import Value & Volume, 2018-2019 ($)
Figure 64 Germany European Bakery Market Value & Volume, 2021-2026 ($)
Figure 65 Germany GDP and Population, 2018-2019 ($)
Figure 66 Germany GDP – Composition of 2018, By Sector of Origin
Figure 67 Germany Export and Import Value & Volume, 2018-2019 ($)
Figure 68 Italy European Bakery Market Value & Volume, 2021-2026 ($)
Figure 69 Italy GDP and Population, 2018-2019 ($)
Figure 70 Italy GDP – Composition of 2018, By Sector of Origin
Figure 71 Italy Export and Import Value & Volume, 2018-2019 ($)
Figure 72 France European Bakery Market Value & Volume, 2021-2026 ($)
Figure 73 France GDP and Population, 2018-2019 ($)
Figure 74 France GDP – Composition of 2018, By Sector of Origin
Figure 75 France Export and Import Value & Volume, 2018-2019 ($)
Figure 76 Netherlands European Bakery Market Value & Volume, 2021-2026 ($)
Figure 77 Netherlands GDP and Population, 2018-2019 ($)
Figure 78 Netherlands GDP – Composition of 2018, By Sector of Origin
Figure 79 Netherlands Export and Import Value & Volume, 2018-2019 ($)
Figure 80 Belgium European Bakery Market Value & Volume, 2021-2026 ($)
Figure 81 Belgium GDP and Population, 2018-2019 ($)
Figure 82 Belgium GDP – Composition of 2018, By Sector of Origin
Figure 83 Belgium Export and Import Value & Volume, 2018-2019 ($)
Figure 84 Spain European Bakery Market Value & Volume, 2021-2026 ($)
Figure 85 Spain GDP and Population, 2018-2019 ($)
Figure 86 Spain GDP – Composition of 2018, By Sector of Origin
Figure 87 Spain Export and Import Value & Volume, 2018-2019 ($)
Figure 88 Denmark European Bakery Market Value & Volume, 2021-2026 ($)
Figure 89 Denmark GDP and Population, 2018-2019 ($)
Figure 90 Denmark GDP – Composition of 2018, By Sector of Origin
Figure 91 Denmark Export and Import Value & Volume, 2018-2019 ($)
Figure 92 APAC European Bakery Market Value & Volume, 2021-2026 ($)
Figure 93 China European Bakery MarketValue & Volume, 2021-2026
Figure 94 China GDP and Population, 2018-2019 ($)
Figure 95 China GDP – Composition of 2018, By Sector of Origin
Figure 96 China Export and Import Value & Volume, 2018-2019 ($)European Bakery MarketChina Export and Import Value & Volume, 2018-2019 ($)
Figure 97 Australia European Bakery Market Value & Volume, 2021-2026 ($)
Figure 98 Australia GDP and Population, 2018-2019 ($)
Figure 99 Australia GDP – Composition of 2018, By Sector of Origin
Figure 100 Australia Export and Import Value & Volume, 2018-2019 ($)
Figure 101 South Korea European Bakery Market Value & Volume, 2021-2026 ($)
Figure 102 South Korea GDP and Population, 2018-2019 ($)
Figure 103 South Korea GDP – Composition of 2018, By Sector of Origin
Figure 104 South Korea Export and Import Value & Volume, 2018-2019 ($)
Figure 105 India European Bakery Market Value & Volume, 2021-2026 ($)
Figure 106 India GDP and Population, 2018-2019 ($)
Figure 107 India GDP – Composition of 2018, By Sector of Origin
Figure 108 India Export and Import Value & Volume, 2018-2019 ($)
Figure 109 Taiwan European Bakery MarketTaiwan 3D Printing Market Value & Volume, 2021-2026 ($)
Figure 110 Taiwan GDP and Population, 2018-2019 ($)
Figure 111 Taiwan GDP – Composition of 2018, By Sector of Origin
Figure 112 Taiwan Export and Import Value & Volume, 2018-2019 ($)
Figure 113 Malaysia European Bakery MarketMalaysia 3D Printing Market Value & Volume, 2021-2026 ($)
Figure 114 Malaysia GDP and Population, 2018-2019 ($)
Figure 115 Malaysia GDP – Composition of 2018, By Sector of Origin
Figure 116 Malaysia Export and Import Value & Volume, 2018-2019 ($)
Figure 117 Hong Kong European Bakery MarketHong Kong 3D Printing Market Value & Volume, 2021-2026 ($)
Figure 118 Hong Kong GDP and Population, 2018-2019 ($)
Figure 119 Hong Kong GDP – Composition of 2018, By Sector of Origin
Figure 120 Hong Kong Export and Import Value & Volume, 2018-2019 ($)
Figure 121 Middle East & Africa European Bakery MarketMiddle East & Africa 3D Printing Market Value & Volume, 2021-2026 ($)
Figure 122 Russia European Bakery MarketRussia 3D Printing Market Value & Volume, 2021-2026 ($)
Figure 123 Russia GDP and Population, 2018-2019 ($)
Figure 124 Russia GDP – Composition of 2018, By Sector of Origin
Figure 125 Russia Export and Import Value & Volume, 2018-2019 ($)
Figure 126 Israel European Bakery Market Value & Volume, 2021-2026 ($)
Figure 127 Israel GDP and Population, 2018-2019 ($)
Figure 128 Israel GDP – Composition of 2018, By Sector of Origin
Figure 129 Israel Export and Import Value & Volume, 2018-2019 ($)
Figure 130 Entropy Share, By Strategies, 2018-2019* (%)European Bakery Market
Figure 131 Developments, 2018-2019*European Bakery Market
Figure 132 Company 1 European Bakery Market Net Revenue, By Years, 2018-2019* ($)
Figure 133 Company 1 European Bakery Market Net Revenue Share, By Business segments, 2018 (%)
Figure 134 Company 1 European Bakery Market Net Sales Share, By European, 2018 (%)
Figure 135 Company 2 European Bakery Market Net Revenue, By Years, 2018-2019* ($)
Figure 136 Company 2 European Bakery Market Net Revenue Share, By Business segments, 2018 (%)
Figure 137 Company 2 European Bakery Market Net Sales Share, By European, 2018 (%)
Figure 138 Company 3European Bakery Market Net Revenue, By Years, 2018-2019* ($)
Figure 139 Company 3European Bakery Market Net Revenue Share, By Business segments, 2018 (%)
Figure 140 Company 3European Bakery Market Net Sales Share, By European, 2018 (%)
Figure 141 Company 4 European Bakery Market Net Revenue, By Years, 2018-2019* ($)
Figure 142 Company 4 European Bakery Market Net Revenue Share, By Business segments, 2018 (%)
Figure 143 Company 4 European Bakery Market Net Sales Share, By European, 2018 (%)
Figure 144 Company 5 European Bakery Market Net Revenue, By Years, 2018-2019* ($)
Figure 145 Company 5 European Bakery Market Net Revenue Share, By Business segments, 2018 (%)
Figure 146 Company 5 European Bakery Market Net Sales Share, By European, 2018 (%)
Figure 147 Company 6 European Bakery Market Net Revenue, By Years, 2018-2019* ($)
Figure 148 Company 6 European Bakery Market Net Revenue Share, By Business segments, 2018 (%)
Figure 149 Company 6 European Bakery Market Net Sales Share, By European, 2018 (%)
Figure 150 Company 7 European Bakery Market Net Revenue, By Years, 2018-2019* ($)
Figure 151 Company 7 European Bakery Market Net Revenue Share, By Business segments, 2018 (%)
Figure 152 Company 7 European Bakery Market Net Sales Share, By European, 2018 (%)
Figure 153 Company 8 European Bakery Market Net Revenue, By Years, 2018-2019* ($)
Figure 154 Company 8 European Bakery Market Net Revenue Share, By Business segments, 2018 (%)
Figure 155 Company 8 European Bakery Market Net Sales Share, By European, 2018 (%)
Figure 156 Company 9 European Bakery Market Net Revenue, By Years, 2018-2019* ($)
Figure 157 Company 9 European Bakery Market Net Revenue Share, By Business segments, 2018 (%)
Figure 158 Company 9 European Bakery Market Net Sales Share, By European, 2018 (%)
Figure 159 Company 10 European Bakery Market Net Revenue, By Years, 2018-2019* ($)
Figure 160 Company 10 European Bakery Market Net Revenue Share, By Business segments, 2018 (%)
Figure 161 Company 10 European Bakery Market Net Sales Share, By European, 2018 (%)
Figure 162 Company 11 European Bakery Market Net Revenue, By Years, 2018-2019* ($)
Figure 163 Company 11 European Bakery Market Net Revenue Share, By Business segments, 2018 (%)
Figure 164 Company 11 European Bakery Market Net Sales Share, By European, 2018 (%)
Figure 165 Company 12 European Bakery Market Net Revenue, By Years, 2018-2019* ($)
Figure 166 Company 12 European Bakery Market Net Revenue Share, By Business segments, 2018 (%)
Figure 167 Company 12 European Bakery Market Net Sales Share, By European, 2018 (%)
Figure 168 Company 13European Bakery Market Net Revenue, By Years, 2018-2019* ($)
Figure 169 Company 13European Bakery Market Net Revenue Share, By Business segments, 2018 (%)
Figure 170 Company 13European Bakery Market Net Sales Share, By European, 2018 (%)
Figure 171 Company 14 European Bakery Market Net Revenue, By Years, 2018-2019* ($)
Figure 172 Company 14 European Bakery Market Net Revenue Share, By Business segments, 2018 (%)
Figure 173 Company 14 European Bakery Market Net Sales Share, By European, 2018 (%)
Figure 174 Company 15 European Bakery Market Net Revenue, By Years, 2018-2019* ($)
Figure 175 Company 15 European Bakery Market Net Revenue Share, By Business segments, 2018 (%)
Figure 176 Company 15 European Bakery Market Net Sales Share, By European, 2018 (%)