 Email
Email Print
Print


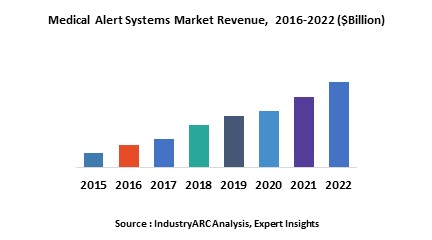
Medical Alert Systems Market - Forecast(2024 - 2030)
The global Medical Alert Systems Market is estimated to surpass $26.43 billion by 2023 growing at an estimated rate of more than 6.8% during 2018 to 2023. Nurse Call Systems witnessed as fast growing segment in the market with almost 60% share in 2017 globally. It is due to large scale implementation of nurse call systems across various healthcare facilities. Geographically, the rise in aging population and increased adoption of PERS devices by long term and senior facilities will facilitate the growth of PERS Market. In 2017, the global medical alerts system market was valued at $17.88 billion while $10.72 billion was generated from nurse call systems.
What is Medical Alert Systems Market?
Medical Alert System is a device which is used to signal the medical personnel during emergency. These devices encompass a wide range of medical devices such as Personal Emergency Response Systems (PERS), Nurse Call Systems (NCS), Ambulatory Auto Alert Systems, Automated Airborne Flight Alert Systems and others. This device increases the safety and security of the patients. It was primarily developed for senior citizens or the patients suffering from long-term disabilities. This device has additional safety features such as fire and smoke alert, carbon monoxide monitoring and others that help medical staff to understand the surrounding in order to face any situation.
According to the World Health Organization report, nearly 37.3 million are found falling owing to the health risk every year and these people require medical attention. Also, around 646,000 people die from falls across the globe each year. This trend is anticipated to continue and hence the need for medical alert systems is anticipated to grow further in near future.
There is a rise in integration of healthcare communication technologies including patient monitoring devices to personal communication devices such as smartphones and tablets. With technological advancements, the nursing staff and hospital administration have access to nurse call systems from remote mobile devices as well as office computers to get real time monitoring data from patients.
This report incorporates an in-depth assessment of medical alert systems market by type, end users and geography.
What are the major end users for Medical Alert Systems?
The various end users assessed include hospitals and clinics, home-based users, senior living facilities, assisted living facilities and others. Hospitals and assisted living facilities are the dominant end user segments which combinedly accounted for nearly 60% of the global medical alert systems market revenue. The growing hospital industry is will witness a proportionate rise in implementation of NCS across healthcare facilities. Furthermore, increase in number of emergency care facilities, clinics as well as specialty hospitals are anticipated to enhance the medical alert systems market. Rising healthcare costs is anticipated to increase the adoption of medical alert systems across various end users including hospitals and clinics, home-based users, senior living facilities, assisted living facilities and others.
Market Research and Market Trends of Medical Alert Systems Market
- TruSense has combined wireless sensors, Amazon’s Echo Dot, and GPS technology to track patients daily activities and health statistics, and send that data to family members and healthcare professionals. These smart sensors keep a track of the health statistics and indicate the shift in health statistics and send alerts to the healthcare professionals unlike conventional emergency response systems and hence brought revolution in the healthcare industry
- Technological advancement in fall detection devices and high frequent launch of these devices by manufacturers such as ActiveProtectiv, Kardian and others is anticipated to affect the growth of the medical alert systems market in near future
- In 2018, Samsung Electronics America and MobileHelp have entered into collaboration for integration of personal emergency response capabilities to Samsung Gear S3 smartwatches. Increasing number of collaborations by key players of medical alert devices is anticipated to provide prospects to the medical alert systems market in near future
- In 2018, companies such as ZTE, Qualcomm, and Wearsafe have partnered to integrate personal security tracking system to wearable devices. This partnership is anticipated to provide ample amount of opportunities in near future.
Who are the Major Players in Medical Alert Systems market?
The companies referred to in the market research report include Koninklijke Philips N.V., Rauland-Borg Corporation, Honeywell International, Ascom Wireless Solutions, ADT Corporation (US), Tunstall Healthcare Group Ltd., Valued Relationships, Inc., Medical Guardian LLC, Hill-Rom Holdings Inc., Jeron Electronic Systems Inc. and more than 20 companies.
What is our report scope?
The report incorporates in-depth assessment of the competitive landscape, product market sizing, product benchmarking, market trends, product developments, financial analysis, strategic analysis and so on to gauge the impact forces and potential opportunities of the market. Apart from this the report also includes a study of major developments in the market such as product launches, agreements, acquisitions, collaborations, mergers and so on to comprehend the prevailing market dynamics at present and its impact during the forecast period 2018-2023.
All our reports are customizable to your company needs to a certain extent, we do provide 20 free consulting hours along with purchase of each report, and this will allow you to request any additional data to customize the report to your needs.
Key Takeaways from this Report
- Evaluate market potential through analyzing growth rates (CAGR %), Volume (Units) and Value ($M) data given at country level – for product types, end use applications and by different industry verticals.
- Understand the different dynamics influencing the market – key driving factors, challenges and hidden opportunities.
- Get in-depth insights on your competitor performance – market shares, strategies, financial benchmarking, product benchmarking, SWOT and more.
- Analyze the sales and distribution channels across key geographies to improve top-line revenues.
- Understand the industry supply chain with a deep-dive on the value augmentation at each step, in order to optimize value and bring efficiencies in your processes.
- Get a quick outlook on the market entropy – M&A’s, deals, partnerships, product launches of all key players for the past 4 years.
- Evaluate the supply-demand gaps, import-export statistics and regulatory landscape for more than top 20 countries globally for the market.
For more Lifesciences and Healthcare related reports, please click here
1. Medical Alert Systems Market Overview
2. Executive Summary
3. Medical Alert Systems Market Landscape
3.1. Market Share Analysis
3.2. Comparative Analysis
3.2.1. Product Benchmarking
3.2.2. End User profiling
3.2.3. Patent Analysis
3.2.4. Top 5 Financials Analysis
4. Medical Alert Systems Market Forces
4.1. Market Drivers
4.1.1. Rise In Aging Population to Drive Medical Alert Systems Market
4.1.2. Booming Home Healthcare Market to Create Need For Affordable Monitoring Devices
4.1.3. Healthcare Reforms to Favor Growth of Medical Alert Systems Market
4.1.4. Usage of Smartphones to Drive The Medical Alert Systems Market
4.1.5. Constant Evolution of Healthcare Industry Leads to Innovations In The NCS Market
4.1.6. Stringent Government Regulations to Reorganize The NCS Industry
4.1.7. Technological Advancements And Ease of Access Drive Penetration of Medical Alert System
4.2. Market Constraints and Market Challenges
4.2.1. Limited Financial Resources In Elderly Population Will Impact The Adoption of PERS
4.2.2. Inhibitions About Using Medical Alert Systems
4.2.3. Regulatory Barriers For Nurse Call Systems
4.2.4. Limited Range of PERS
4.2.5. Lack of Infrastructure& Trained Resources
4.2.6. Increase In False Alarms Will Limit The Efficiency of Medical Alert Systems
4.2.7. High Cost of Newer Technologies
4.3. Attractiveness of the Industry
4.3.1. Power of Suppliers
4.3.2. Power of Customers
4.3.3. Threat of New entrants
4.3.4. Threat of Substitution
4.3.5. Degree of Competition
5. Medical Alert Systems Market – Government Regulations
5.1. Personal Emergency Response Systems – Government Regulations
5.1.1. North America
5.1.1.1. U.S.
5.1.1.2. Canada
5.1.1.3. Mexico
5.1.2. Europe
5.1.3. APAC
5.1.4. Rest of the World
5.2. Nurse Call Systems – Government Regulations
5.2.1. North America
5.2.2. Europe
5.2.3. APAC
5.2.4. Rest of the World
6. Medical Alert Systems Market – Strategic Analysis
6.1. Value Chain Analysis
6.1.1. Personal Emergency Response Systems
6.1.2. Nurse Call Systems
6.2. Pricing Analysis
6.2.1. Personal Emergency Response Systems
6.2.2. Nurse Call Systems
6.3. Opportunities Analysis
6.3.1. Personal Emergency Response Systems – Opportunity Analysis
6.3.1.1. Emerging Markets Are The Next Frontiers of The Growth
6.3.1.2. Prospective Customer Base to Create Potential Opportunities For The U.S. PERS Market
6.3.1.3. Standalone PERS Devices to Revolutionize The PERS Market
6.3.2. Nurse Call Systems – Opportunity Analysis
6.3.2.1. Emerging Regions Hold Abundant Growth Potential For NCS Market
6.3.2.2. Middleware Interfacing to Become The Future of The NCS
6.4. Product/Market Life Cycle Analysis
6.5. Suppliers and Distributors
6.5.1. Personal Emergency Response Systems
6.5.2. Nurse Call Systems
7. Medical Alert Systems Market Classification
7.1. Personal Emergency Response Systems Market – Classification
7.2. Nurse Call Systems Market – Classification
8. Medical Alert Systems Market - By Type
8.1. Personal Emergency Response Systems
8.1.1. Landline
8.1.2. Mobile
8.1.3. Standalone
8.2. Nurse Call Systems
8.2.1. Traditional
8.2.2. Advanced
8.2.3. Middleware Interfacing
9. Medical Alert Systems Market - By End User
9.1. Personal Emergency Response Systems
9.1.1. Home-Based Users
9.1.2. Assisted Living Facilities
9.1.3. Senior Living Facilities
9.2. Nurse Call Systems
9.2.1. Hospitals
9.2.2. Clinics
9.2.3. Assisted Living Facilities
9.2.4. Senior Living Facilities
10. Medical Alert Systems Market - By Geography
10.1. Introduction
10.2. North America
10.2.1. U.S
10.2.2. Canada
10.2.3. Mexico
10.3. Europe
10.3.1. U.K.
10.3.2. Germany
10.3.3. Italy
10.3.4. Spain
10.3.5. France
10.3.6. Rest of Europe
10.4. Asia-Pacific
10.4.1. China
10.4.2. Japan
10.4.3. India
10.4.4. Australia & New Zealand
10.4.5. Rest of APAC
10.5. RoW
10.5.1. South America
10.5.2. Middle East
10.5.3. Africa
11. Market Entropy
11.1. New Product Launches
11.2. M&As, Collaborations, JVs, Partnership
12. Company Profiles (Overview, Financials, SWOT Analysis, Developments, Product Portfolio)
12.1. Koninklijke Philips N.V.
12.2. Rauland-Borg Corporation
12.3. Honeywell International
12.4. Ascom Wireless Solutions
12.5. ADT Corporation (US)
12.6. Tunstall Healthcare Group Ltd.
12.7. Valued Relationships, Inc.
12.8. Medical Guardian LLC
12.9. Hill-Rom Holdings Inc.
12.10. Jeron Electronic Systems Inc.
12.11. Company 11.
12.12. Company 12.
12.13. Company 13.
12.14. Company 14.
12.15. Company 15.
*More than 10 Companies are profiled in this Research Report*
"*Financials would be provided on a best efforts basis for private companies"
13. Appendix
13.1. Abbreviations
13.2. Sources
13.3. Research Methodology
13.4. Bibliography
13.5. Compilation of Expert Insights
13.6. Disclaimer
LIST OF TABLES
Table 1. Global NCS Market Revenue, By Key Players, 2013 ($Million).
Table 2. Product Benchmarking For PERS Market – By Products And Pricing ($).
Table 3. Product Benchmarking For Nurse Call Systems Market – By Product Types And Technology.
Table 4. Top Five Financial Analysis For NCR Market.
Table 5. Global Population Above 65 Years Of Age (Millions).
Table 6. U.S. Population Over 65 Years (Millions) And Dependency Ratio (%), 2013-2050.
Table 7. Global PERS Market Pricing Analysis, By Major Not-For-Profit Organizations ($).
Table 8. Global Medical Alert Systems Market Revenue, By Geography, 2013-2020 ($Million).
Table 9. Global Medical Alert Systems Market Volume, By Geography, 2013-2020 (Million Units).
Table 10. Global Medical Alert Systems Market Revenue, By Type, 2013-2020 ($Million).
Table 11. Global Medical Alert Systems Market Volume, By Type, 2013-2020 ($Million).
Table 12. Global Personal Emergency Response Systems Market Revenue, By Type, 2013-2020 ($Million).
Table 13. Global Personal Emergency Response Systems Market Volume, By Type, 2013-2020 (Million Units).
Table 14. Landline-Based Personal Emergency Response Systems Market Volume, By Type, 2013-2020 (Million Units).
Table 15. Mobile Personal Emergency Response Systems Market Revenue, By Type, 2013-2020 ($Million).
Table 16. Mobile Personal Emergency Response Systems Volume, By Type, 2013-2020 (Million Units).
Table 17. Standalone Personal Emergency Response Systems Market Revenue, By Type, 2013-2020 ($Million).
Table 18. Standalone Personal Emergency Response Systems Market Volume, By Type, 2013-2020 (Million Units).
Table 19. Global Personal Emergency Response Systems Market Revenue, By End-User, 2013-2020 ($Million).
Table 20. Global Personal Emergency Response Systems Market Volume, By End-User, 2013-2020 (Million Units).
Table 21. Medical Alert Systems Market Revenue, Home-Based Users, By Geography, 2013-2020 ($Million).
Table 22. Personal Emergency Response Systems Market Volume, Home-Based Users, By Geography, 2013-2020 (Million Units).
Table 23. Personal Emergency Response Systems Market Revenue, Senior Living Facilities, By Geography, 2013-2020 ($Million).
Table 24. Personal Emergency Response Systems Market Volume, Senior Living Facilities, By Geography, 2013-2020 (Million Units).
Table 25. Personal Emergency Response Systems Market Revenue, Assisted Living Facilities, By Geography, 2013-2020 ($Million).
Table 26. Personal Emergency Response Systems Market Volume, Assisted Living Facilities, By Geography, 2013-2020 (Million Units).
Table 27. Global Personal Emergency Response Systems Market Revenue, By Geography, 2013-2020 ($Million).
Table 28. North America Personal Emergency Response Systems Market Revenue, By Geography, 2013-2020 ($Million).
Table 29. North America Personal Emergency Response Systems Market Revenue, By Type of NCS, 2013-2020 ($Million).
Table 30. North America - Personal Emergency Response Systems Market Volume, By Type of NCS, 2013-2020 (Million Units).
Table 31. North America - Personal Emergency Response Systems Market Revenue, By End-Users, 2013-2020 ($Million).
Table 32. North America - Personal Emergency Response Systems Market Volume, By End-Users, 2013-2020 (Million Units).
Table 33. U.S.: Personal Emergency Response Systems Market Revenue, 2013-2020 ($Million).
Table 34. Canada: Personal Emergency Response Systems Market Revenue, , 2013-2020 ($Million).
Table 35. Mexico: Personal Emergency Response Systems Market Revenue, , 2013-2020 ($Million).
Table 36. Europe Personal Emergency Response Systems Market Revenue, By Country, 2013-2020 ($Million).
Table 37. Europe - Personal Emergency Response Systems Market Revenue, By Type Of NCS, 2013-2020 ($Million).
Table 38. Europe - Personal Emergency Response Systems Market Volume, By Type Of PERS, 2013-2020 (Million Units).
Table 39. Europe - Personal Emergency Response Systems Market Revenue, By End-Users, 2013-2020 ($Million).
Table 40. Europe - Personal Emergency Response Systems Market Volume, By End-Users, 2013-2020 (Million Units).
Table 41. U.K. Personal Emergency Response Systems Market Revenue, 2013-2020 ($Million).
Table 42. Germany Personal Emergency Response Systems Market Revenue, By Geography, 2013-2020 ($Million).
Table 43. France Personal Emergency Response Systems Market Revenue, 2013-2020 ($Million).
Table 44. Italy Personal Emergency Response Systems Market Revenue, By Geography, 2013-2020 ($Million).
Table 45. Spain Personal Emergency Response Systems Market Revenue, 2013-2020 ($Million).
Table 46. Others: Personal Emergency Response Systems Market Revenue, 2013-2020 ($Million).
Table 47. Asia-Pacific Personal Emergency Response Systems Market Revenue, By Geography, 2013-2020 ($Million).
Table 48. Table 48.. Asia-Pacific - Personal Emergency Response Systems Market Revenue, By Type Of NCS, 2013-2020 ($Million).
Table 49. Asia-Pacific - Personal Emergency Response Systems Market Volume, By Type Of NCS, 2013-2020 (Million Units).
Table 50. Asia-Pacific - Personal Emergency Response Systems Market Revenue, By End-Users, 2013-2020 ($Million).
Table 51. Asia-Pacific - Personal Emergency Response Systems Market Volume, By End-Users, 2013-2020 (Million Units).
Table 52. China Personal Emergency Response Systems Market Revenue, By Geography, 2013-2020 ($Million).
Table 53. Australia Personal Emergency Response Systems Market Revenue, 2013-2020 ($Million).
Table 54. Japan Personal Emergency Response Systems Market Revenue, , 2013-2020 ($Million).
Table 55. New Zealand Personal Emergency Response Systems Market Revenue, 2013-2020 ($Million).
Table 56. India Medical Alert Systems Market Revenue, By Geography, 2013-2020 ($Million).
Table 57. Others Personal Emergency Response Systems Market Revenue, By Geography, 2013-2020 ($Million).
Table 58. Rest Of The World - Personal Emergency Response Systems Market Revenue, By Geography, 2013-2020 ($Million).
Table 59. Rest Of The World - Personal Emergency Response Systems Market Revenue, By Type of NCS, 2013-2020 ($Million).
Table 60. Rest Of THE World - Personal Emergency Response Systems Market Volume, By Type of Ncs, 2013-2020 (Million Units).
Table 61. Rest Of The World - Personal Emergency Response Systems Market Revenue, By End-User, 2013-2020 ($Million).
Table 62. Rest Of The World - Personal Emergency Response Systems Market Volume, By End-User, 2013-2020 (Million Units).
Table 63. Brazil Personal Emergency Response Systems Market Revenue,, 2013-2020 ($Million).
Table 64. Saudi Arabia - Personal Emergency Response Systems Market Revenue, By Geography, 2013-2020 ($Million).
Table 65. South Africa: Personal Emergency Response Systems Market Revenue, 2013-2020 ($Million).
Table 66. Russia: Personal Emergency Response Systems Market Revenue, 2013-2020 ($Million).
Table 67. Others: Personal Emergency Response Systems Market Revenue, , 2013-2020 ($Million).
Table 68. Global Medical Alert Systems Market Revenue, By Type, 2013-2020 ($Million).
Table 69. Global Nurse Call Systems Market Volume, By Type, 2013-2020 (Million Units).
Table 70. Traditional Nurse Call Systems Market Revenue, By Geography, 2013-2020 ($Million).
Table 71. Traditional Nurse Call Systems Market Volume, By Geography, 2013-2020 (Million Units).
Table 72. Advanced Nurse Communication Systems Market Revenue, By Geography, 2013-2020 ($Million).
Table 73. Global Advanced Nurse Communication Systems Market Volume, By Geography, 2013-2020 (Million Units).
Table 74. Middleware Interfacingnurse Call Systems Market Revenue, By Type, 2013-2020 ($Million).
Table 75. Middleware Interfacing Nurse Call Systems Market Volume, By Type, 2013-2020 (Million Units).
Table 76. Global Nurse Call Systems market, By End-Users, 2013 (%).
Table 77. Global Nurse Call Systems Market Revenue, By End-User, 2013-2020 ($Million).
Table 78. Global Nurse Call Systems Market Volume, By End-User, 2013-2020 (Million Units).
Table 79. Nurse Call Systems Market Revenue, Hospitals And Clinics, By Geography, 2013-2020 ($Million).
Table 80. Medical Alert Systems Market volume, Hospitals And Clinics, By Geography, 2013-2020 (Million Units).
Table 81. Nurse Call Systems Market Revenue, Senior Living Facilities, By Geography, 2013-2020 ($Million).
Table 82. Nurse Call Systems Market Volume, Senior Living Facilities, By Geography, 2013-2020 (Million Units).
Table 83. Nurse Call Systems Market Revenue, Assisted Living Facilities, By Geography, 2013-2020 ($Million).
Table 84. Table 84.. Nurse Call Systems Market Volume, Assisted Living Facilities, By Geography, 2013-2020 (Million Units).
Table 85. Global Nurse Call Systems Market Revenue, By Geography, 2013-2020 ($Million).
Table 86. North America Nurse Call Systems Market Revenue, By Geography, 2013-2020 ($Million).
Table 87. North America - Nurse Call Systems Market Revenue, By Type Of NCS, 2013-2020 ($Million).
Table 88. North America - Nurse Call Systems Market Volume, By Type Of NCS, 2013-2020 (Million Units).
Table 89. North America - Nurse Call Systems Market Revenue, By End-Users, 2013-2020 ($Million).
Table 90. North America - Nurse Call Systems Market Volume, By End-Users, 2013-2020 (Million Units).
Table 91. U.S. Nurse Call Systems Market Revenue, By Geography, 2013-2020 ($Million).
Table 92. Canada Nurse Call Systems Market Revenue, By Geography, 2013-2020 ($Million).
Table 93. Mexico Nurse Call Systems Market Revenue, By Geography, 2013-2020 ($Million).
Table 94. Europe Nurse Call Systems Market Revenue, By Country, 2013-2020 ($Million).
Table 95. Europe - Nurse Call Systems Market Revenue, By Type of NCS, 2013-2020 ($Million).
Table 96. Europe - Nurse Call Systems Market Volume, By Type of NCS, 2013-2020 (Million Units).
Table 97. Europe - Nurse Call Systems Market Revenue, By End-Users, 2013-2020 ($Million).
Table 98. Europe - Nurse Call Systems Market Volume, By End-Users, 2013-2020 (Million Units).
Table 99. U.K. Nurse Call Systems Market Revenue, 2013-2020 ($Million).
Table 100. Germany Nurse Call Systems Market Revenue, 2013-2020 ($Million).
Table 101. France Nurse Call Systems Market Revenue, , 2013-2020 ($Million).
Table 102. Italy Nurse Call Systems Market Revenue, 2013-2020 ($Million).
Table 103. Spain Nurse Call Systems Market Revenue, 2013-2020 ($Million).
Table 104. Asia-Pacific Nurse Call Systems Market Revenue, By Country, 2013-2020 ($Million).
Table 105. Asia-Pacific - Nurse Call Systems Market Revenue, By Type of NCS, 2013-2020 ($Million).
Table 106. Asia-Pacific - Nurse Call Systems Market Volume, By Type of NCS, 2013-2020 (Million Units).
Table 107. Asia-Pacific - Nurse Call Systems Market Revenue, By End-Users, 2013-2020 ($Million).
Table 108. Asia-Pacific - Nurse Call Systems Market Volume, By End-Users, 2013-2020 (Million Units).
Table 109. China Nurse Call Systems Market Revenue, 2013-2020 ($Million).
Table 110. Australia Nurse Call Systems Market Revenue, , 2013-2020 ($Million).
Table 111. Japan Nurse Call Systems Market Revenue, 2013-2020 ($Million).
Table 112. India Nurse Call Systems Market Revenue, 2013-2020 ($Million).
Table 113. New Zealand Nurse Call Systems Market Revenue, 2013-2020 ($Million).
Table 114. South Korea Nurse Call Systems Market Revenue, 2013-2020 ($Million).
Table 115. Others Nurse Call Systems Market Revenue, 2013-2020 ($Million).
Table 116. Rest of The World - Nurse Call Systems Market Revenue, By Country, 2013-2020 ($Million).
Table 117. Rest of The World - Nurse Call Systems Market Revenue, By Type Of NCS, 2013-2020 ($Million).
Table 118. Table 118.. Rest Of The World - Nurse Call Systems Market Volume, By Type of NCS, 2013-2020 (Million Units).
Table 119. Rest of The World - Nurse Call Systems Market Revenue, By End-User, 2013-2020 ($Million).
Table 120. Rest of The World - Nurse Call Systems Market Volume, By End-User, 2013-2020 (Million Units).
Table 121. Brazil Nurse Call Systems Market Revenue, 2013-2020 ($Million).
Table 122. Saudi Arabia Nurse Call Systems Market Revenue, 2013-2020 ($Million).
Table 123. South Africa Nurse Call Systems Market Revenue, 2013-2020 ($Million).
Table 124. Russia Nurse Call Systems Market Revenue, 2013-2020 ($Million).
Table 125. Others Nurse Call Systems Market Revenue, 2013-2020 ($Million).
Table 126. Philips: Total Annual Sales, 2010-12 ($ Billion).
Table 127. Philips Total Annual Sales By Sector, 2010-12 ($ Billion).
Table 128. Philips Annual Sales Of R&D By Sector, 2010-12 ($Million).
Table 129. Philips Total Annual Sales As Per Geography In Healthcare Sector, 2010-12 ($ Billion).
Table 130. ASCOM Holding Ag – Wireless Solutions Segment - Revenue, 2012 - 2013 ($Million).
Table 131. Honey Well, Inc. Total Revenue, 2012-2013 ($Million).
Table 132. Honey Well -Total Revenue, By Geography, 2012-2013 ($Million).
Table 133. Siemens Ag - Total Revenue, 2012-2013 ($Million).
Table 134. Siemens Ag - Total Revenue, By Business Segment, 2013 ($Million).
Table 135. Stanley Health Care Solution - Total Revenue, 2012-2013 ($Million).
Table 136. Stanley Health Care Solution - Total Revenue, By Geography, 2012-2013 ($Million).
Table 137. GE Health Care Solution - Total Revenue, 2012-2013 ($Million).
Table 138. GE Health Care Solution - Total Revenue, By Geography, 2013-2012 ($Million).
LIST OF FIGURES
Figure1. Global PERS Market Revenue, By Geography, 2013 (%).
Figure2. Global Nurse Call Systems Revenue, 2013-2020 ($Billion).
Figure3. Global Nurse Call Systems Market Analysis, By Company, 2013 (%).
Figure4. Medical Alert Systems Market Classification, By Type of Device.
Figure5. Personal Emergency Response Systems (PERS) Market, Classification, By Type of System.
Figure6. Personal Emergency Response Systems (PERS) Market Classification, By End-User.
Figure7. Nurse Call Systems Market Classification, By Type of System.
Figure8. Nurse Call Systems Market Classification, By End-User.
Figure9. Global PERS Market Share Analysis, 2013 (%).
Figure10. Global Nurse Call Systems Market Share Analysis, 2013 (%).
Figure11. Personal Emergency Response Systems - Patent Analysis, 2011-2014.
Figure12. Personal Emergency Response Systems - Patent Analysis, By Companies, 2012-2014.
Figure13. Nurse Call Systems - Patent Analysis, 2011-2014.
Figure14. Nurse Call Systems - Patent Analysis, By Companies, 2012-2014.
Figure15. Number of Senior Citizens Using Mobile Phones and Internet, U.S., 2013 (%).
Figure16. Personal Emergency Response Systems - Value Chain Analysis.
Figure17. Global Nurse Call Systems Market - Value Chain Analysis.
Figure18. Global PERS Market Average Selling Price Analysis, By Type of System, 2013-2020 ($).
Figure19. Global NCS Market Average Selling Price Analysis, By Type of System, 2013-2020 ($).
Figure20. Global Medical Alert Systems Market, Product/Market Lifecycle Analysis.
Figure21. Global Medical Alert Systems Market, By Geography, 2013 (%).
Figure22. Global personal Emergency Response Systems Market, By Type, 2013 (%).
Figure23. Globallandline-Based PERS Market, By Geography, 2013 (%).
Figure24. Landline-Based Personal Emergency Response Systems Market Revenue, By Type, 2013-2020 ($Million).
Figure25. Global mobile PERS Market, By Geography, 2013 (%).
Figure26. Global Standalone PERS Market, By Geography, 2013 (%).
Figure27. Global Personal Emergency Response Systems Market, By End-User, 2013 (%).
Figure28. Global Personal Emergency Response systems Market, By Geography, 2013 (%).
Figure29. North America PERS Market, By Country, 2013 (%).
Figure30. Europe PERS market, By Country, 2013 (%).
Figure31. Asia-Pacific Personal Emergency Response Systems Market, By Country, 2013 (%).
Figure32. Row Personal Emergency Response Systems Market, By Country, 2013 (%).
Figure33. Global Nurse Call Systems Market, By Type, 2013 (%).
Figure34. Global Nurse Call Systems Market, By Geography, 2013 (%).
Figure35. North America Nurse Call Systems market, By Country, 2013 (%).
Figure36. Europe Nurse Call Systems market, By Country, 2013 (%).
Figure37. Asia-Pacific Nurse Call Systems Market, By Country, 2013 (%).
Figure38. Row Nurse Call Systems Market, By Country, 2013 (%).
Figure39. Global PERS Market, By Type of Development, 2012-2014.
Figure40. Global PERS Market Development, By Key Manufacturers, 2013.
Figure41. Global Nurse Call Systems Market – Product Launches (2011-2014).
Figure42. Global Nurse Call Systems Market, By Type of Development, 2012-2014.
Figure43. Global Nurse Call Systems Market – M&A's, Collaborations, JV'S & Partnerships, By Number of Developments, 2012 – 2014.
Figure44. Global Nurse Call Systems Market, By Number Of Product Launches 2012-2014.
Figure45. Global Nurse Call Systems Market, By Product Launches, By Key Manufacturers, 2012 – 2014.
Figure46. Carelineuk Net Revenue in the U.K., By Region, 2013 (%).
Figure47. Ascom Holding AG Total Revenue, By Geography, 2013 (%).
Figure48. Ascom Holding AG Total Revenue, By Business Segment, 2013 (%).
Figure49. Honeywell Total Revenue, By Business Segments, 2012-2013 (%).
Figure50. Siemens AG –Healthcare Segment Revenue, By Geography, 2012-2013 ($Million).