Aerospace Foam Market - Forecast(2024 - 2030)

Report Code: CMR 0191 Report Format: PDF + Excel

Aerospace Foam Market Overview

The Aerospace Foam Market size is estimated to reach US$7.5 billion by 2027, after growing at a CAGR of 6.5% during the forecast period 2022-2027. Aerospace foam is a cellular structured material utilized in the aerospace industry, due to its low-density characteristic. Aerospace foam such as polyurethane foam, polyethylene foam, ceramic foam, metal foam and others are extensively used for insulation, cushioning and vibration dampeners. The growing aviation sector is driving the aerospace foam market growth, to be utilized in the manufacture of aircraft seats, aircraft floor carpets, cabin walls and ceilings, flight deck pads, overhead stow bins and other applications. Moreover, the increasing requirement for the aerospace foam to meet the growing demand for lightweight and fuel-efficient aircraft is anticipated to upsurge the growth of the aerospace foam industry during the forecast period. 

Aerospace Foam Market Report Coverage

The “Aerospace Foam Market Report – Forecast (2022 - 2027)” by IndustryARC, covers an in-depth analysis of the following segments in the aerospace foam industry.

By Type: Polyurethane Foam, Polyethylene Foam, Ceramic Foam, Metal Foam, Melamine Foam, Polyethylene Terephthalate Foam, Polyvinyl Chloride Foam, Specialty High-Performance Foam and Others.
By Application: Aircraft Seats, Aircraft Floor Carpets, Cabin Walls and Ceilings, Flight Deck Pads, Overhead Stow Bins and Others.
By End-use Industry: Commercial Aircrafts, Military Aircrafts, Helicopters and Others.
By Geography: North America, Europe, Asia-Pacific, South America and the Rest of the World.

Key Takeaways

  • The North America region dominates the Aerospace Foam market owing to the rising growth in the aerospace industry. For instance, according to the government of Canada and its international independent subject matter experts, global aerospace defense revenues are projected to grow by over 45% from 2021-2025.
  • Rapidly rising demand for lightweight and fuel-efficient aircraft has driven the growth of the aerospace foam market.
  • The increasing demand for Aerospace Foam in the aerospace sector, due to its usage in the manufacture of aircraft seats, aircraft floor carpets, cabin walls and ceilings, flight deck pads, overhead stow bins and other applications, has been a critical factor driving the growth of the aerospace foam market in the upcoming years.

Figure: Aerospace Foam Market Revenue Share by Geography, 2021 (%)

Aerospace Foam Market
For More Details on This Report - Request for Sample

Aerospace Foam Market Segment Analysis – by End-use Industry

The commercial aircraft segment held the largest Aerospace Foam Market share in 2021 and is estimated to grow at a CAGR of 6.9% during the forecast period 2022-2027. The rising number of air passengers globally is boosting the growth of commercial aircraft. The surge in low-cost operators has resulted in an increase in demand for the commercial aircraft sector. The commercial aircraft sector is growing, for instance, according to the Indian Brand Equity Foundation (IBEF), domestic air travel demand continued an upward trend in October 2020, with a 33% increase to 52 lakh passengers. In June 2020, the Ministry of Civil Aviation approved a capacity increase of 45% from one-third and it further increased to 60% from September 2020. Moreover, according to the French government, the government invested in a €100 billion (US$102.3 billion) recovery program for the country’s economy. Among the planned investments, the authorities envision a hydrogen-powered “green plane” in the next fifteen years. Additionally, in April 2022, German air traffic was up 499.1 percent compared to April 2021 and domestic air traffic was up 372.7 percent from 2021. Thus, with an increase in air traffic, the commercial aircrafts segment will rise, which will boost the market growth of aerospace foam in the forecast period.

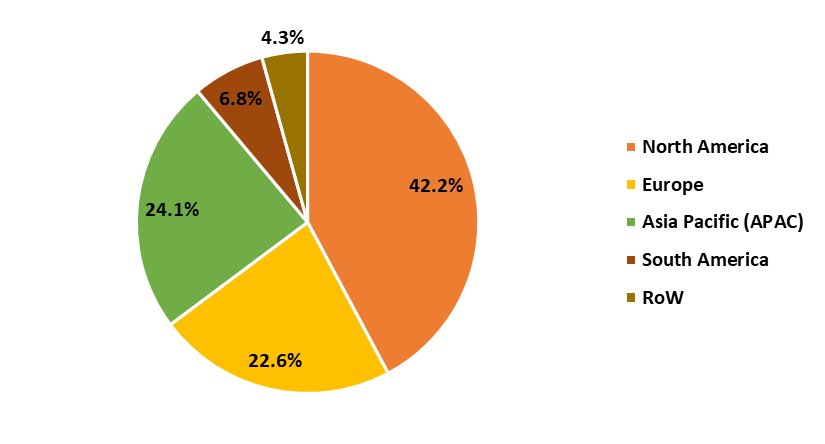
Aerospace Foam Market Segment Analysis – by Geography

The North-American region held the largest Aerospace Foam market share in 2021 up to 39%, due to the rising aerospace industry. The rising growth of the end-use industry of aerospace foam has uplifted the growth of the aerospace foam market since it is extensively being utilized in sectors such as general, military and defense aviation. The aerospace industry is growing, for instance, in 2021, the Government of Quebec and the Government of Canada, funded US$2 billion in the aerospace industry to drive the recovery of the sector. Moreover, according to the International Trade Administration (ITA), the total local production of aircraft and related products and services stood at US$1 billion in 2021 and the Mexican Aerospace Industry Federation (Federación Mexicana de la Industria Aerospacial or FEMIA), experienced 14 percent average annual export growth from 2004–2019. It was responsible for producing more than 63,000 jobs and accounted for up to US$6 billion in accumulated direct foreign investment. Thus, the increasing investments in the aerospace industry are proving to be a market booster for the aerospace foam market size in this region.

Aerospace Foam Market Drivers

Surge in the Demand for Lightweight and Fuel-Efficient Aircraft:

The carbon emissions per kilometer can be reduced by using less weighted aircraft for conventionally powered aircraft. With the imposition of stringent emission regulations by the government and its plan to regulate higher emissions standards in the years to come, lightweight construction is gaining importance each day. Typically, aircrafts utilizing aerospace foams for various applications are contributing to reduced weight. Therefore, the demand for lightweight aircraft is increasing rapidly, which in turn is increasing the demand for aerospace foams. Also, to obtain a 6 to 8 percent improvement in fuel economy, 10% of the vehicular weight must be reduced, according to the U.S. Department of Energy Vehicle Technology Office. Moreover, to reduce fuel burn, the aircraft design must be more efficient. It should move through the air easily, utilize electricity to power the propulsion system and ought to be lightweight as is safely practical. For instance, according to the National Renewable Energy Laboratory, electric and hybrid-electric aircraft are projected to operate at 85%–90% efficiency and to be 20%–40% more efficient than piston and turbine aircraft. 

Growth in Aerospace Industry:

In the aerospace industry, aircraft foams such as polyurethane foam, polyethylene foam, ceramic foam, metal foam and others are applied in aircraft seats, aircraft floor carpets, cabin walls and ceilings, flight deck pads, overhead stow bins and other applications. The aerospace industry is growing, for instance, according to the Indian Brand Equity Foundation (IBEF), the Indian aerospace & defence (A&D) market is projected to reach US$70 billion by 2030, driven by the burgeoning demand for advanced infrastructure and government thrust. Moreover, in 2021, according to the International Trade Administration (ITA), the Dutch Government has increased its investments in the aerospace industry, investing €1.5 billion (US$1.57 billion) over the next five years, with a one-time increase of €1.2 billion (US$1.26 billion) in 2019 and an annual increase of €162 million (US$170 million) in the following years. Thus, increasing investments in the aerospace industry will require more aerospace foams for manufacturing aircraft parts, which will drive the demand for the aerospace foam market during the forecast period.

Aerospace Foam Market Challenges

Fluctuation in Raw Material Production and Costs:

Increment in the cost of basic raw materials, high global demand and reduced supply make aerospace foams more expensive. The aerospace foam industry, which provides an advantage in various aerospace applications, is concerned about the substantial increase in the cost of basic raw materials. Demand and supply factors varying from one raw material to another affect the cost of aerospace foams such as polyurethane foam, polyethylene foam, ceramic foam, metal foam and others. It becomes difficult for manufacturers to sustain themselves globally, due to the fluctuations in raw material prices, affecting their operating margins on aerospace foam. For instance, according to Delta Trade, polyurethane foam prices increased by 20% and have become more expensive from October 2020 and the next increases were already announced. Polyurethane foam is getting costlier due to the disruptions in the production of toluene diisocyanates (TDI) and polyols as raw materials, which are the main ingredients of the foam. Thus, the fluctuations in raw material production and costs of aerospace foams will create hurdles for the growth of the aerospace foam market.

Aerospace Foam Industry Outlook

The top 10 companies in the aerospace foam market are:

  1. BASF SE
  2. Huntsman Corporation
  3. Armacell
  4. Boyd Corporation
  5. Evonik Industries
  6. Sabic
  7. Rogers Corporation
  8. Zotefoams Plc
  9. General Plastics Manufacturing Company
  10. ERG Materials

Recent Developments

  • In July 2022, SABIC launched a specialized portfolio of SABIC PP compounds for foam injection molding (FIM). New mineral-reinforced SABIC PPC F9005, PPC F9007 and PPC F9015 grades can help deliver excellent aesthetics for visible aircraft interior parts with complex geometries, such as door panels and trim, seat and trunk cladding, A/B/C/D pillar covers and center consoles.
  • In November 2019, Evonik Corporation expanded its production of ROHACELL high-performance rigid, closed-cell foams at its Mobile, Ala., site, due to increasing demand for lightweight construction materials for specialty applications.
  • In March 2019, Zotefoams Plc’s ZOTEK F was selected as the material of choice by Thompson Aero Seating, a leading supplier of premium aircraft seating, as the lightweight, fire-resistant solution for its new high-tech seating range, as it offered a 1.6kg reduction in weight per seat.

Relevant Reports

Polymer Foam Market – Industry Analysis, Market Size, Share, Trends, Application Analysis, Growth and Forecast Analysis

Report Code: CMR 0093

Engineered Foam Market - Industry Analysis, Market Size, Share, Trends, Application Analysis, Growth and Forecast Analysis

Report Code: CMR 0641

PET Foam Market – Industry Analysis, Market Size, Share, Trends, Application Analysis, Growth and Forecast Analysis

Report Code: CMR 0482

For more Chemicals and Materials Market reports, please click here

1. Aerospace Foam Market - Market Overview
    1.1 Definitions and Scope
2. Aerospace Foam Market - Executive Summary
    2.1 Key Trends by Type
    2.2 Key Trends by Application
    2.3 Key Trends by End-use Industry
    2.4 Key Trends by Geography
3. Aerospace Foam Market – Comparative analysis
    3.1 Market Share Analysis - Major Companies
    3.2 Product Benchmarking - Major Companies
    3.3 Top 5 Financials Analysis
    3.4 Patent Analysis - Major Companies
    3.5 Pricing Analysis (ASPs will be provided)
4. Aerospace Foam Market - Startup Companies Scenario Premium
    4.1 Major startup company analysis:
        4.1.1 Investment
        4.1.2 Revenue
        4.1.3 Product portfolio
        4.1.4 Venture Capital and Funding Scenario
5. Aerospace Foam Market – Industry Market Entry Scenario Premium Premium
    5.1 Regulatory Framework Overview
    5.2 New Business and Ease of Doing Business Index
    5.3 Successful Venture Profiles
    5.4 Customer Analysis – Major companies
6. Aerospace Foam Market - Market Forces
    6.1 Market Drivers
    6.2 Market Constraints
    6.3 Porter's Five Force Model
        6.3.1 Bargaining Power of Suppliers
        6.3.2 Bargaining Powers of Buyers
        6.3.3 Threat of New Entrants
        6.3.4 Competitive Rivalry
        6.3.5 Threat of Substitutes
7. Aerospace Foam Market – Strategic Analysis
    7.1 Value/Supply Chain Analysis
    7.2 Opportunity Analysis
    7.3 Product/Market Life Cycle
    7.4 Distributor Analysis – Major Companies
8. Aerospace Foam Market – by Type (Market Size - US$ Million/Billion)
    8.1 Polyurethane Foam
    8.2 Polyethylene Foam
    8.3 Ceramic Foam
    8.4 Metal Foam
    8.5 Melamine Foam
    8.6 Polyethylene Terephthalate Foam
    8.7 Polyvinyl Chloride Foam
    8.8 Specialty High-Performance Foam
    8.9 Others
9. Aerospace Foam Market - by Application (Market Size - US$ Million/Billion)
    9.1 Aircraft Seats
    9.2 Aircraft Floor Carpets
    9.3 Cabin Walls and Ceilings
    9.4 Flight Deck Pads
    9.5 Overhead Stow Bins
    9.6 Others
10. Aerospace Foam Market - by End-use Industry (Market Size - US$ Million/Billion)
    10.1 Commercial Aircrafts
    10.2 Military Aircrafts
    10.3 Helicopters
    10.4 Others
11. Aerospace Foam Market - by Geography (Market Size - US$ Million/Billion)
    11.1 North America
        11.1.1 the USA
        11.1.2 Canada
        11.1.3 Mexico
    11.2 Europe
        11.2.1 the UK
        11.2.2 Germany
        11.2.3 France
        11.2.4 Italy
        11.2.5 the Netherlands
        11.2.6 Spain
        11.2.7 Belgium
        11.2.8 Rest of Europe
    11.3 Asia-Pacific
        11.3.1 China
        11.3.2 Japan
        11.3.3 India
        11.3.4 South Korea
        11.3.5 Australia and New Zeeland
        11.3.6 Indonesia
        11.3.7 Taiwan
        11.3.8 Malaysia
        11.3.9 Rest of APAC
    11.4 South America
        11.4.1 Brazil
        11.4.2 Argentina
        11.4.3 Colombia
        11.4.4 Chile
        11.4.5 Rest of South America
    11.5 Rest of the World
        11.5.1 the Middle East
            11.5.1.1 Saudi Arabia
            11.5.1.2 UAE
            11.5.1.3 Israel
            11.5.1.4 Rest of the Middle East
        11.5.2 Africa
            11.5.2.1 South Africa
            11.5.2.2 Nigeria
            11.5.2.3 Rest of Africa
12. Aerospace Foam Market – Entropy
    12.1 New Product Launches
    12.2 M&As, Collaborations, JVs and Partnerships
13. Aerospace Foam Market – Industry/Segment Competition Landscape Premium
    13.1 Company Benchmarking Matrix – Major Companies
    13.2 Market Share at Global Level - Major companies
    13.3 Market Share at Country Level - Major companies
    13.4 Market Share by Key Geography - Major companies
    13.5 Market Share by Key Application - Major companies
    13.6 Market Share by Key Product - Major companies
14. Aerospace Foam Market – Key Company List by Country Premium Premium
15. Aerospace Foam Market Company Analysis - Business Overview, Product Portfolio, Financials and Developments
    15.1 Company 1
    15.2 Company 2
    15.3 Company 3
    15.4 Company 4
    15.5 Company 5
    15.6 Company 6
    15.7 Company 7
    15.8 Company 8
    15.9 Company 9
    15.10 Company 10 and more
* "Financials would be provided to private companies on best-efforts basis."
Connect with our experts to get customized reports that best suit your requirements. Our reports include global-level data, niche markets and competitive landscape.
List of Tables:
Table 1: Aerospace Foam Market Overview 2021-2026
Table 2: Aerospace Foam Market Leader Analysis 2018-2019 (US$)
Table 3: Aerospace Foam Market Product Analysis 2018-2019 (US$)
Table 4: Aerospace Foam Market End User Analysis 2018-2019 (US$)
Table 5: Aerospace Foam Market Patent Analysis 2013-2018* (US$)
Table 6: Aerospace Foam Market Financial Analysis 2018-2019 (US$)
Table 7: Aerospace Foam Market Driver Analysis 2018-2019 (US$)
Table 8: Aerospace Foam Market Challenges Analysis 2018-2019 (US$)
Table 9: Aerospace Foam Market Constraint Analysis 2018-2019 (US$)
Table 10: Aerospace Foam Market Supplier Bargaining Power Analysis 2018-2019 (US$)
Table 11: Aerospace Foam Market Buyer Bargaining Power Analysis 2018-2019 (US$)
Table 12: Aerospace Foam Market Threat of Substitutes Analysis 2018-2019 (US$)
Table 13: Aerospace Foam Market Threat of New Entrants Analysis 2018-2019 (US$)
Table 14: Aerospace Foam Market Degree of Competition Analysis 2018-2019 (US$)
Table 15: Aerospace Foam Market Value Chain Analysis 2018-2019 (US$)
Table 16: Aerospace Foam Market Pricing Analysis 2021-2026 (US$)
Table 17: Aerospace Foam Market Opportunities Analysis 2021-2026 (US$)
Table 18: Aerospace Foam Market Product Life Cycle Analysis 2021-2026 (US$)
Table 19: Aerospace Foam Market Supplier Analysis 2018-2019 (US$)
Table 20: Aerospace Foam Market Distributor Analysis 2018-2019 (US$)
Table 21: Aerospace Foam Market Trend Analysis 2018-2019 (US$)
Table 22: Aerospace Foam Market Size 2018 (US$)
Table 23: Aerospace Foam Market Forecast Analysis 2021-2026 (US$)
Table 24: Aerospace Foam Market Sales Forecast Analysis 2021-2026 (Units)
Table 25: Aerospace Foam Market , Revenue & Volume, By Foam Type, 2021-2026 ($)
Table 26: Aerospace Foam Market By Foam Type, Revenue & Volume, By Polyethylene, 2021-2026 ($)
Table 27: Aerospace Foam Market By Foam Type, Revenue & Volume, By Cross-Linked polyethylene, 2021-2026 ($)
Table 28: Aerospace Foam Market By Foam Type, Revenue & Volume, By Ployurethane, 2021-2026 ($)
Table 29: Aerospace Foam Market By Foam Type, Revenue & Volume, By Reticulated Polyurethane, 2021-2026 ($)
Table 30: Aerospace Foam Market By Foam Type, Revenue & Volume, By Melamine, 2021-2026 ($)
Table 31: Aerospace Foam Market , Revenue & Volume, By End users, 2021-2026 ($)
Table 32: Aerospace Foam Market By End users, Revenue & Volume, By General Aircrafts, 2021-2026 ($)
Table 33: Aerospace Foam Market By End users, Revenue & Volume, By Commercial Aircrafts, 2021-2026 ($)
Table 34: Aerospace Foam Market By End users, Revenue & Volume, By Military Aircrafts, 2021-2026 ($)
Table 35: Aerospace Foam Market By End users, Revenue & Volume, By Experimental Aircrafts, 2021-2026 ($)
Table 36: North America Aerospace Foam Market , Revenue & Volume, By Foam Type, 2021-2026 ($)
Table 37: North America Aerospace Foam Market , Revenue & Volume, By End users, 2021-2026 ($)
Table 38: South america Aerospace Foam Market , Revenue & Volume, By Foam Type, 2021-2026 ($)
Table 39: South america Aerospace Foam Market , Revenue & Volume, By End users, 2021-2026 ($)
Table 40: Europe Aerospace Foam Market , Revenue & Volume, By Foam Type, 2021-2026 ($)
Table 41: Europe Aerospace Foam Market , Revenue & Volume, By End users, 2021-2026 ($)
Table 42: APAC Aerospace Foam Market , Revenue & Volume, By Foam Type, 2021-2026 ($)
Table 43: APAC Aerospace Foam Market , Revenue & Volume, By End users, 2021-2026 ($)
Table 44: Middle East & Africa Aerospace Foam Market , Revenue & Volume, By Foam Type, 2021-2026 ($)
Table 45: Middle East & Africa Aerospace Foam Market , Revenue & Volume, By End users, 2021-2026 ($)
Table 46: Russia Aerospace Foam Market , Revenue & Volume, By Foam Type, 2021-2026 ($)
Table 47: Russia Aerospace Foam Market , Revenue & Volume, By End users, 2021-2026 ($)
Table 48: Israel Aerospace Foam Market , Revenue & Volume, By Foam Type, 2021-2026 ($)
Table 49: Israel Aerospace Foam Market , Revenue & Volume, By End users, 2021-2026 ($)
Table 50: Top Companies 2018 (US$) Aerospace Foam Market , Revenue & Volume
Table 51: Product Launch 2018-2019 Aerospace Foam Market , Revenue & Volume
Table 52: Mergers & Acquistions 2018-2019 Aerospace Foam Market , Revenue & Volume

List of Figures:

Figure 1: Overview of Aerospace Foam Market 2021-2026
Figure 2: Market Share Analysis for Aerospace Foam Market 2018 (US$)
Figure 3: Product Comparison in Aerospace Foam Market 2018-2019 (US$)
Figure 4: End User Profile for Aerospace Foam Market 2018-2019 (US$)
Figure 5: Patent Application and Grant in Aerospace Foam Market 2013-2018* (US$)
Figure 6: Top 5 Companies Financial Analysis in Aerospace Foam Market 2018-2019 (US$)
Figure 7: Market Entry Strategy in Aerospace Foam Market 2018-2019
Figure 8: Ecosystem Analysis in Aerospace Foam Market 2018
Figure 9: Average Selling Price in Aerospace Foam Market 2021-2026
Figure 10: Top Opportunites in Aerospace Foam Market 2018-2019
Figure 11: Market Life Cycle Analysis in Aerospace Foam Market
Figure 12: GlobalBy Foam Type Aerospace Foam Market Revenue, 2021-2026 ($)
Figure 13: GlobalBy End users Aerospace Foam Market Revenue, 2021-2026 ($)
Figure 14: Global Aerospace Foam Market - By Geography
Figure 15: Global Aerospace Foam Market Value & Volume, By Geography, 2021-2026 ($) 
Figure 16: Global Aerospace Foam Market CAGR, By Geography, 2021-2026 (%)
Figure 17: North America Aerospace Foam Market Value & Volume, 2021-2026 ($)
Figure 18: US Aerospace Foam Market Value & Volume, 2021-2026 ($)
Figure 19: US GDP and Population, 2018-2019 ($)
Figure 20: US GDP – Composition of 2018, By Sector of Origin
Figure 21: US Export and Import Value & Volume, 2018-2019 ($)
Figure 22: Canada Aerospace Foam Market Value & Volume, 2021-2026 ($)
Figure 23: Canada GDP and Population, 2018-2019 ($)
Figure 24: Canada GDP – Composition of 2018, By Sector of Origin
Figure 25: Canada Export and Import Value & Volume, 2018-2019 ($)
Figure 26: Mexico Aerospace Foam Market Value & Volume, 2021-2026 ($)
Figure 27: Mexico GDP and Population, 2018-2019 ($)
Figure 28: Mexico GDP – Composition of 2018, By Sector of Origin
Figure 29: Mexico Export and Import Value & Volume, 2018-2019 ($)
Figure 30: South America Aerospace Foam Market Value & Volume, 2021-2026 ($)
Figure 31: Brazil Aerospace Foam Market Value & Volume, 2021-2026 ($)
Figure 32: Brazil GDP and Population, 2018-2019 ($)
Figure 33: Brazil GDP – Composition of 2018, By Sector of Origin
Figure 34: Brazil Export and Import Value & Volume, 2018-2019 ($)
Figure 35: Venezuela Aerospace Foam Market Value & Volume, 2021-2026 ($)
Figure 36: Venezuela GDP and Population, 2018-2019 ($)
Figure 37: Venezuela GDP – Composition of 2018, By Sector of Origin
Figure 38: Venezuela Export and Import Value & Volume, 2018-2019 ($)
Figure 39: Argentina Aerospace Foam Market Value & Volume, 2021-2026 ($)
Figure 40: Argentina GDP and Population, 2018-2019 ($)
Figure 41: Argentina GDP – Composition of 2018, By Sector of Origin
Figure 42: Argentina Export and Import Value & Volume, 2018-2019 ($)
Figure 43: Ecuador Aerospace Foam Market Value & Volume, 2021-2026 ($)
Figure 44: Ecuador GDP and Population, 2018-2019 ($)
Figure 45: Ecuador GDP – Composition of 2018, By Sector of Origin
Figure 46: Ecuador Export and Import Value & Volume, 2018-2019 ($)
Figure 47: Peru Aerospace Foam Market Value & Volume, 2021-2026 ($)
Figure 48: Peru GDP and Population, 2018-2019 ($)
Figure 49: Peru GDP – Composition of 2018, By Sector of Origin
Figure 50: Peru Export and Import Value & Volume, 2018-2019 ($)
Figure 51: Colombia Aerospace Foam Market Value & Volume, 2021-2026 ($)
Figure 52: Colombia GDP and Population, 2018-2019 ($)
Figure 53: Colombia GDP – Composition of 2018, By Sector of Origin
Figure 54: Colombia Export and Import Value & Volume, 2018-2019 ($)
Figure 55: Costa Rica Aerospace Foam Market Value & Volume, 2021-2026 ($)
Figure 56: Costa Rica GDP and Population, 2018-2019 ($)
Figure 57: Costa Rica GDP – Composition of 2018, By Sector of Origin
Figure 58: Costa Rica Export and Import Value & Volume, 2018-2019 ($)
Figure 59: Europe Aerospace Foam Market Value & Volume, 2021-2026 ($)
Figure 60: U.K Aerospace Foam Market Value & Volume, 2021-2026 ($)
Figure 61: U.K GDP and Population, 2018-2019 ($)
Figure 62: U.K GDP – Composition of 2018, By Sector of Origin
Figure 63: U.K Export and Import Value & Volume, 2018-2019 ($)
Figure 64: Germany Aerospace Foam Market Value & Volume, 2021-2026 ($)
Figure 65: Germany GDP and Population, 2018-2019 ($)
Figure 66: Germany GDP – Composition of 2018, By Sector of Origin
Figure 67: Germany Export and Import Value & Volume, 2018-2019 ($)
Figure 68: Italy Aerospace Foam Market Value & Volume, 2021-2026 ($)
Figure 69: Italy GDP and Population, 2018-2019 ($)
Figure 70: Italy GDP – Composition of 2018, By Sector of Origin
Figure 71: Italy Export and Import Value & Volume, 2018-2019 ($)
Figure 72: France Aerospace Foam Market Value & Volume, 2021-2026 ($)
Figure 73: France GDP and Population, 2018-2019 ($)
Figure 74: France GDP – Composition of 2018, By Sector of Origin
Figure 75: France Export and Import Value & Volume, 2018-2019 ($)
Figure 76: Netherlands Aerospace Foam Market Value & Volume, 2021-2026 ($)
Figure 77: Netherlands GDP and Population, 2018-2019 ($)
Figure 78: Netherlands GDP – Composition of 2018, By Sector of Origin
Figure 79: Netherlands Export and Import Value & Volume, 2018-2019 ($)
Figure 80: Belgium Aerospace Foam Market Value & Volume, 2021-2026 ($)
Figure 81: Belgium GDP and Population, 2018-2019 ($)
Figure 82: Belgium GDP – Composition of 2018, By Sector of Origin
Figure 83: Belgium Export and Import Value & Volume, 2018-2019 ($)
Figure 84: Spain Aerospace Foam Market Value & Volume, 2021-2026 ($)
Figure 85: Spain GDP and Population, 2018-2019 ($)
Figure 86: Spain GDP – Composition of 2018, By Sector of Origin
Figure 87: Spain Export and Import Value & Volume, 2018-2019 ($)
Figure 88: Denmark Aerospace Foam Market Value & Volume, 2021-2026 ($)
Figure 89: Denmark GDP and Population, 2018-2019 ($)
Figure 90: Denmark GDP – Composition of 2018, By Sector of Origin
Figure 91: Denmark Export and Import Value & Volume, 2018-2019 ($)
Figure 92: APAC Aerospace Foam Market Value & Volume, 2021-2026 ($)
Figure 93: China Aerospace Foam Market Value & Volume, 2021-2026
Figure 94: China GDP and Population, 2018-2019 ($)
Figure 95: China GDP – Composition of 2018, By Sector of Origin
Figure 96: China Export and Import Value & Volume, 2018-2019 ($) Aerospace Foam Market China Export and Import Value & Volume, 2018-2019 ($)
Figure 97: Australia Aerospace Foam Market Value & Volume, 2021-2026 ($)
Figure 98: Australia GDP and Population, 2018-2019 ($)
Figure 99: Australia GDP – Composition of 2018, By Sector of Origin
Figure 100: Australia Export and Import Value & Volume, 2018-2019 ($)
Figure 101: South Korea Aerospace Foam Market Value & Volume, 2021-2026 ($)
Figure 102: South Korea GDP and Population, 2018-2019 ($)
Figure 103: South Korea GDP – Composition of 2018, By Sector of Origin
Figure 104: South Korea Export and Import Value & Volume, 2018-2019 ($)
Figure 105: India Aerospace Foam Market Value & Volume, 2021-2026 ($)
Figure 106: India GDP and Population, 2018-2019 ($)
Figure 107: India GDP – Composition of 2018, By Sector of Origin
Figure 108: India Export and Import Value & Volume, 2018-2019 ($)
Figure 109: Taiwan Aerospace Foam Market Value & Volume, 2021-2026 ($)
Figure 110: Taiwan GDP and Population, 2018-2019 ($)
Figure 111: Taiwan GDP – Composition of 2018, By Sector of Origin
Figure 112: Taiwan Export and Import Value & Volume, 2018-2019 ($)
Figure 113: Malaysia Aerospace Foam Market Value & Volume, 2021-2026 ($)
Figure 114: Malaysia GDP and Population, 2018-2019 ($)
Figure 115: Malaysia GDP – Composition of 2018, By Sector of Origin
Figure 116: Malaysia Export and Import Value & Volume, 2018-2019 ($)
Figure 117: Hong Kong Aerospace Foam Market Value & Volume, 2021-2026 ($)
Figure 118: Hong Kong GDP and Population, 2018-2019 ($)
Figure 119: Hong Kong GDP – Composition of 2018, By Sector of Origin
Figure 120: Hong Kong Export and Import Value & Volume, 2018-2019 ($)
Figure 121: Middle East & Africa Aerospace Foam Market Middle East & Africa 3D Printing Market Value & Volume, 2021-2026 ($)
Figure 122: Russia Aerospace Foam Market Value & Volume, 2021-2026 ($)
Figure 123: Russia GDP and Population, 2018-2019 ($)
Figure 124: Russia GDP – Composition of 2018, By Sector of Origin
Figure 125: Russia Export and Import Value & Volume, 2018-2019 ($)
Figure 126: Israel Aerospace Foam Market Value & Volume, 2021-2026 ($)
Figure 127: Israel GDP and Population, 2018-2019 ($)
Figure 128: Israel GDP – Composition of 2018, By Sector of Origin
Figure 129: Israel Export and Import Value & Volume, 2018-2019 ($)
Figure 130: Entropy Share, By Strategies, 2018-2019* (%) Aerospace Foam Market 
Figure 131: Developments, 2018-2019* Aerospace Foam Market 
Figure 132: Company 1 Aerospace Foam Market Net Revenue, By Years, 2018-2019* ($)
Figure 133: Company 1 Aerospace Foam Market Net Revenue Share, By Business segments, 2018 (%)
Figure 134: Company 1 Aerospace Foam Market Net Sales Share, By Geography, 2018 (%)
Figure 135: Company 2 Aerospace Foam Market Net Revenue, By Years, 2018-2019* ($)
Figure 136: Company 2 Aerospace Foam Market Net Revenue Share, By Business segments, 2018 (%)
Figure 137: Company 2 Aerospace Foam Market Net Sales Share, By Geography, 2018 (%)
Figure 138: Company 3 Aerospace Foam Market Net Revenue, By Years, 2018-2019* ($)
Figure 139: Company 3 Aerospace Foam Market Net Revenue Share, By Business segments, 2018 (%)
Figure 140: Company 3 Aerospace Foam Market Net Sales Share, By Geography, 2018 (%)
Figure 141: Company 4 Aerospace Foam Market Net Revenue, By Years, 2018-2019* ($)
Figure 142: Company 4 Aerospace Foam Market Net Revenue Share, By Business segments, 2018 (%)
Figure 143: Company 4 Aerospace Foam Market Net Sales Share, By Geography, 2018 (%)
Figure 144: Company 5 Aerospace Foam Market Net Revenue, By Years, 2018-2019* ($)
Figure 145: Company 5 Aerospace Foam Market Net Revenue Share, By Business segments, 2018 (%)
Figure 146: Company 5 Aerospace Foam Market Net Sales Share, By Geography, 2018 (%)
Figure 147: Company 6 Aerospace Foam Market Net Revenue, By Years, 2018-2019* ($)
Figure 148: Company 6 Aerospace Foam Market Net Revenue Share, By Business segments, 2018 (%)
Figure 149: Company 6 Aerospace Foam Market Net Sales Share, By Geography, 2018 (%)
Figure 150: Company 7 Aerospace Foam Market Net Revenue, By Years, 2018-2019* ($)
Figure 151: Company 7 Aerospace Foam Market Net Revenue Share, By Business segments, 2018 (%)
Figure 152: Company 7 Aerospace Foam Market Net Sales Share, By Geography, 2018 (%)
Figure 153: Company 8 Aerospace Foam Market Net Revenue, By Years, 2018-2019* ($)
Figure 154: Company 8 Aerospace Foam Market Net Revenue Share, By Business segments, 2018 (%)
Figure 155: Company 8 Aerospace Foam Market Net Sales Share, By Geography, 2018 (%)
Figure 156: Company 9 Aerospace Foam Market Net Revenue, By Years, 2018-2019* ($)
Figure 157: Company 9 Aerospace Foam Market Net Revenue Share, By Business segments, 2018 (%)
Figure 158: Company 9 Aerospace Foam Market Net Sales Share, By Geography, 2018 (%)
Figure 159: Company 10 Aerospace Foam Market Net Revenue, By Years, 2018-2019* ($)
Figure 160: Company 10 Aerospace Foam Market Net Revenue Share, By Business segments, 2018 (%)
Figure 161: Company 10 Aerospace Foam Market Net Sales Share, By Geography, 2018 (%)
Figure 162: Company 11 Aerospace Foam Market Net Revenue, By Years, 2018-2019* ($)
Figure 163: Company 11 Aerospace Foam Market Net Revenue Share, By Business segments, 2018 (%)
Figure 164: Company 11 Aerospace Foam Market Net Sales Share, By Geography, 2018 (%)
Figure 165: Company 12 Aerospace Foam Market Net Revenue, By Years, 2018-2019* ($)
Figure 166: Company 12 Aerospace Foam Market Net Revenue Share, By Business segments, 2018 (%)
Figure 167: Company 12 Aerospace Foam Market Net Sales Share, By Geography, 2018 (%)
Figure 168: Company 13 Aerospace Foam Market Net Revenue, By Years, 2018-2019* ($)
Figure 169: Company 13 Aerospace Foam Market Net Revenue Share, By Business segments, 2018 (%)
Figure 170: Company 13 Aerospace Foam Market Net Sales Share, By Geography, 2018 (%)
Figure 171: Company 14 Aerospace Foam Market Net Revenue, By Years, 2018-2019* ($)
Figure 172: Company 14 Aerospace Foam Market Net Revenue Share, By Business segments, 2018 (%)
Figure 173: Company 14 Aerospace Foam Market Net Sales Share, By Geography, 2018 (%)
Figure 174: Company 15 Aerospace Foam Market Net Revenue, By Years, 2018-2019* ($)
Figure 175: Company 15 Aerospace Foam Market Net Revenue Share, By Business segments, 2018 (%)
Figure 176: Company 15 Aerospace Foam Market Net Sales Share, By Geography, 2018 (%)