 Email
Email Print
Print


Load Cells Market Overview
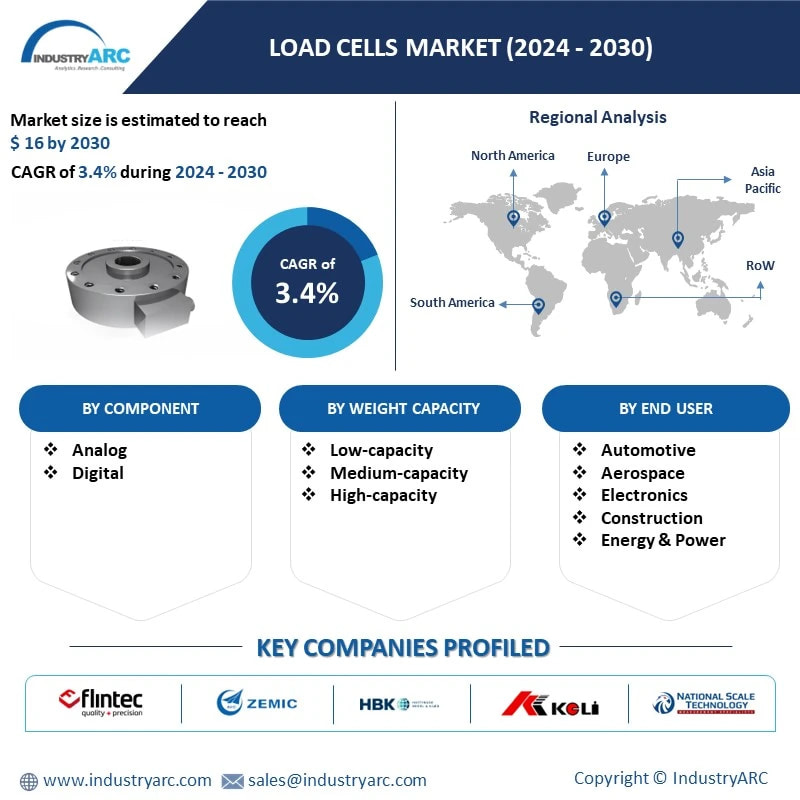
Load Cells Market size is forecast to reach $16 billion by 2030, estimated to grow at a CAGR of 3.4 % during 2024-2030. Load cells are transducers that converts force into a measurable electrical output. Load cells can measure torque load, temperature, electrical force, levelness, power required for weighing. Load cells are widely find their application in analogous and electronic weighing devices. Globally, demand for load cells is being driven by growing perpetual use in mining activities, logistics and metal industry. In addition, minimization of the instrumental errors in transducers, owing to technological advancement has also fuelled the growth. It also highlights the potential growth opportunities in the coming years, while also reviewing the market drivers, restraints, growth indicators, challenges, market dynamics, competitive landscape, and other key aspects with respect to load cells market. A significant trend in the load cells market is the integration of wireless and Internet of Things (IoT) technologies to enhance data collection, monitoring, and analysis capabilities. Traditional load cells typically require wired connections to data acquisition systems, which can be cumbersome and limit their flexibility in certain applications. To address these limitations, manufacturers are developing wireless load cells equipped with built-in transmitters and receivers, enabling real-time transmission of measurement data to central monitoring systems or mobile devices via Bluetooth, Wi-Fi, or other wireless communication protocols. These wireless load cells offer advantages such as simplified installation, reduced cabling costs, and increased scalability, making them ideal for applications requiring remote or distributed sensing, such as tank weighing, vehicle scales, and material handling equipment. Furthermore, the integration of IoT capabilities into load cell designs enables advanced features such as predictive maintenance, asset tracking, and condition monitoring, empowering users to optimize performance, improve efficiency, and prevent costly downtime in industrial and commercial settings. Another notable development in the load cells market is the growing demand for high-precision and miniaturized load cells capable of accurately measuring smaller loads in compact spaces. As industries increasingly rely on automation, robotics, and IoT-enabled devices, there is a need for load cells that can provide precise measurements in tight or confined environments. Manufacturers are responding by developing load cells with improved sensitivity, resolution, and linearity, as well as reduced dimensions and weights, to meet the requirements of emerging applications such as medical devices, aerospace components, and wearable technologies. These miniaturized load cells leverage advanced materials, sensor technologies, and manufacturing processes to achieve high levels of accuracy and reliability while occupying minimal space. Additionally, advancements in microelectronics and signal processing enable these load cells to deliver real-time measurements with low noise and drift, ensuring consistent performance in demanding operating conditions. By addressing the need for compact and high-precision load sensing solutions, manufacturers are driving innovation and market growth in the load cells industry, catering to the evolving needs of diverse industries and applications.
Report Coverage
The report: “Load Cells Market Report – Forecast (2024-2030)”, by IndustryARC, covers an in-depth analysis of the following segments of the steel framing market.
By Product Type – "S"-type, Dual-shear, Single-point, Shear-beam, Bending- beam, Digital/smart load cells
By Component – Analog, Digital
By Weigh Capacity – Low-capacity, Medium-capacity, High-capacity
By Application – Industrial, Medical, Retail, Transportation, Others
By End User – Automotive, Aerospace, Electronics, Construction, Energy & Power, Industrial, Metals & Mining, Pharmaceutical, Others
By Geography: North America (USA, Canada, and Mexico), Europe (UK, Germany, France, Italy, Netherlands, Spain, Belgium, and Rest of Europe), Asia-Pacific (China, Japan, India, South Korea, Australia and New Zealand, Indonesia, Taiwan, Malaysia, and Rest of APAC), South America (Brazil, Argentina, Colombia, Chile, and Rest of South America), Rest of the World (Middle East, and Africa)
Key Takeaways
• Geographically, Europe dominated the global load cells market, followed by the U.S. Asia Pacific is projected to have the fastest growth, owing to higher number of consumers migrating towards automated systems, rising the demand for industrial weighing equipment.
• Increasing infrastructure for manufacturing, construction, warehousing, mining, and shipping will also boost the growth in Asia Pacific region.
• Single Point Load Cells is the market leader in load cells market, Dual Shear and S Type Beam Load Cells, are growing at relatively higher CAGR, owing to rising demand for measuring devices in medical sector.

For More Details on This Report - Request for Sample
This report segments global load cells market on the basis of product type, end-use Industry and regional market as follows:
• On the basis of types of load cells this report on global load cells market is segmented which includes major types of load cells as follows: "S"-type, Dual-shear, Single-point, Shear-beam, Bending- beam and Digital/smart load cells
• The report is on load cells also segmented on the basis of major end-use industry in which load cells are being used as follow: Automotive, Industrial, Metals & Mining, Pharmaceutical and Others
• This report has been further segmented into major regions, which includes detailed analysis of each region such as: North America, Europe, Asia-Pacific (APAC), and Rest of the World (RoW) covering all the major country level markets for load cells in each of the region.
This report identifies all the major companies operating in the Load Cells market. Some of the major companies’ profiles in detail are as follows:
- Flintec Group AB
- Zhonghang Electronic Measuring Instruments Co. Ltd.
- Hottinger Baldwin Messtechnik GmbH
- Keli Electric Manufacturing (Ningbo) Co. Ltd.
- National Scale Technology
For more “Automation and Instrumentation” related reports, please click here
1. Load Cells – Market Overview
2. Executive Summary
3. Load Cells Market Landscape
3.1. Market Share Analysis
3.2. Comparative Analysis
3.2.1. Product Benchmarking
3.2.2. End User Profiling
3.2.3. Top 5 Financials Analysis
4. Load Cells– Market Forces
4.1. Drivers
4.1.1. Growing perpetual use in mining activities, logistics and metal industry
4.1.2. Increase in production of heavy manufacturing/industrial machinery
4.2. Restraints
4.2.1. Increasing regulatory obligations
4.3. Opportunities
4.3.1. Growing infrastructure for mining, manufacture, warehousing, construction, and shipping
4.3.2. Increasing automotive production in developing countries
4.4. Challenges
4.5. Porter’s Five Forces Analysis
4.5.1. Bargaining Power of Suppliers
4.5.2. Bargaining Power of Buyers
4.5.3. Threat of New Entrants
4.5.4. Threat of Substitutes
4.5.5. Degree of Competition
5. Load Cells Market – Strategic Analysis
5.1. Value Chain Analysis
5.2. Pricing Analysis
5.3. Opportunities Analysis
5.4. Product/Market Life Cycle Analysis
5.5. Suppliers and Distributors
6. Global Load Cells Market, By Product Type
6.1. "S"-type
6.2. Dual-shear
6.3. Single-point
6.4. Shear-beam
6.5. Bending- beam
6.6. Digital/smart load cells
7. Global Load Cells Market, By Weigh Capacity
7.1. Low-capacity
7.2. Medium-capacity
7.2. High-capacity
8. Global Load Cells Market, By Component
8.1. Analog
8.2. Digital
9. Global Load Cells Market, By Application
9.1. Medical
9.1. Industrial
9.1. Retail
9.1. Transportation
9.1. Others
10. Global Load Cells Market, By End-Use Industry
10.1. Automotive
10.1. Aerospace
10.1. Electronics
10.1. Construction
10.1. Energy & Power
10.2. Industrial
10.3. Metals & Mining
10.4. Pharmaceutical
10.5. Others
11. Global Load Cells Market, By Geography
11.1. North America
11.1.1. U.S.
11.1.2. Canada
11.1.3. Mexico
11.2. Asia Pacific
11.2.1. China
11.2.2. India
11.2.3. Japan
11.2.4. South Korea
11.2.5. Rest of Asia-Pacific
11.3. Europe
11.3.1. Germany
11.3.2. France
11.3.3. Italy
11.3.4. Spain
11.3.5. Russia
11.3.6. U.K.
11.3.7. Rest of Europe
11.4. Rest of the World (RoW)
11.4.1. South America
11.4.2. Middle East
11.4.3 Africa
12. Load Cells – Market Entropy
12.1. Expansion
12.2. Technological Developments
12.3. Merger & Acquisitions, and Joint Ventures
13. Company Profiles (Top 10 Companies)
13.1. Flintec Group AB
13.1.1. Introduction
13.1.2. Financials
13.1.3. Key Insights
13.1.4. Key Strategy
13.1.5. Product Portfolio
13.1.6. SWOT Analysis
13.2. PCB Piezotronics Inc.
13.2.1. Introduction
13.2.2. Financials
13.2.3. Key Insights
13.2.4. Key Strategy
13.2.5. Product Portfolio
13.2.6. SWOT Analysis
13.3. Zemic
13.3.1. Introduction
13.3.2. Financials
13.3.3. Key Insights
13.3.4. Key Strategy
13.3.5. Product Portfolio
13.3.6. SWOT Analysis
13.4. Hottinger Baldwin Messtechnik GmbH
13.4.1. Introduction
13.4.2. Financials
13.4.3. Key Insights
13.4.4. Key Strategy
13.4.5. Product Portfolio
13.4.6. SWOT Analysis
13.5. Interface Inc.
13.5.1. Introduction
13.5.2. Financials
13.5.3. Key Insights
13.5.4. Key Strategy
13.5.5. Product Portfolio
13.5.6. SWOT Analysis
13.6. Keli Electric Manufacturing (Ningbo) Co. Ltd.
13.6.1. Introduction
13.6.2. Financials
13.6.3. Key Insights
13.6.4. Key Strategy
13.6.5. Product Portfolio
13.6.6. SWOT Analysis
13.7. A&D Company Limited
13.7.1. Introduction
13.7.2. Financials
13.7.3. Key Insights
13.7.4. Key Strategy
13.7.5. Product Portfolio
13.7.6. SWOT Analysis
13.8. Novatech Measurements Ltd.
13.8.1. Introduction
13.8.2. Financials
13.8.3. Key Insights
13.8.4. Key Strategy
13.8.5. Product Portfolio
13.8.6. SWOT Analysis
13.9. Rice Lake Weighing Systems
13.9.1. Introduction
13.9.2. Financials
13.9.3. Key Insights
13.9.4. Key Strategy
13.9.5. Product Portfolio
13.9.6. SWOT Analysis
13.10. Thames Side Sensors Ltd.
13.10.1. Introduction
13.10.2. Financials
13.10.3. Key Insights
13.10.4. Key Strategy
13.10.5. Product Portfolio
13.10.6. SWOT Analysis
"*Financials would be provided on a best efforts basis for private companies"
Connect with our experts to get customized reports that best suit your requirements. Our reports include global-level data, niche markets and competitive landscape.
List of Tables
Table 1: Load Cell Market Overview 2021-2026
Table 2: Load Cell Market Leader Analysis 2018-2019 (US$)
Table 3: Load Cell Market Product Analysis 2018-2019 (US$)
Table 4: Load Cell Market End User Analysis 2018-2019 (US$)
Table 5: Load Cell Market Patent Analysis 2013-2018* (US$)
Table 6: Load Cell Market Financial Analysis 2018-2019 (US$)
Table 7: Load Cell Market Driver Analysis 2018-2019 (US$)
Table 8: Load Cell Market Challenges Analysis 2018-2019 (US$)
Table 9: Load Cell Market Constraint Analysis 2018-2019 (US$)
Table 10: Load Cell Market Supplier Bargaining Power Analysis 2018-2019 (US$)
Table 11: Load Cell Market Buyer Bargaining Power Analysis 2018-2019 (US$)
Table 12: Load Cell Market Threat of Substitutes Analysis 2018-2019 (US$)
Table 13: Load Cell Market Threat of New Entrants Analysis 2018-2019 (US$)
Table 14: Load Cell Market Degree of Competition Analysis 2018-2019 (US$)
Table 15: Load Cell Market Value Chain Analysis 2018-2019 (US$)
Table 16: Load Cell Market Pricing Analysis 2021-2026 (US$)
Table 17: Load Cell Market Opportunities Analysis 2021-2026 (US$)
Table 18: Load Cell Market Product Life Cycle Analysis 2021-2026 (US$)
Table 19: Load Cell Market Supplier Analysis 2018-2019 (US$)
Table 20: Load Cell Market Distributor Analysis 2018-2019 (US$)
Table 21: Load Cell Market Trend Analysis 2018-2019 (US$)
Table 22: Load Cell Market Size 2018 (US$)
Table 23: Load Cell Market Forecast Analysis 2021-2026 (US$)
Table 24: Load Cell Market Sales Forecast Analysis 2021-2026 (Units)
Table 25: Load Cell Market, Revenue & Volume,By Product, 2021-2026 ($)
Table 26: Load Cell Market By Product, Revenue & Volume,By S-type, 2021-2026 ($)
Table 27: Load Cell Market By Product, Revenue & Volume,By Dual-Shear, 2021-2026 ($)
Table 28: Load Cell Market By Product, Revenue & Volume,By Single-Point, 2021-2026 ($)
Table 29: Load Cell Market By Product, Revenue & Volume,By Shear-Beam, 2021-2026 ($)
Table 30: Load Cell Market By Product, Revenue & Volume,By Bending- Beam, 2021-2026 ($)
Table 31: North America Load Cell Market, Revenue & Volume,By Product, 2021-2026 ($)
Table 32: South america Load Cell Market, Revenue & Volume,By Product, 2021-2026 ($)
Table 33: Europe Load Cell Market, Revenue & Volume,By Product, 2021-2026 ($)
Table 34: APAC Load Cell Market, Revenue & Volume,By Product, 2021-2026 ($)
Table 35: Middle East & Africa Load Cell Market, Revenue & Volume,By Product, 2021-2026 ($)
Table 36: Russia Load Cell Market, Revenue & Volume,By Product, 2021-2026 ($)
Table 37: Israel Load Cell Market, Revenue & Volume,By Product, 2021-2026 ($)
Table 38: Top Companies 2018 (US$)Load Cell Market, Revenue & Volume
Table 39: Product Launch 2018-2019Load Cell Market, Revenue & Volume
Table 40: Mergers & Acquistions 2018-2019Load Cell Market, Revenue & Volume
List of Figures
Figure 1: Overview of Load Cell Market 2021-2026
Figure 2: Market Share Analysis for Load Cell Market 2018 (US$)
Figure 3: Product Comparison in Load Cell Market 2018-2019 (US$)
Figure 4: End User Profile for Load Cell Market 2018-2019 (US$)
Figure 5: Patent Application and Grant in Load Cell Market 2013-2018* (US$)
Figure 6: Top 5 Companies Financial Analysis in Load Cell Market 2018-2019 (US$)
Figure 7: Market Entry Strategy in Load Cell Market 2018-2019
Figure 8: Ecosystem Analysis in Load Cell Market 2018
Figure 9: Average Selling Price in Load Cell Market 2021-2026
Figure 10: Top Opportunites in Load Cell Market 2018-2019
Figure 11: Market Life Cycle Analysis in Load Cell Market
Figure 12: GlobalBy ProductLoad Cell Market Revenue, 2021-2026 ($)
Figure 13: Global Load Cell Market - By Geography
Figure 14: Global Load Cell Market Value & Volume, By Geography, 2021-2026 ($)
Figure 15: Global Load Cell Market CAGR, By Geography, 2021-2026 (%)
Figure 16: North America Load Cell Market Value & Volume, 2021-2026 ($)
Figure 17: US Load Cell Market Value & Volume, 2021-2026 ($)
Figure 18: US GDP and Population, 2018-2019 ($)
Figure 19: US GDP – Composition of 2018, By Sector of Origin
Figure 20: US Export and Import Value & Volume, 2018-2019 ($)
Figure 21: Canada Load Cell Market Value & Volume, 2021-2026 ($)
Figure 22: Canada GDP and Population, 2018-2019 ($)
Figure 23: Canada GDP – Composition of 2018, By Sector of Origin
Figure 24: Canada Export and Import Value & Volume, 2018-2019 ($)
Figure 25: Mexico Load Cell Market Value & Volume, 2021-2026 ($)
Figure 26: Mexico GDP and Population, 2018-2019 ($)
Figure 27: Mexico GDP – Composition of 2018, By Sector of Origin
Figure 28: Mexico Export and Import Value & Volume, 2018-2019 ($)
Figure 29: South America Load Cell Market Value & Volume, 2021-2026 ($)
Figure 30: Brazil Load Cell Market Value & Volume, 2021-2026 ($)
Figure 31: Brazil GDP and Population, 2018-2019 ($)
Figure 32: Brazil GDP – Composition of 2018, By Sector of Origin
Figure 33: Brazil Export and Import Value & Volume, 2018-2019 ($)
Figure 34: Venezuela Load Cell Market Value & Volume, 2021-2026 ($)
Figure 35: Venezuela GDP and Population, 2018-2019 ($)
Figure 36: Venezuela GDP – Composition of 2018, By Sector of Origin
Figure 37: Venezuela Export and Import Value & Volume, 2018-2019 ($)
Figure 38: Argentina Load Cell Market Value & Volume, 2021-2026 ($)
Figure 39: Argentina GDP and Population, 2018-2019 ($)
Figure 40: Argentina GDP – Composition of 2018, By Sector of Origin
Figure 41: Argentina Export and Import Value & Volume, 2018-2019 ($)
Figure 42: Ecuador Load Cell Market Value & Volume, 2021-2026 ($)
Figure 43: Ecuador GDP and Population, 2018-2019 ($)
Figure 44: Ecuador GDP – Composition of 2018, By Sector of Origin
Figure 45: Ecuador Export and Import Value & Volume, 2018-2019 ($)
Figure 46: Peru Load Cell Market Value & Volume, 2021-2026 ($)
Figure 47: Peru GDP and Population, 2018-2019 ($)
Figure 48: Peru GDP – Composition of 2018, By Sector of Origin
Figure 49: Peru Export and Import Value & Volume, 2018-2019 ($)
Figure 50: Colombia Load Cell Market Value & Volume, 2021-2026 ($)
Figure 51: Colombia GDP and Population, 2018-2019 ($)
Figure 52: Colombia GDP – Composition of 2018, By Sector of Origin
Figure 53: Colombia Export and Import Value & Volume, 2018-2019 ($)
Figure 54: Costa Rica Load Cell Market Value & Volume, 2021-2026 ($)
Figure 55: Costa Rica GDP and Population, 2018-2019 ($)
Figure 56: Costa Rica GDP – Composition of 2018, By Sector of Origin
Figure 57: Costa Rica Export and Import Value & Volume, 2018-2019 ($)
Figure 58: Europe Load Cell Market Value & Volume, 2021-2026 ($)
Figure 59: U.K Load Cell Market Value & Volume, 2021-2026 ($)
Figure 60: U.K GDP and Population, 2018-2019 ($)
Figure 61: U.K GDP – Composition of 2018, By Sector of Origin
Figure 62: U.K Export and Import Value & Volume, 2018-2019 ($)
Figure 63: Germany Load Cell Market Value & Volume, 2021-2026 ($)
Figure 64: Germany GDP and Population, 2018-2019 ($)
Figure 65: Germany GDP – Composition of 2018, By Sector of Origin
Figure 66: Germany Export and Import Value & Volume, 2018-2019 ($)
Figure 67: Italy Load Cell Market Value & Volume, 2021-2026 ($)
Figure 68: Italy GDP and Population, 2018-2019 ($)
Figure 69: Italy GDP – Composition of 2018, By Sector of Origin
Figure 70: Italy Export and Import Value & Volume, 2018-2019 ($)
Figure 71: France Load Cell Market Value & Volume, 2021-2026 ($)
Figure 72: France GDP and Population, 2018-2019 ($)
Figure 73: France GDP – Composition of 2018, By Sector of Origin
Figure 74: France Export and Import Value & Volume, 2018-2019 ($)
Figure 75: Netherlands Load Cell Market Value & Volume, 2021-2026 ($)
Figure 76: Netherlands GDP and Population, 2018-2019 ($)
Figure 77: Netherlands GDP – Composition of 2018, By Sector of Origin
Figure 78: Netherlands Export and Import Value & Volume, 2018-2019 ($)
Figure 79: Belgium Load Cell Market Value & Volume, 2021-2026 ($)
Figure 80: Belgium GDP and Population, 2018-2019 ($)
Figure 81: Belgium GDP – Composition of 2018, By Sector of Origin
Figure 82: Belgium Export and Import Value & Volume, 2018-2019 ($)
Figure 83: Spain Load Cell Market Value & Volume, 2021-2026 ($)
Figure 84: Spain GDP and Population, 2018-2019 ($)
Figure 85: Spain GDP – Composition of 2018, By Sector of Origin
Figure 86: Spain Export and Import Value & Volume, 2018-2019 ($)
Figure 87: Denmark Load Cell Market Value & Volume, 2021-2026 ($)
Figure 88: Denmark GDP and Population, 2018-2019 ($)
Figure 89: Denmark GDP – Composition of 2018, By Sector of Origin
Figure 90: Denmark Export and Import Value & Volume, 2018-2019 ($)
Figure 91: APAC Load Cell Market Value & Volume, 2021-2026 ($)
Figure 92: China Load Cell Market Value & Volume, 2021-2026
Figure 93: China GDP and Population, 2018-2019 ($)
Figure 94: China GDP – Composition of 2018, By Sector of Origin
Figure 95: China Export and Import Value & Volume, 2018-2019 ($)Load Cell Market China Export and Import Value & Volume, 2018-2019 ($)
Figure 96: Australia Load Cell Market Value & Volume, 2021-2026 ($)
Figure 97: Australia GDP and Population, 2018-2019 ($)
Figure 98: Australia GDP – Composition of 2018, By Sector of Origin
Figure 99: Australia Export and Import Value & Volume, 2018-2019 ($)
Figure 100: South Korea Load Cell Market Value & Volume, 2021-2026 ($)
Figure 101: South Korea GDP and Population, 2018-2019 ($)
Figure 102: South Korea GDP – Composition of 2018, By Sector of Origin
Figure 103: South Korea Export and Import Value & Volume, 2018-2019 ($)
Figure 104: India Load Cell Market Value & Volume, 2021-2026 ($)
Figure 105: India GDP and Population, 2018-2019 ($)
Figure 106: India GDP – Composition of 2018, By Sector of Origin
Figure 107: India Export and Import Value & Volume, 2018-2019 ($)
Figure 108: Taiwan Load Cell Market Value & Volume, 2021-2026 ($)
Figure 109: Taiwan GDP and Population, 2018-2019 ($)
Figure 110: Taiwan GDP – Composition of 2018, By Sector of Origin
Figure 111: Taiwan Export and Import Value & Volume, 2018-2019 ($)
Figure 112: Malaysia Load Cell Market Value & Volume, 2021-2026 ($)
Figure 113: Malaysia GDP and Population, 2018-2019 ($)
Figure 114: Malaysia GDP – Composition of 2018, By Sector of Origin
Figure 115: Malaysia Export and Import Value & Volume, 2018-2019 ($)
Figure 116: Hong Kong Load Cell Market Value & Volume, 2021-2026 ($)
Figure 117: Hong Kong GDP and Population, 2018-2019 ($)
Figure 118: Hong Kong GDP – Composition of 2018, By Sector of Origin
Figure 119: Hong Kong Export and Import Value & Volume, 2018-2019 ($)
Figure 120: Middle East & Africa Load Cell Market Middle East & Africa 3D Printing Market Value & Volume, 2021-2026 ($)
Figure 121: Russia Load Cell Market Value & Volume, 2021-2026 ($)
Figure 122: Russia GDP and Population, 2018-2019 ($)
Figure 123: Russia GDP – Composition of 2018, By Sector of Origin
Figure 124: Russia Export and Import Value & Volume, 2018-2019 ($)
Figure 125: Israel Load Cell Market Value & Volume, 2021-2026 ($)
Figure 126: Israel GDP and Population, 2018-2019 ($)
Figure 127: Israel GDP – Composition of 2018, By Sector of Origin
Figure 128: Israel Export and Import Value & Volume, 2018-2019 ($)
Figure 129: Entropy Share, By Strategies, 2018-2019* (%)Load Cell Market
Figure 130: Developments, 2018-2019*Load Cell Market
Figure 131: Company 1 Load Cell Market Net Revenue, By Years, 2018-2019* ($)
Figure 132: Company 1 Load Cell Market Net Revenue Share, By Business segments, 2018 (%)
Figure 133: Company 1 Load Cell Market Net Sales Share, By Geography, 2018 (%)
Figure 134: Company 2 Load Cell Market Net Revenue, By Years, 2018-2019* ($)
Figure 135: Company 2 Load Cell Market Net Revenue Share, By Business segments, 2018 (%)
Figure 136: Company 2 Load Cell Market Net Sales Share, By Geography, 2018 (%)
Figure 137: Company 3Load Cell Market Net Revenue, By Years, 2018-2019* ($)
Figure 138: Company 3Load Cell Market Net Revenue Share, By Business segments, 2018 (%)
Figure 139: Company 3Load Cell Market Net Sales Share, By Geography, 2018 (%)
Figure 140: Company 4 Load Cell Market Net Revenue, By Years, 2018-2019* ($)
Figure 141: Company 4 Load Cell Market Net Revenue Share, By Business segments, 2018 (%)
Figure 142: Company 4 Load Cell Market Net Sales Share, By Geography, 2018 (%)
Figure 143: Company 5 Load Cell Market Net Revenue, By Years, 2018-2019* ($)
Figure 144: Company 5 Load Cell Market Net Revenue Share, By Business segments, 2018 (%)
Figure 145: Company 5 Load Cell Market Net Sales Share, By Geography, 2018 (%)
Figure 146: Company 6 Load Cell Market Net Revenue, By Years, 2018-2019* ($)
Figure 147: Company 6 Load Cell Market Net Revenue Share, By Business segments, 2018 (%)
Figure 148: Company 6 Load Cell Market Net Sales Share, By Geography, 2018 (%)
Figure 149: Company 7 Load Cell Market Net Revenue, By Years, 2018-2019* ($)
Figure 150: Company 7 Load Cell Market Net Revenue Share, By Business segments, 2018 (%)
Figure 151: Company 7 Load Cell Market Net Sales Share, By Geography, 2018 (%)
Figure 152: Company 8 Load Cell Market Net Revenue, By Years, 2018-2019* ($)
Figure 153: Company 8 Load Cell Market Net Revenue Share, By Business segments, 2018 (%)
Figure 154: Company 8 Load Cell Market Net Sales Share, By Geography, 2018 (%)
Figure 155: Company 9 Load Cell Market Net Revenue, By Years, 2018-2019* ($)
Figure 156: Company 9 Load Cell Market Net Revenue Share, By Business segments, 2018 (%)
Figure 157: Company 9 Load Cell Market Net Sales Share, By Geography, 2018 (%)
Figure 158: Company 10 Load Cell Market Net Revenue, By Years, 2018-2019* ($)
Figure 159: Company 10 Load Cell Market Net Revenue Share, By Business segments, 2018 (%)
Figure 160: Company 10 Load Cell Market Net Sales Share, By Geography, 2018 (%)
Figure 161: Company 11 Load Cell Market Net Revenue, By Years, 2018-2019* ($)
Figure 162: Company 11 Load Cell Market Net Revenue Share, By Business segments, 2018 (%)
Figure 163: Company 11 Load Cell Market Net Sales Share, By Geography, 2018 (%)
Figure 164: Company 12 Load Cell Market Net Revenue, By Years, 2018-2019* ($)
Figure 165: Company 12 Load Cell Market Net Revenue Share, By Business segments, 2018 (%)
Figure 166: Company 12 Load Cell Market Net Sales Share, By Geography, 2018 (%)
Figure 167: Company 13Load Cell Market Net Revenue, By Years, 2018-2019* ($)
Figure 168: Company 13Load Cell Market Net Revenue Share, By Business segments, 2018 (%)
Figure 169: Company 13Load Cell Market Net Sales Share, By Geography, 2018 (%)
Figure 170: Company 14 Load Cell Market Net Revenue, By Years, 2018-2019* ($)
Figure 171: Company 14 Load Cell Market Net Revenue Share, By Business segments, 2018 (%)
Figure 172: Company 14 Load Cell Market Net Sales Share, By Geography, 2018 (%)
Figure 173: Company 15 Load Cell Market Net Revenue, By Years, 2018-2019* ($)
Figure 174: Company 15 Load Cell Market Net Revenue Share, By Business segments, 2018 (%)
Figure 175: Company 15 Load Cell Market Net Sales Share, By Geography, 2018 (%)