 Email
Email Print
Print


Artificial Intelligence Market - Forecast(2024 - 2030)
Artificial Intelligence Market Overview
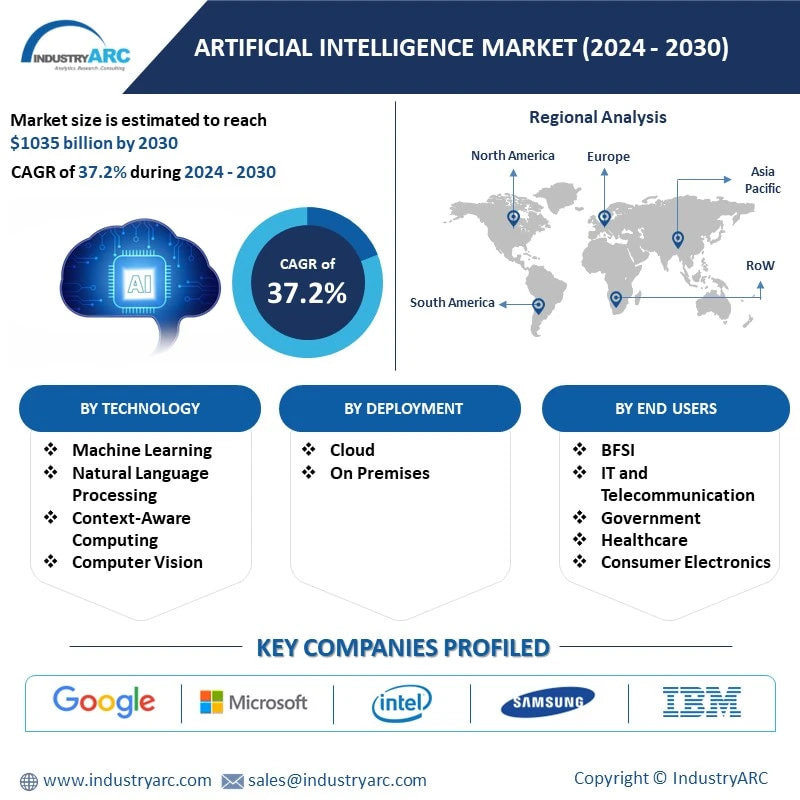
The Artificial Intelligence Market is expected to reach $1035 billion by 2030, growing at a CAGR of 37.2% during the forecast period 2024-2030. Artificial Intelligence (AI) refers to a recreation of human intelligence functions by machines. It is used in the internet of things for multiple tasks including cloud computing, customer relationship management, data analysis, facial recognition technology, fraud detection and predictive analysis. The widescale adoption of Artificial Intelligence in various sectors on a global scale is for updating systems with intelligent features to enhance operational efficiency. In October 2022, Google Cloud introduced an AI-enabled medical imaging suite for use in the healthcare sector. It would reduce manual work done by radiologists as it has storage, datasets and an AI pipeline for imaging.
Multimodal AI is a pivotal trend in the evolving landscape of artificial intelligence. Diverging from conventional single-mode data processing, it simultaneously analyzes diverse data types, fostering a holistic approach. This comprehensive methodology enhances the adaptability of AI systems, enabling them to interpret and respond to a broader array of inputs. As the market embraces multimodal AI, its potential applications expand, contributing to the continuous advancement and sophistication of artificial intelligence solutions. In January 2024, Google has unveiled a new multimodal AI model ‘Lumiere’. Google's Lumiere, a groundbreaking multimodal AI video model, revolutionizes video creation. It seamlessly integrates text-based image editing, providing users with a powerful tool for consistent and authentic video editing experiences.
Market Snapshot:
Artificial Intelligence Market Report Coverage
The “Artificial Intelligence Market Report – Forecast (2024-2030)” by IndustryARC, covers an in-depth analysis of the following segments in the Artificial Intelligence Market.
By Offering: Hardware, Software and Services.
By Technology: Machine Learning, Natural Language Processing, Context-Aware Computing and Computer Vision.
By Deployment: On-premises and Cloud.
By Organization Size: Small and Medium Enterprises and Large Enterprises.
By Product: Medical devices, Connected Consumer Devices, Smart Wearables, Home appliances, electronic gadgets, Mobiles, Laptops & PCs, Robots, Industrial Systems, Cameras, AR/VR, Drones and Others.
By Application: Industrial processes, Medical Assistance and Diagnosis, Marketing and sales, Security systems, Finance, Supply chain management, Service deployment, Cloud computing, Customer relationship management, Data analysis, Facial recognition technology, Fraud detection, Predictive analysis and Others.
By End-users: BFSI, IT and Telecommunication, Government, Defense, Consumer Electronics, Manufacturing, Healthcare, Retail and E-commerce, Automotive, Logistics and Transportation, Power and Utilities, Oil and Gas, Education and Others.
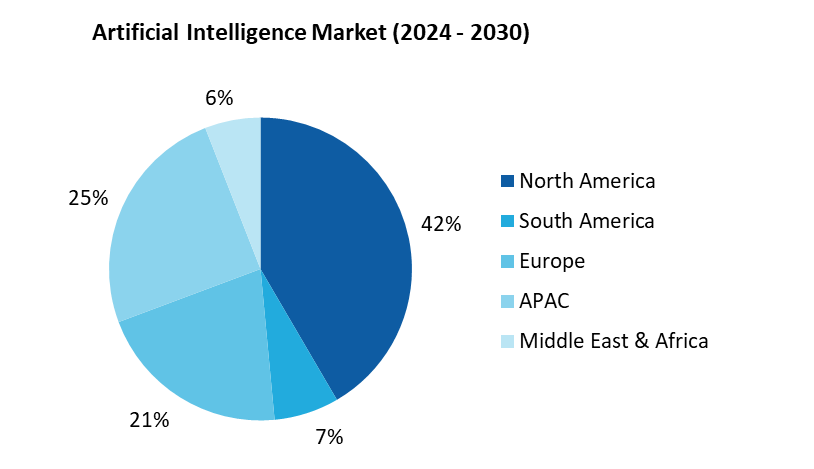
By Geography: North America (the US, Canada and Mexico), Europe (Germany, the UK, France, Italy, Spain and Others), APAC (China, Japan, South Korea, India, Australia and Others), South America (Brazil, Argentina and Others) and RoW (the Middle East and Africa).
Key Takeaways
● The Smart wearables segment by product type in the Artificial Intelligence Market is expected to grow the fastest at a CAGR of 39.2%, during the forecast period 2024-2030. The widescale adoption of AI in smart wearables is for upgrading the real-time monitoring features of smart connected devices.
● The Healthcare segment by end-users in the Artificial Intelligence Market is expected to grow the fastest at a CAGR of 39.5%, during the forecast period 2024-2030. The increased adoption of AI in the healthcare sector for upgrading medical infrastructure with accurate and real-time monitoring systems would provide uninterrupted patient care services.
● In 2023, North America held the largest market share of 38% in the Artificial Intelligence Market in terms of revenue. The widescale use of AI in this region is due to the government's efforts to encourage the adoption of AI-enabled solutions for the effective management of internet systems and delivery of uninterrupted services.
● The increased deployment of AI in the Education sector for modernizing infrastructures with intelligent connected devices to deliver uninterrupted education is driving the market growth.
For More Details on This Report - Request for Sample
Artificial Intelligence Market Segment Analysis - by Product
The Artificial Intelligence Market by product types has been segmented into medical devices, connected consumer devices, smart wearables, home appliances, electronic gadgets, mobiles, laptops & PCs, robots, industrial systems, cameras, AR/VR, drones and others. The Smart wearables segment in the Artificial Intelligence Market is expected to grow the fastest at a CAGR of 39.2%, during the forecast period 2024-2030. The widescale adoption of AI in smart wearables is for upgrading the real-time monitoring features of smart connected devices. Rising demand for AI-based IoT devices such as fitness bands among consumers to track their health vitals is also significantly contributing to market growth in this sector. In November 2023, GE HealthCare launched an ultra sound imaging highlighting Venue Family point-of-care ultrasound systems, an AI technology delivering real-time guidance capturing diagnostic-quality cardiac images and LOGIQ E10 Series, featuring Verisound Digital & AI Solutions.
Artificial Intelligence Market Segment Analysis - by End-users
The Artificial Intelligence Market by end-users has been segmented into BFSI, IT and telecommunication, government, defense, manufacturing, healthcare, retail and e-commerce, automotive, logistics and transportation, power and utilities, oil and gas, education and others. The Healthcare segment in the Artificial Intelligence Market is expected to grow the fastest at a CAGR of 39.5%, during the forecast period 2024-2030. The healthcare sector is increasingly opting for AI technology to upgrade medical infrastructure and establish precise, real-time monitoring systems to deliver unhindered medical care services. In March 2023, Medtronic and NVIDIA collaborated to integrate Holoscan and IGX, NVIDIA's real-time AI software, into medical devices, aiming to enhance AI innovation and accelerate medical device development.
Artificial Intelligence Market Segment Analysis - by Geography
The Artificial Intelligence Market by geography is segmented into North America, Europe, APAC, South America and RoW. North America held the largest market share of 38% in the Artificial Intelligence Market in terms of revenue, in 2023. The widescale use of AI in this region is due to the government's efforts to encourage the adoption of AI-enabled solutions for the effective management of internet systems and delivery of uninterrupted services. Growing e-commerce and online streaming segments are also boosting demand for AI-based automated systems. According to Networking and Information Technology Research and Development U. S. government spent on artificial intelligence (AI) contracts hit $3.3 billion in fiscal year 2022. This investment highlights substantial market growth, emphasizing AI's increasing significance and demand.
Artificial Intelligence Market Drivers
The increased deployment of AI in the Education sector for modernizing infrastructure with intelligent connected devices to deliver uninterrupted education:
The teaching and learning processes have been greatly improved in recent years using AI in the education industry. AI-powered solutions are being rapidly adopted by EdTech companies to modernize iinfrastructure with intelligent connected devices and provide continuous education to consumers from anywhere in the world. AI offers several benefits, such as personalized material, tutoring, 24-hour access and task automation. AIM, NITI Aayog, CBSE, and Intel India initiates a groundbreaking collaboration, investing USD 1.35 billion in Artificial Intelligence (AI) over the next five years to revolutionize education. This strategic investment aims to integrate AI solutions, fostering innovation and enhancing the learning landscape.
The widespread use of AI in defense for upgrading the security and networking infrastructure with intelligent features:
AI-based technology is being rapidly adopted by the defense industry in several domains, including security systems and medical devices. AI-based military equipment handles a massive amount of data and remote monitoring systems more effectively. In July 2022, the Defense Minister of India launched 75 newly developed Artificial Intelligence (AI) products/technologies during the first-ever 'AI in Defense' symposium and exhibition, organized by the Ministry of Defense in New Delhi. AI-based products launched include AI platform automation, autonomous/unmanned/Robotics systems and intelligent monitoring systems with 90% enhanced productivity.
Artificial Intelligence Market Challenge
High Initial cost of setting up AI in a system or product:
The development of AI-based systems requires lots of time, resources, a skilled workforce and significant monetary investments. The development of AI-based systems requires updated hardware and software. It also requires highly skilled AI/ML engineers who demand a high pay range. The overall production cost is quite expensive and not affordable for all. According to Aalpha company, AI will cost at least $35,000 to build a customized analysis system, while it will cost $60000 to create a customized chatbot. 80% of medium and small businesses with restricted budgets cannot afford the high budget to create their own AI solutions, which could impede market expansion.
Key Market Players
Product launches, collaborations and R&D activities are key strategies adopted by players in the Artificial Intelligence Market. The top 10 companies in the Artificial Intelligence market are:
- Google LLC
- Microsoft Corporation
- Intel Corporation
- Samsung Electronics Co., Ltd.
- IBM Corporation
- Amazon Web Services Inc.
- Oracle Corporation
- Salesforce, Inc.
- Siemens AG
- Huawei Technologies Co., Ltd.
Recent Developments
● In February 2022, Forbes in their Artificial Intelligence market report stated that 50% of enterprises planned to spend more on AI-based cloud computing and machine learning to enhance customer relationship management in 2021.
● In July 2022, IBM Corporation strategically acquired Databand.ai, enhancing its data observability capabilities in the AI landscape. This acquisition aligns with IBM's commitment to bolstering its hybrid cloud and AI expertise, reinforcing its position to capture emerging opportunities in the rapidly growing market for data observability.
For more Information and Communications Technology Market reports, please click here
1. Artificial Intelligence Market Overview
1.1 Definitions and Scope
2. Artificial Intelligence Market - Executive Summary
2.1 Market Revenue, Market Size and Key Trends by Company
2.2 Key trends By Product Type
2.3 Key trends segmented by Geography
3. Artificial Intelligence Market – Market Landscape
3.1 Comparative Analysis
3.1.1 Product/Company Benchmarking - Top 5 Companies
3.1.2 Top 5 Financial Analysis
3.1.3 Market Value Split by Top 5 Companies
3.1.4 Patent Analysis
3.1.5 Pricing Analysis (Comparison of General Price Offerings in the Market)
4. Artificial Intelligence Market – Market Entry Scenario Premium
4.1 Regulatory Scenario
4.2 Ease of Doing Business Index
4.3 Case Studies
4.4 Customer Analysis
5. Artificial Intelligence Market – Startup Company Scenario
5.1 Venture Capital and Funding Scenario
5.2 Startup Company Analysis
6. Artificial Intelligence Market - Market Forces
6.1 Market Drivers
6.2 Market Constraints
6.3 Porter’s five force model
6.3.1 Bargaining power of suppliers
6.3.2 Bargaining powers of customers
6.3.3 Threat of new entrants
6.3.4 Rivalry among existing players
6.3.5 Threat of substitutes
7. Artificial Intelligence Market – Strategic Analysis
7.1 Value Chain Analysis
7.2 Opportunities Analysis
7.3 Product Life Cycle/Market Life Cycle Analysis
7.4 Suppliers and Distributors
8. Artificial Intelligence Market – by Offering (Market Size - $Million/Billion)
8.1 Hardware
8.2 Software
8.3 Services
9. Artificial Intelligence Market – by Technology (Market Size - $Million/Billion)
9.1 Machine Learning
9.2 Natural Language Processing
9.3 Context-aware Computing
9.4 Computer Vision
10. Artificial Intelligence Market – by Deployment (Market Size - $Million/Billion)
10.1 On-premises
10.2 Cloud
11. Artificial Intelligence Market – by Organization Size (Market Size - $Million/Billion)
11.1 Small and Medium Enterprises
11.2 Large Enterprises
12. Artificial Intelligence Market – by Product (Market Size - $Million/Billion)
12.1 Medical devices
12.2 Connected Consumer Devices
12.3 Smart Wearables
12.4 Home appliances
12.5 Electronic gadgets
12.6 Mobiles
12.7 Laptop & PCs
12.8 Robots
12.9 Industrial Systems
12.10 Cameras
12.11 AR/VR
12.12 Drones
12.13 Others
13. Artificial Intelligence Market – by Application (Market Size - $Million/Billion)
13.1 Industrial processes
13.2 Medical Assistance and Diagnosis
13.3 Marketing and sales
13.4 Security systems
13.5 Finance
13.6 Supply chain management
13.7 Service deployment
13.8 Cloud computing
13.9 Customer relationship management
13.10 Data analysis
13.11 Facial recognition technology
13.12 Fraud detection
13.13 Predictive analysis
13.14 Others
14. Artificial Intelligence Market - by End-users (Market Size - $Million/Billion)
14.1 BFSI
14.2 IT and Telecommunication
14.3 Government
14.4 Defense
14.5 Consumer Electronics
14.6 Manufacturing
14.7 Healthcare
14.8 Retail and E-commerce
14.9 Automotive
14.10 Logistics and Transportation
14.11 Power and Utilities
14.12 Oil and Gas
14.13 Education
14.14 Others
15. Artificial Intelligence Market - by Geography (Market Size - $Million/Billion)
15.1 North America
15.1.1 The US
15.1.2 Canada
15.1.3 Mexico
15.2 South America
15.2.1 Brazil
15.2.2 Argentina
15.2.3 Chile
15.2.4 Colombia
15.2.5 The Rest of South America
15.3 Europe
15.3.1 Germany
15.3.2 France
15.3.3 The UK
15.3.4 Italy
15.3.5 Spain
15.3.6 Russia
15.3.7 The Netherlands
15.3.8 The Rest of Europe
15.4 APAC
15.4.1 China
15.4.2 Japan
15.4.3 South Korea
15.4.4 India
15.4.5 Australia
15.4.6 Indonesia
15.4.7 Malaysia
15.4.8 Others
15.5 RoW
15.5.1 The Middle East
15.5.2 Africa
16. Artificial Intelligence Market - Market Entropy
16.1 New product launches
16.2 M&As, collaborations, JVs and partnerships
17. Artificial Intelligence Market – Industry Competition Landscape
17.1 Market Share Global
17.2 Market Share by Region
17.3 Market Share by End-user
17.4 Competition Matrix
18. Artificial Intelligence Market – Key Company List by Country Premium
19. Artificial Intelligence Market - Company Analysis
19.1 Google LLC
19.2 Microsoft Corporation
19.3 Intel Corporation
19.4 Samsung Electronics Co., Ltd.
19.5 IBM Corporation
19.6 Amazon Web Services Inc.
19.7 Oracle Corporation
19.8 Salesforce, Inc.
19.9 Siemens AG
19.10 Huawei Technologies Co., Ltd.
* "Financials would be provided to private companies on best-efforts basis."
List of Tables:
Table 1: Global: Artificial Intelligence in Education Market Value (Revenue), By Type (2015-2023), $Million
Table 2: Major Acquisitions In Artificial Intelligence Since 2013
Table 3: Artificial Intelligence in Education Market Revenue, By Application, 2015-2023 ($Million)
Table 4: Artificial Intelligence in Education Market Revenue, By Model, 2015-2023 ($Million)
Table 5: Artificial Intelligence in Education Market Revenue, By Base Type, 2016-2021 ($Million)
Table 6: Global: Artificial Intelligence in Education Market Value (Revenue), By Geography (2015-2023), $Million
Table 7: North America: Artificial Intelligence in Education Market Value (Revenue), By Type (2015-2023), $Million
Table 8: North America: Artificial Intelligence in Education Market Value (Revenue), By Application (2015-2023), $Million
Table 9: North America: Artificial Intelligence in Education Market Value (Revenue), By Model (2015-2023), $Million
Table 10: North America: Artificial Intelligence in Education Market Value (Revenue), By Base Type (2015-2023), $Million
Table 11: U.S.: GDP – Composition of 2015, By End Use
Table 12: Canada : GDP – Composition of 2015, By End Use
Table 13: Mexico: GDP – Composition of 2015, By End Use
Table 14: Europe: Artificial Intelligence in Education Market Value (Revenue), By Type (2015-2023), $Million
Table 15: Europe: Artificial Intelligence in Education Market Value (Revenue), By Application (2015-2023), $Million
Table 16: Europe: Artificial Intelligence in Education Market Value (Revenue), By Model (2015-2023), $Million
Table 17: Europe: Artificial Intelligence in Education Market Value (Revenue), By Base Type (2015-2023), $Million
Table 18: U.K.: GDP – Composition of 2015, By End Use
Table 19: Germany: GDP – Composition of 2015, By End Use
Table 20: France: GDP – Composition of 2015, By End Use
Table 21: Spain: GDP – Composition of 2015, By End Use
Table 22: Italy : GDP – Composition of 2015, By End Use
Table 23: Asia-Pacific: Artificial Intelligence in Education Market Value (Revenue), By Type (2015-2023), $Million
Table 24: Asia-Pacific: Artificial Intelligence in Education Market Value (Revenue), By Application (2015-2023), $Million
Table 25: Asia-Pacific: Artificial Intelligence in Education Market Value (Revenue), By Model (2015-2023), $Million
Table 26: Asia-Pacific: Artificial Intelligence in Education Market Value (Revenue), By Base Type (2015-2023), $Million
Table 27: China: GDP – Composition of 2015, By End Use
Table 28: Japan: GDP – Composition of 2015, By End Use
Table 29: India: GDP – Composition of 2015, By End Use
Table 30: South Korea: GDP – Composition of 2015, By End Use
Table 31: Row: Artificial Intelligence in Education Market Value (Revenue), By Type (2015-2023), $Million
Table 32: Row: Artificial Intelligence in Education Market Value (Revenue), By Application (2015-2023), $Million
Table 33: Row: Artificial Intelligence in Education Market Value (Revenue), By Model (2015-2023), $Million
Table 34: Row: Artificial Intelligence in Education Market Value (Revenue), By Base Type (2015-2023), $Million
List of Figures:
Figure 1: Global: Artificial Intelligence in Education Market Value (Revenue), By Type (2015-2023), $Million
Figure 2: Artificial Intelligence Market in Education Revenue, By Type, 2015 - 2023(%)
Figure 3: Artificial Intelligence Market in Education Revenue, By Region, 2015 -2023(%)
Figure 4: Artificial Intelligence Market in Education Market Share Analysis, By Company 2016 (%)
Figure 5: Artificial Intelligence Patents, 2012-2018 (*Oct)
Figure 6: Artificial Intelligence: Patents Share, By Countries, 2012-2018 (%)
Figure 7: IBM Corporation
Figure 8: Microsoft Corporation
Figure 9: NVIDIA Corporation
Figure 10: Intel Corporation
Figure 11: EPS Comparison
Figure 12: Artificial Intelligence Market in Education Lifecycle
Figure 13: Natural Language Processing: Global Artificial Intelligence in Education Market Value (Revenue), By Type (2015-2023), $Million
Figure 14: Audio Analytics: Global Artificial Intelligence in Education Market Value (Revenue), By Type (2015-2023), $Million
Figure 15: Machine Learning& Image processing: Global Artificial Intelligence in Education Market Value (Revenue), By Type (2015-2023), $Million
Figure 16: Class Teaching: Global Artificial Intelligence in Education Market Value (Revenue), By Type (2015-2023), $Million
Figure 17: Online Tutors: Global Artificial Intelligence in Education Market Value (Revenue), By Type (2015-2023), $Million
Figure 18: Virtual Facilitators& Learning Environments: Global Artificial Intelligence in Education Market Value (Revenue), By Type (2015-2023), $Million
Figure 19: Others: Global Artificial Intelligence in Education Market Value (Revenue), By Type (2015-2023), $Million
Figure 20: Artificial Intelligence in Education Market – By Application
Figure 21: Artificial Intelligence in Education Market Share, By Application, 2016, (%)
Figure 22: Adaptive Learning: Artificial Intelligence in Education Market Revenue, 2015-2023 ($Million)
Figure 23: Insights and Virtual Environment: Artificial Intelligence in Education Market Revenue, 2015-2023 ($Million)
Figure 24: Others: Artificial Intelligence in Education Market Revenue, 2015-2023 ($Million)
Figure 25: Artificial Intelligence in Education Market – By Model
Figure 26: Artificial Intelligence in Education Market Revenue, By Model, 2016, (%)
Figure 27: Learner Model: Artificial Intelligence in Education Market Revenue, 2015-2023 ($Million)
Figure 28: Pedagogical Model: Artificial Intelligence in Education Market Revenue, 2015-2023 ($Million)
Figure 29: Domain Model: Artificial Intelligence in Education Market Revenue, 2015-2023 ($Million)
Figure 30: Others: Artificial Intelligence in Education Market Revenue, 2015-2023 ($Million)
Figure 31: Artificial Intelligence in Education Market – By Base Type
Figure 32: Artificial Intelligence in Education Market Revenue, By Base Type, 2016, (%)
Figure 33: Web Base: Artificial Intelligence in Education Market Revenue, 2015-2023 ($Million)
Figure 34: App Base: Artificial Intelligence in Education Market Revenue, 2015-2023 ($Million)
Figure 35: U.S.: GDP and Population, 2012-2015 ($Trillion, Million)
Figure 36: U.S.: GDP – Composition of 2015, By Sector of Origin
Figure 37: U.S.: Export and Import Value, 2012-2015 ($Trillion)
Figure 38: U.S.: Artificial Intelligence in Education Market Revenue, 2015—2023 ($Million)
Figure 39: Canada: GDP and Population, 2012-2015 ($Trillion, Million)
Figure 40: Canada: GDP – Composition of 2015, By Sector of Origin
Figure 41: Canada : Export and Import Value, 2012-2015 ($Billion)
Figure 42: Canada: Artificial Intelligence in Education Market Revenue, 2018—2023 ($Million)
Figure 43: Mexico: GDP and Population, 2012-2015 ($Trillion, Million)
Figure 44: Mexico: GDP – Composition of 2015, By Sector of Origin
Figure 45: Mexico: Export and Import Value, 2012-2015 ($Billion)
Figure 46: Mexico: Artificial Intelligence in Education Market Revenue, 201—2023 ($Million)
Figure 47: U.K.: GDP and Population, 2012-2015 ($Trillion, Million)
Figure 48: U.K.: GDP – Composition of 2015, By Sector of Origin
Figure 49: U.K.: Export and Import Value, 2012-2015 ($Billion)
Figure 50: U.K.: Artificial Intelligence in Education Market Revenue, 2015-2023 ($Million)
Figure 51: Germany: GDP and Population, 2012-2015 ($Trillion, Million)
Figure 52: Germany: GDP – Composition of 2015, By Sector of Origin
Figure 53: Germany: Export and Import Value, 2012-2015 ($Billion)
Figure 54: Germany: Artificial Intelligence in Education Market Revenue, 2015-2023 ($Million)
Figure 55: France: GDP and Population, 2012-2015 ($Trillion, Million)
Figure 56: France: GDP – Composition of 2015, By Sector of Origin
Figure 57: France: Export and Import Value, 2012-2015 ($Billion)
Figure 58: France: Artificial Intelligence in Education Market Revenue, 2015-2023 ($Million)
Figure 59: Spain: GDP and Population, 2012-2015 ($Trillion, Million)
Figure 60: Spain: GDP – Composition of 2015, By Sector of Origin
Figure 61: Spain: Export and Import Value, 2012-2015 ($Billion)
Figure 62: Spain: Artificial Intelligence in Education Market Revenue, 2015-2023 ($Million)
Figure 63: Italy: GDP and Population, 2012-2015 ($Trillion, Million)
Figure 64: Italy: GDP – Composition of 2015, By Sector of Origin
Figure 65: Italy : Export and Import Value, 2012-2015 ($Billion)
Figure 66: Italy: Artificial Intelligence in Education Market Revenue, 2015-2023 ($Million)
Figure 67: Rest of Europe: Artificial Intelligence in Education Market Revenue, 2015-2023 ($Million)
Figure 68: China: GDP and Population, 2012-2015 ($Trillion, Million)
Figure 69: China: GDP – Composition of 2015, By Sector of Origin
Figure 70: China: Export and Import Value, 2012-2015 ($Billion)
Figure 71: China: Artificial Intelligence in Education Market Revenue, 2015—2023 ($Million)
Figure 72: Japan: GDP and Population, 2012-2015 ($Trillion, Million)
Figure 73: Japan: GDP – Composition of 2015, By Sector of Origin
Figure 74: Japan: Export and Import Value, 2012-2015 ($Billion)
Figure 75: Japan: Artificial Intelligence in Education Market Revenue, 2015—2023 ($Million)
Figure 76: India: GDP and Population, 2012-2015 ($Trillion, Million)
Figure 77: India: GDP – Composition of 2015, By Sector of Origin
Figure 78: India: Export and Import Value, 2012-2015 ($Billion)
Figure 79: India: Artificial Intelligence in Education Market Revenue, 2015 -2023 ($Million)
Figure 80: South Korea: GDP and Population, 2012-2015 ($Trillion, Million)
Figure 81: South Korea: GDP – Composition of 2015, By Sector of Origin
Figure 82: South Korea: Export and Import Value, 2012-2015 ($Billion)
Figure 83: South Korea: Artificial Intelligence in Education Market Revenue, 2015—2023 ($Million)
Figure 84: Rest of Asia-Pacific : Artificial Intelligence in Education Market Revenue, 2015—2023 ($Million)
Figure 85: Middle East: Artificial Intelligence in Education Market Revenue, 2015-2023 ($Million)
Figure 86: Africa: Artificial Intelligence in Education Market Revenue, 2015-2023 ($Million)
Figure 87: Artificial Intelligence in Education Market Entropy Share, By Strategies (2012-2018*)
Figure 88: Artificial Intelligence in Education: Total Developments, By Year, 2012-2018*
Figure 89: Artificial Intelligence in Education: Total Number of Developments, By companies, 2012-2018*
Figure 90: IBM, Revenue, 2013-2016 ($Billion)
Figure 91: IBM, Revenue, by segment, 2016 (%)
Figure 92: IBM, Market Revenue, by Geography, 2016 (%)
Figure 93: Nuance Communications Inc., Revenue, 2013-2016 ($Billion)
Figure 94: Nuance Communications, Revenue, by segment, 2015 (%)
Figure 95: Naunce Communications, Revenue, by Geography, 2015
Figure 96: Microsoft, Revenue, 2013-2016 ($ Billion)
Figure 97: Microsoft, Revenue, By Geography, 2016
Figure 98: Microsoft, Revenue, By Business Segment, 2016
Figure 99: Pearson, Sales, by year 2015-2016 ($ billion)
Figure 100: Pearson, Sales, By Products & Services
Figure 101: Pearson, Sales, By Geographic Regions