 Email
Email Print
Print


Australia Professional Hair Care Market Research Report- Market size, Industry outlook, Market Forecast, Demand Analysis, Market Share, Market Report 2024-2030
Australia Professional Hair Care Market Overview:
Australia Professional Hair Care Market size is estimated to reach $312 million by 2030, growing at a CAGR of 2.1% during the forecast period 2024-2030. Professional hair care products include shampoos, conditioners, hair masks, coloring products and hair styling products, including hair serums, mousses, hairsprays, and more for all kinds of hair types and textures. These products are applied to manage hair problems such as hair loss, dandruff, frizzy hair, itchy or dry scalp, split ends and more. Increased consumer spending on hair care products, rising demand for chemical-free hair care products, growing demand for clean hair care and the increasing influence of social media are the major factors that are set to drive the growth of the Australia Professional Hair Care market during the forecast period 2024-2030.
A major trend in the market is sustainability. The growing emphasis on sustainability and has driven a surge in demand for hair care products with organic and eco-friendly ingredients. Apart from the ingredients, there is also a focus on the packaging. Consumers prefer products that come in eco conscious packaging and are refillable. In March 2022, an Australian start up, Uni launched a line of high-performance body and hair-care products that use a two-part reusable packaging system made up of an aluminum shell and an aluminum refill bottle. The formulations feature Marine Complex, a combination of marine actives and ingredients, combined with super plants. According to the company, all marine extracts are sourced ethically from environmentally sustainable resources.
Australia Professional Hair Care Market - Report Coverage:
The “Australia Professional Hair Care Market Report - Forecast (2024-2030)” by IndustryARC, covers an in-depth analysis of the following segments in the Australia Professional Hair Care Market.
| Attribute | Segment |
|---|---|
|
By Gender |
|
|
By Product |
· Straightening & Perming
|
|
By Type |
|
|
By Distribution Channels |
|
Key Takeaways:
-
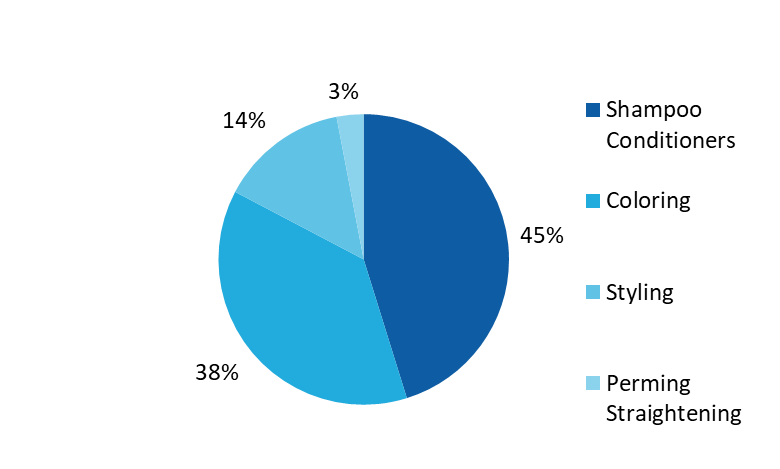
Shampoo is the largest segment
Shampoos and conditioners dominate the Australian professional hair care market due to their essential role in daily hair care routines and widespread consumer demand. These products are used by almost everyone regardless of hair type or styling preferences. In Australia the climate ranges from dry to humid, consumers seek specialized shampoos and conditioners that address specific needs like hydration, color protection and damage repair. The professional market caters to these demands by offering high-quality, salon-grade products that promise superior results compared to mass-market alternatives. Additionally, the consumers are shifting towards organic, natural and eco friendly products. For instance, in February 2024, A’kin redeveloped its popular shampoo and conditioner with Australian botanicals to cater to the demand for natural hair care products.
-
Rise in Clean Hair Care
The rise of clean hair care is a significant driver in the Australian professional hair care market reflecting a broader global shift towards health-conscious and environmentally responsible products. Australian consumers are increasingly prioritizing hair care products that are free from harmful chemicals such as sulfates, parabens and silicones. These chemicals are linked to health concerns and environmental damage, as a result consumers seek products free from such chemicals. In July 2023, Vanessa Megan Naturaceuticals unveiled a haircare range made from 100% natural ingredients. The range features a Bamboo and Rosemary Shampoo and a Yuzu and Rice Protein Conditioner.
-
Fastest Growth for Organic Products
By type, the organic products are expected to grow with the fastest CAGR in the Australian professional hair care market during 2024-2030. Consumers are becoming more educated about the potential risks of synthetic chemicals and are turning towards organic alternatives that promise purity and safety. Organic hair care products made from natural ingredients are perceived as healthier and more environmentally friendly. This shift is particularly strong in Australia as a significant portion of consumers value sustainability and are willing to pay a premium for products that align with their ethical and environmental values. In May 2021, Nature Organics launched a new range of shampoos and conditioners, My Soda Australia which are locally made, vegan certified and cruelty free, made using naturally derived plant-based ingredients.
-
Increasing Prices of Professional Products and Services
A significant challenge facing the Australian professional hair care market is the rising prices of products and services. As the cost of premium ingredients, sustainable packaging and advanced formulations increases, professional hair care brands are becoming expensive. Additionally, operational costs for salons including rent, wages, and utilities, continue to rise, further driving up the prices of professional services. This trend risks makes consumers opt for more affordable mass-market alternatives or reduce their salon visits. Additionally, with the growing popularity of online shopping, DIY has become quite popular with many consumers deciding to opt for DIY hair care instead of visiting a salon.
Australia Professional Hair Care Market: Market Share (%) by Product, 2023
Key Market Players:
Product/Service launches, approvals, patents and events, acquisitions, partnerships and collaborations are key strategies adopted by players in the Australia Professional Hair Care Market. The top 10 companies in the Australia Professional Hair Care market are:
1. L'Oreal Group
2. Procter & Gamble
3. Kao Corporation
4. Henkel AG & Co. KGaA
5. Johnson & Johnson
6. Revlon Inc.
7. Unilever Ltd.
8. Muk Haircare
9. Eleven Australia
10. NAK Hair
Scope of Report:
| Report Metric | Details |
|---|---|
|
Market size available for years |
2023–2030 |
|
Base year considered |
2023 |
|
Forecast period |
2024–2030 |
|
Forecast units |
Value (USD) |
|
Segments covered |
Gender, Product, Type and Distribution Channels |
|
Companies covered |
Key 10 players covered include 1. L'Oreal Group 2. Procter & Gamble 3. Kao Corporation 4. Henkel AG & Co. KGaA 5. Johnson & Johnson 6. Revlon Inc. 7. Unilever Ltd. 8. Muk Haircare 9. Eleven Australia 10. NAK Hair
|
For more Consumer Products and Services Market related reports, please click here.
The Australia Professional Hair Care Market is forecast to grow at 2.1% during the forecast period 2024-2030.
The Australia Professional Hair Care Market size is projected to reach US$312 million by 2030.
L\\\'Oreal Group, Procter & Gamble, Kao Corporation, Henkel AG & Co. KGaA, Johnson & Johnson and others.
Increasing customer awareness regarding hair protection, high internet penetration leading to increased social media usage and influencers are the major trends.
Increased consumer demand for professional hair care products, rising demand for chemical-free hair care products, growing demand for clean hair care, and the increasing influence of social media are driving the Australia Professional Hair Care Market growth.