 Email
Email Print
Print


Gesture Recognition in Consumer Electronics Market - By Products , By Technology , By Geography - Forecast (2024 - 2030)
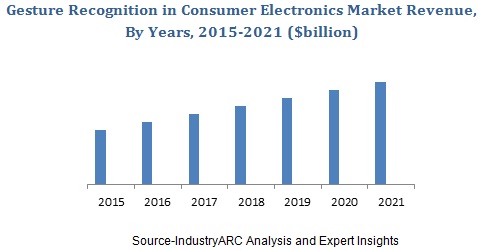
Gesture Recognition in Consumer Electronics Market Size is forecast to reach $ 39413.6 Million by 2030, at a CAGR of 34.90% during forecast period 2024-2030. The key factor for the growth of this market is the simplicity in and ease of use in using the gesture recognition enabled products. Though gesture recognition is comparatively new technology, its user friendly nature enables the consumer to favor it and adopt the same. The other important driver of this market is the ability of gesture recognition technology to provide improved ergonomics to many consumer devices. APAC market is expected to surpass $2411 million by 2023 growing at a CAGR of 34.90% from 2024 to 2030. Smart phones are dominating the market in consumer electronics industry; hence the gesture recognition technology in these smart phones is also growing rapidly. Gesture recognition in smart phone market is expected to surpass $872 million by 2023 growing at a CAGR of 34.90% from 2024 to 2030.
What is Gesture Recognition?
Gesture Recognition refers to a technology that identifies human gesture to communicate and control the electronic devices. Gesture refers to movements of fingers, hands, body and other physiological controls. This technology uses different sensors like infrared sensors, image sensors among others to recognize and interact with the devices. This increases stability and accuracy for real time applications as it doesn’t need any physical input or mechanical devices to communicate with the devices. Gesture recognition caters its application primarily in man-machine interaction, creation of 3D animation, gaming devices, control of mechanical systems, visualization and many more.
What are the major applications of Gesture Recognition ?
The major application of Gesture Recognition in consumer electronics include smart phones, tablets, laptops, PCs, televisions, set top boxes, and others. Gesture recognition in smart television enables the viewers to control their smart TVs with finger and hand gestures. Smart TVs recognition engine tries to match user’s hand gestures to predefined set of gestures. This operation can be performed locally by the TV. The gesture recognition software can either directly be integrated on smart TV platform or it can be used on an accessory camera.
Gesture recognition for PCs and desktops has been one of the trending aspects in the modern world of gadgetry. Human gesture recognition is one of the newest ways to input information or control a computer. This gesture recognition technology enables the user to naturally and intuitively interact with the computer making the PC viewing and usage experience more interactive and realistic.
Market Research and Market Trends of Gesture Recognition
- A new technology has been launched for easy deployment of motion based user interfaces for future connected home systems which offer an intuitive and smart way to control interactive content through hand and finger gestures.
- Logbar designed a smart wearable input device ring which enables the user to perform many tasks that include gesture control of smart appliances and devices synced to it, send texts, pay bills etc. with the help of finger movements.
- Research is being done to develop a chip that could be used for gesture recognition on headsets and smart watches using ultrasound gesture recognizer technology, unlike the devices that use light to recognize hand gestures.
Who are the Major Players in Gesture Recognition Market ?
The companies referred in the market research report include Microsoft Corporation (U.S.), Samsung Electronics (South Korea), Intel Corporation (U.S.), Sony Corporation (Japan), Texas Instruments (U.S.), Soft Kinetic (Belgium) more than 10 other companies.
What is our report scope?
The report incorporates in-depth assessment of the competitive landscape, product market sizing, product benchmarking, market trends, product developments, financial analysis, strategic analysis and so on to gauge the impact forces and potential opportunities of the market. Apart from this the report also includes a study of major developments in the market such as product launches, agreements, acquisitions, collaborations, mergers and so on to comprehend the prevailing market dynamics at present and its impact during the forecast period 2018-2023.
All our reports are customizable to your company needs to a certain extent, we do provide 20 free consulting hours along with purchase of each report, and this will allow you to request any additional data to customize the report to your needs.
Key Takeaways from this Report
- Evaluate market potential through analyzing growth rates (CAGR %), Volume (Units) and Value ($M) data given at country level – for product types, end use applications and by different industry verticals.
- Understand the different dynamics influencing the market – key driving factors, challenges and hidden opportunities.
- Get in-depth insights on your competitor performance – market shares, strategies, financial benchmarking, product benchmarking, SWOT and more.
- Analyze the sales and distribution channels across key geographies to improve top-line revenues.
- Understand the industry supply chain with a deep-dive on the value augmentation at each step, in order to optimize value and bring efficiencies in your processes.
- Get a quick outlook on the market entropy – M&A’s, deals, partnerships, product launches of all key players for the past 4 years.
- Evaluate the supply-demand gaps, import-export statistics and regulatory landscape for more than top 20 countries globally for the market.
Key Market Players:
The Top 5 companies in the Gesture Recognition in Consumer Electronics Market are:
- Texas Instruments
- Samsung Elelctronics
- Infineon Technologies
- Intel
- Apple
For more Electronics Market reports, please click here
1. Gesture Recognition Market - Overview
1.1. Definitions and Scope
2. Gesture Recognition Market - Executive summary
2.1. Market Revenue, Market Size and Key Trends by Company
2.2. Key Trends by type of Application
2.3. Key Trends segmented by Geography
3. Gesture Recognition Market
3.1. Comparative analysis
3.1.1. Product Benchmarking - Top 10 companies
3.1.2. Top 5 Financials Analysis
3.1.3. Market Value split by Top 10 companies
3.1.4. Patent Analysis - Top 10 companies
3.1.5. Pricing Analysis
4. Gesture Recognition Market – Startup companies Scenario Premium
4.1. Top 10 startup company Analysis by
4.1.1. Investment
4.1.2. Revenue
4.1.3. Market Shares
4.1.4. Market Size and Application Analysis
4.1.5. Venture Capital and Funding Scenario
5. Gesture Recognition Market – Industry Market Entry Scenario Premium
5.1. Regulatory Framework Overview
5.2. New Business and Ease of Doing business index
5.3. Case studies of successful ventures
5.4. Customer Analysis – Top 10 companies
6. Gesture Recognition Market Forces
6.1. Drivers
6.2. Constraints
6.3. Challenges
6.4. Porters five force model
6.4.1. Bargaining power of suppliers
6.4.2. Bargaining powers of customers
6.4.3. Threat of new entrants
6.4.4. Rivalry among existing players
6.4.5. Threat of substitutes
7. Gesture Recognition Market -Strategic analysis
7.1. Value chain analysis
7.2. Opportunities analysis
7.3. Product life cycle
7.4. Suppliers and distributors Market Share
8. Gesture Recognition Market – By Types (Market Size -$Million / $Billion)
8.1. Market Size and Market Share Analysis
8.2. Application Revenue and Trend Research
8.3. Product Segment Analysis
8.3.1. Introduction
8.3.2. Hand Gestures
8.3.3. Facial Expressions
8.3.4. Body Movements
8.3.5. Finger Gestures
9. Gesture Recognition Market – By Products (Market Size -$Million / $Billion)
9.1. Introduction
9.2. Gaming Devices
9.3. Smartphones
9.4. Tablets
9.5. Laptops
9.6. PCs
9.7. Smart Televisions
9.8. Set Top Boxes
9.9. Wearable Devices
9.10. Others
10. Gesture Recognition Market – By Gesture Recognition Technology (Market Size -$Million / $Billion)
10.1. Introduction
10.2. Interactive Displays
10.3. Camera based recognition 2D & 3D
10.4. Infrared Sensing
10.5. Capacitive Sensing
10.6. Ultrasonic Sensing
10.7. Electric Near Field
10.8. MEMS
10.9. Others
11. Gesture Recognition - By Geography (Market Size -$Million / $Billion)
11.1. Gesture Recognition Market - North America Segment Research
11.2. North America Market Research (Million / $Billion)
11.2.1. Segment type Size and Market Size Analysis
11.2.2. Revenue and Trends
11.2.3. Application Revenue and Trends by type of Application
11.2.4. Company Revenue and Product Analysis
11.2.5. North America Product type and Application Market Size
11.2.5.1. U.S.
11.2.5.2. Canada
11.2.5.3. Mexico
11.2.5.4. Rest of North America
11.3. Gesture Recognition - South America Segment Research
11.4. South America Market Research (Market Size -$Million / $Billion)
11.4.1. Segment type Size and Market Size Analysis
11.4.2. Revenue and Trends
11.4.3. Application Revenue and Trends by type of Application
11.4.4. Company Revenue and Product Analysis
11.4.5. South America Product type and Application Market Size
11.4.5.1. Brazil
11.4.5.2. Venezuela
11.4.5.3. Argentina
11.4.5.4. Ecuador
11.4.5.5. Peru
11.4.5.6. Colombia
11.4.5.7. Costa Rica
11.4.5.8. Rest of South America
11.5. Gesture Recognition - Europe Segment Research
11.6. Europe Market Research (Market Size -$Million / $Billion)
11.6.1. Segment type Size and Market Size Analysis
11.6.2. Revenue and Trends
11.6.3. Application Revenue and Trends by type of Application
11.6.4. Company Revenue and Product Analysis
11.6.5. Europe Segment Product type and Application Market Size
11.6.5.1. U.K
11.6.5.2. Germany
11.6.5.3. Italy
11.6.5.4. France
11.6.5.5. Netherlands
11.6.5.6. Belgium
11.6.5.7. Spain
11.6.5.8. Denmark
11.6.5.9. Rest of Europe
11.7. Gesture Recognition – APAC Segment Research
11.8. APAC Market Research (Market Size -$Million / $Billion)
11.8.1. Segment type Size and Market Size Analysis
11.8.2. Revenue and Trends
11.8.3. Application Revenue and Trends by type of Application
11.8.4. Company Revenue and Product Analysis
11.8.5. APAC Segment – Product type and Application Market Size
11.8.5.1. China
11.8.5.2. Australia
11.8.5.3. Japan
11.8.5.4. South Korea
11.8.5.5. India
11.8.5.6. Taiwan
11.8.5.7. Malaysia
12. Gesture Recognition Market - Entropy
12.1. New product launches
12.2. M&A's, collaborations, JVs and partnerships
13. Gesture Recognition Market – Industry / Segment Competition landscape Premium
13.1. Market Share Analysis
13.1.1. Market Share by Country- Top companies
13.1.2. Market Share by Region- Top 10 companies
13.1.3. Market Share by type of Application – Top 10 companies
13.1.4. Market Share by type of Product / Product category- Top 10 companies
13.1.5. Market Share at global level- Top 10 companies
13.1.6. Best Practises for companies
14. Gesture Recognition Market – Key Company List by Country Premium
15. Gesture Recognition Market Company Analysis
15.1. Market Share, Company Revenue, Products, M&A, Developments
15.2. Microsoft Corporation (U.S.)
15.3. Samsung Electronics (South Korea)
15.4. Intel Corporation (U.S.)
15.5. Sony Corporation (Japan)
15.6. Texas Instruments (U.S.)
15.7. Soft Kinetic (Belgium)
"*Financials would be provided on a best efforts basis for private companies"
16. Gesture Recognition Market -Appendix
16.1. Abbreviations
16.2. Sources
17. Gesture Recognition Market -Methodology Premium
17.1. Research Methodology
17.1.1. Company Expert Interviews
17.1.2. Industry Databases
17.1.3. Associations
17.1.4. Company News
17.1.5. Company Annual Reports
17.1.6. Application Trends
17.1.7. New Products and Product database
17.1.8. Company Transcripts
17.1.9. R&D Trends
17.1.10. Key Opinion Leaders Interviews
17.1.11. Supply and Demand Trends
List of Tables
Table 1: Gesture Recognition in Consumer Electronics Market Overview 2023-2030
Table 2: Gesture Recognition in Consumer Electronics Market Leader Analysis 2023-2024 (US$)
Table 3: Gesture Recognition in Consumer Electronics Market Product Analysis 2023-2024 (US$)
Table 4: Gesture Recognition in Consumer Electronics Market End User Analysis 2023-2024 (US$)
Table 5: Gesture Recognition in Consumer Electronics Market Patent Analysis 2021-2023* (US$)
Table 6: Gesture Recognition in Consumer Electronics Market Financial Analysis 2023-2024 (US$)
Table 7: Gesture Recognition in Consumer Electronics Market Driver Analysis 2023-2024 (US$)
Table 8: Gesture Recognition in Consumer Electronics Market Challenges Analysis 2023-2024 (US$)
Table 9: Gesture Recognition in Consumer Electronics Market Constraint Analysis 2023-2024 (US$)
Table 10: Gesture Recognition in Consumer Electronics Market Supplier Bargaining Power Analysis 2023-2024 (US$)
Table 11: Gesture Recognition in Consumer Electronics Market Buyer Bargaining Power Analysis 2023-2024 (US$)
Table 12: Gesture Recognition in Consumer Electronics Market Threat of Substitutes Analysis 2023-2024 (US$)
Table 13: Gesture Recognition in Consumer Electronics Market Threat of New Entrants Analysis 2023-2024 (US$)
Table 14: Gesture Recognition in Consumer Electronics Market Degree of Competition Analysis 2023-2024 (US$)
Table 15: Gesture Recognition in Consumer Electronics Market Value Chain Analysis 2023-2024 (US$)
Table 16: Gesture Recognition in Consumer Electronics Market Pricing Analysis 2023-2030 (US$)
Table 17: Gesture Recognition in Consumer Electronics Market Opportunities Analysis 2023-2030 (US$)
Table 18: Gesture Recognition in Consumer Electronics Market Product Life Cycle Analysis 2023-2030 (US$)
Table 19: Gesture Recognition in Consumer Electronics Market Supplier Analysis 2023-2024 (US$)
Table 20: Gesture Recognition in Consumer Electronics Market Distributor Analysis 2023-2024 (US$)
Table 21: Gesture Recognition in Consumer Electronics Market Trend Analysis 2023-2024 (US$)
Table 22: Gesture Recognition in Consumer Electronics Market Size 2023 (US$)
Table 23: Gesture Recognition in Consumer Electronics Market Forecast Analysis 2023-2030 (US$)
Table 24: Gesture Recognition in Consumer Electronics Market Sales Forecast Analysis 2023-2030 (Units)
Table 25: Gesture Recognition in Consumer Electronics Market, Revenue & Volume, By Types, 2023-2030 ($)
Table 26: Gesture Recognition in Consumer Electronics Market By Types, Revenue & Volume, By Hand Gestures, 2023-2030 ($)
Table 27: Gesture Recognition in Consumer Electronics Market By Types, Revenue & Volume, By Facial Expressions, 2023-2030 ($)
Table 28: Gesture Recognition in Consumer Electronics Market By Types, Revenue & Volume, By Body Movements, 2023-2030 ($)
Table 29: Gesture Recognition in Consumer Electronics Market By Types, Revenue & Volume, By Finger Gestures, 2023-2030 ($)
Table 30: Gesture Recognition in Consumer Electronics Market, Revenue & Volume, By Products, 2023-2030 ($)
Table 31: Gesture Recognition in Consumer Electronics Market By Products, Revenue & Volume, By Gaming Devices, 2023-2030 ($)
Table 32: Gesture Recognition in Consumer Electronics Market By Products, Revenue & Volume, By Smartphones, 2023-2030 ($)
Table 33: Gesture Recognition in Consumer Electronics Market By Products, Revenue & Volume, By Tablets, 2023-2030 ($)
Table 34: Gesture Recognition in Consumer Electronics Market By Products, Revenue & Volume, By Laptops, 2023-2030 ($)
Table 35: Gesture Recognition in Consumer Electronics Market By Products, Revenue & Volume, By PCs, 2023-2030 ($)
Table 36: Gesture Recognition in Consumer Electronics Market, Revenue & Volume, By Gesture Recognition Technology, 2023-2030 ($)
Table 37: Gesture Recognition in Consumer Electronics Market By Gesture Recognition Technology, Revenue & Volume, By Interactive Displays, 2023-2030 ($)
Table 38: Gesture Recognition in Consumer Electronics Market By Gesture Recognition Technology, Revenue & Volume, By Camera based recognition 2D & 3D, 2023-2030 ($)
Table 39: Gesture Recognition in Consumer Electronics Market By Gesture Recognition Technology, Revenue & Volume, By Infrared Sensing, 2023-2030 ($)
Table 40: Gesture Recognition in Consumer Electronics Market By Gesture Recognition Technology, Revenue & Volume, By Capacitive Sensing, 2023-2030 ($)
Table 41: Gesture Recognition in Consumer Electronics Market By Gesture Recognition Technology, Revenue & Volume, By Ultrasonic Sensing, 2023-2030 ($)
Table 42: North America Gesture Recognition in Consumer Electronics Market, Revenue & Volume, By Types, 2023-2030 ($)
Table 43: North America Gesture Recognition in Consumer Electronics Market, Revenue & Volume, By Products, 2023-2030 ($)
Table 44: North America Gesture Recognition in Consumer Electronics Market, Revenue & Volume, By Gesture Recognition Technology, 2023-2030 ($)
Table 45: South america Gesture Recognition in Consumer Electronics Market, Revenue & Volume, By Types, 2023-2030 ($)
Table 46: South america Gesture Recognition in Consumer Electronics Market, Revenue & Volume, By Products, 2023-2030 ($)
Table 47: South america Gesture Recognition in Consumer Electronics Market, Revenue & Volume, By Gesture Recognition Technology, 2023-2030 ($)
Table 48: Europe Gesture Recognition in Consumer Electronics Market, Revenue & Volume, By Types, 2023-2030 ($)
Table 49: Europe Gesture Recognition in Consumer Electronics Market, Revenue & Volume, By Products, 2023-2030 ($)
Table 50: Europe Gesture Recognition in Consumer Electronics Market, Revenue & Volume, By Gesture Recognition Technology, 2023-2030 ($)
Table 51: APAC Gesture Recognition in Consumer Electronics Market, Revenue & Volume, By Types, 2023-2030 ($)
Table 52: APAC Gesture Recognition in Consumer Electronics Market, Revenue & Volume, By Products, 2023-2030 ($)
Table 53: APAC Gesture Recognition in Consumer Electronics Market, Revenue & Volume, By Gesture Recognition Technology, 2023-2030 ($)
Table 54: Middle East & Africa Gesture Recognition in Consumer Electronics Market, Revenue & Volume, By Types, 2023-2030 ($)
Table 55: Middle East & Africa Gesture Recognition in Consumer Electronics Market, Revenue & Volume, By Products, 2023-2030 ($)
Table 56: Middle East & Africa Gesture Recognition in Consumer Electronics Market, Revenue & Volume, By Gesture Recognition Technology, 2023-2030 ($)
Table 57: Russia Gesture Recognition in Consumer Electronics Market, Revenue & Volume, By Types, 2023-2030 ($)
Table 58: Russia Gesture Recognition in Consumer Electronics Market, Revenue & Volume, By Products, 2023-2030 ($)
Table 59: Russia Gesture Recognition in Consumer Electronics Market, Revenue & Volume, By Gesture Recognition Technology, 2023-2030 ($)
Table 60: Israel Gesture Recognition in Consumer Electronics Market, Revenue & Volume, By Types, 2023-2030 ($)
Table 61: Israel Gesture Recognition in Consumer Electronics Market, Revenue & Volume, By Products, 2023-2030 ($)
Table 62: Israel Gesture Recognition in Consumer Electronics Market, Revenue & Volume, By Gesture Recognition Technology, 2023-2030 ($)
Table 63: Top Companies 2023 (US$)Gesture Recognition in Consumer Electronics Market, Revenue & Volume
Table 64: Product Launch 2023-2024Gesture Recognition in Consumer Electronics Market, Revenue & Volume
Table 65: Mergers & Acquistions 2023-2024Gesture Recognition in Consumer Electronics Market, Revenue & Volume
List of Figures
Figure 1: Overview of Gesture Recognition in Consumer Electronics Market 2023-2030
Figure 2: Market Share Analysis for Gesture Recognition in Consumer Electronics Market 2023 (US$)
Figure 3: Product Comparison in Gesture Recognition in Consumer Electronics Market 2023-2024 (US$)
Figure 4: End User Profile for Gesture Recognition in Consumer Electronics Market 2023-2024 (US$)
Figure 5: Patent Application and Grant in Gesture Recognition in Consumer Electronics Market 2021-2023* (US$)
Figure 6: Top 5 Companies Financial Analysis in Gesture Recognition in Consumer Electronics Market 2023-2024 (US$)
Figure 7: Market Entry Strategy in Gesture Recognition in Consumer Electronics Market 2023-2024
Figure 8: Ecosystem Analysis in Gesture Recognition in Consumer Electronics Market 2023
Figure 9: Average Selling Price in Gesture Recognition in Consumer Electronics Market 2023-2030
Figure 10: Top Opportunites in Gesture Recognition in Consumer Electronics Market 2023-2024
Figure 11: Market Life Cycle Analysis in Gesture Recognition in Consumer Electronics Market
Figure 12: GlobalBy TypesGesture Recognition in Consumer Electronics Market Revenue, 2023-2030 ($)
Figure 13: GlobalBy ProductsGesture Recognition in Consumer Electronics Market Revenue, 2023-2030 ($)
Figure 14: GlobalBy Gesture Recognition TechnologyGesture Recognition in Consumer Electronics Market Revenue, 2023-2030 ($)
Figure 15: Global Gesture Recognition in Consumer Electronics Market - By Geography
Figure 16: Global Gesture Recognition in Consumer Electronics Market Value & Volume, By Geography, 2023-2030 ($)
Figure 17: Global Gesture Recognition in Consumer Electronics Market CAGR, By Geography, 2023-2030 (%)
Figure 18: North America Gesture Recognition in Consumer Electronics Market Value & Volume, 2023-2030 ($)
Figure 19: US Gesture Recognition in Consumer Electronics Market Value & Volume, 2023-2030 ($)
Figure 20: US GDP and Population, 2023-2024 ($)
Figure 21: US GDP – Composition of 2023, By Sector of Origin
Figure 22: US Export and Import Value & Volume, 2023-2024 ($)
Figure 23: Canada Gesture Recognition in Consumer Electronics Market Value & Volume, 2023-2030 ($)
Figure 24: Canada GDP and Population, 2023-2024 ($)
Figure 25: Canada GDP – Composition of 2023, By Sector of Origin
Figure 26: Canada Export and Import Value & Volume, 2023-2024 ($)
Figure 27: Mexico Gesture Recognition in Consumer Electronics Market Value & Volume, 2023-2030 ($)
Figure 28: Mexico GDP and Population, 2023-2024 ($)
Figure 29: Mexico GDP – Composition of 2023, By Sector of Origin
Figure 30: Mexico Export and Import Value & Volume, 2023-2024 ($)
Figure 31: South America Gesture Recognition in Consumer Electronics Market Value & Volume, 2023-2030 ($)
Figure 32: Brazil Gesture Recognition in Consumer Electronics Market Value & Volume, 2023-2030 ($)
Figure 33: Brazil GDP and Population, 2023-2024 ($)
Figure 34: Brazil GDP – Composition of 2023, By Sector of Origin
Figure 35: Brazil Export and Import Value & Volume, 2023-2024 ($)
Figure 36: Venezuela Gesture Recognition in Consumer Electronics Market Value & Volume, 2023-2030 ($)
Figure 37: Venezuela GDP and Population, 2023-2024 ($)
Figure 38: Venezuela GDP – Composition of 2023, By Sector of Origin
Figure 39: Venezuela Export and Import Value & Volume, 2023-2024 ($)
Figure 40: Argentina Gesture Recognition in Consumer Electronics Market Value & Volume, 2023-2030 ($)
Figure 41: Argentina GDP and Population, 2023-2024 ($)
Figure 42: Argentina GDP – Composition of 2023, By Sector of Origin
Figure 43: Argentina Export and Import Value & Volume, 2023-2024 ($)
Figure 44: Ecuador Gesture Recognition in Consumer Electronics Market Value & Volume, 2023-2030 ($)
Figure 45: Ecuador GDP and Population, 2023-2024 ($)
Figure 46: Ecuador GDP – Composition of 2023, By Sector of Origin
Figure 47: Ecuador Export and Import Value & Volume, 2023-2024 ($)
Figure 48: Peru Gesture Recognition in Consumer Electronics Market Value & Volume, 2023-2030 ($)
Figure 49: Peru GDP and Population, 2023-2024 ($)
Figure 50: Peru GDP – Composition of 2023, By Sector of Origin
Figure 51: Peru Export and Import Value & Volume, 2023-2024 ($)
Figure 52: Colombia Gesture Recognition in Consumer Electronics Market Value & Volume, 2023-2030 ($)
Figure 53: Colombia GDP and Population, 2023-2024 ($)
Figure 54: Colombia GDP – Composition of 2023, By Sector of Origin
Figure 55: Colombia Export and Import Value & Volume, 2023-2024 ($)
Figure 56: Costa Rica Gesture Recognition in Consumer Electronics Market Value & Volume, 2023-2030 ($)
Figure 57: Costa Rica GDP and Population, 2023-2024 ($)
Figure 58: Costa Rica GDP – Composition of 2023, By Sector of Origin
Figure 59: Costa Rica Export and Import Value & Volume, 2023-2024 ($)
Figure 60: Europe Gesture Recognition in Consumer Electronics Market Value & Volume, 2023-2030 ($)
Figure 61: U.K Gesture Recognition in Consumer Electronics Market Value & Volume, 2023-2030 ($)
Figure 62: U.K GDP and Population, 2023-2024 ($)
Figure 63: U.K GDP – Composition of 2023, By Sector of Origin
Figure 64: U.K Export and Import Value & Volume, 2023-2024 ($)
Figure 65: Germany Gesture Recognition in Consumer Electronics Market Value & Volume, 2023-2030 ($)
Figure 66: Germany GDP and Population, 2023-2024 ($)
Figure 67: Germany GDP – Composition of 2023, By Sector of Origin
Figure 68: Germany Export and Import Value & Volume, 2023-2024 ($)
Figure 69: Italy Gesture Recognition in Consumer Electronics Market Value & Volume, 2023-2030 ($)
Figure 70: Italy GDP and Population, 2023-2024 ($)
Figure 71: Italy GDP – Composition of 2023, By Sector of Origin
Figure 72: Italy Export and Import Value & Volume, 2023-2024 ($)
Figure 73: France Gesture Recognition in Consumer Electronics Market Value & Volume, 2023-2030 ($)
Figure 74: France GDP and Population, 2023-2024 ($)
Figure 75: France GDP – Composition of 2023, By Sector of Origin
Figure 76: France Export and Import Value & Volume, 2023-2024 ($)
Figure 77: Netherlands Gesture Recognition in Consumer Electronics Market Value & Volume, 2023-2030 ($)
Figure 78: Netherlands GDP and Population, 2023-2024 ($)
Figure 79: Netherlands GDP – Composition of 2023, By Sector of Origin
Figure 80: Netherlands Export and Import Value & Volume, 2023-2024 ($)
Figure 81: Belgium Gesture Recognition in Consumer Electronics Market Value & Volume, 2023-2030 ($)
Figure 82: Belgium GDP and Population, 2023-2024 ($)
Figure 83: Belgium GDP – Composition of 2023, By Sector of Origin
Figure 84: Belgium Export and Import Value & Volume, 2023-2024 ($)
Figure 85: Spain Gesture Recognition in Consumer Electronics Market Value & Volume, 2023-2030 ($)
Figure 86: Spain GDP and Population, 2023-2024 ($)
Figure 87: Spain GDP – Composition of 2023, By Sector of Origin
Figure 88: Spain Export and Import Value & Volume, 2023-2024 ($)
Figure 89: Denmark Gesture Recognition in Consumer Electronics Market Value & Volume, 2023-2030 ($)
Figure 90: Denmark GDP and Population, 2023-2024 ($)
Figure 91: Denmark GDP – Composition of 2023, By Sector of Origin
Figure 92: Denmark Export and Import Value & Volume, 2023-2024 ($)
Figure 93: APAC Gesture Recognition in Consumer Electronics Market Value & Volume, 2023-2030 ($)
Figure 94: China Gesture Recognition in Consumer Electronics Market Value & Volume, 2023-2030
Figure 95: China GDP and Population, 2023-2024 ($)
Figure 96: China GDP – Composition of 2023, By Sector of Origin
Figure 97: China Export and Import Value & Volume, 2023-2024 ($)Gesture Recognition in Consumer Electronics Market China Export and Import Value & Volume, 2023-2024 ($)
Figure 98: Australia Gesture Recognition in Consumer Electronics Market Value & Volume, 2023-2030 ($)
Figure 99: Australia GDP and Population, 2023-2024 ($)
Figure 100: Australia GDP – Composition of 2023, By Sector of Origin
Figure 101: Australia Export and Import Value & Volume, 2023-2024 ($)
Figure 102: South Korea Gesture Recognition in Consumer Electronics Market Value & Volume, 2023-2030 ($)
Figure 103: South Korea GDP and Population, 2023-2024 ($)
Figure 104: South Korea GDP – Composition of 2023, By Sector of Origin
Figure 105: South Korea Export and Import Value & Volume, 2023-2024 ($)
Figure 106: India Gesture Recognition in Consumer Electronics Market Value & Volume, 2023-2030 ($)
Figure 107: India GDP and Population, 2023-2024 ($)
Figure 108: India GDP – Composition of 2023, By Sector of Origin
Figure 109: India Export and Import Value & Volume, 2023-2024 ($)
Figure 110: Taiwan Gesture Recognition in Consumer Electronics Market Value & Volume, 2023-2030 ($)
Figure 111: Taiwan GDP and Population, 2023-2024 ($)
Figure 112: Taiwan GDP – Composition of 2023, By Sector of Origin
Figure 113: Taiwan Export and Import Value & Volume, 2023-2024 ($)
Figure 114: Malaysia Gesture Recognition in Consumer Electronics Market Value & Volume, 2023-2030 ($)
Figure 115: Malaysia GDP and Population, 2023-2024 ($)
Figure 116: Malaysia GDP – Composition of 2023, By Sector of Origin
Figure 117: Malaysia Export and Import Value & Volume, 2023-2024 ($)
Figure 118: Hong Kong Gesture Recognition in Consumer Electronics Market Value & Volume, 2023-2030 ($)
Figure 119: Hong Kong GDP and Population, 2023-2024 ($)
Figure 120: Hong Kong GDP – Composition of 2023, By Sector of Origin
Figure 121: Hong Kong Export and Import Value & Volume, 2023-2024 ($)
Figure 122: Middle East & Africa Gesture Recognition in Consumer Electronics Market Middle East & Africa 3D Printing Market Value & Volume, 2023-2030 ($)
Figure 123: Russia Gesture Recognition in Consumer Electronics Market Value & Volume, 2023-2030 ($)
Figure 124: Russia GDP and Population, 2023-2024 ($)
Figure 125: Russia GDP – Composition of 2023, By Sector of Origin
Figure 126: Russia Export and Import Value & Volume, 2023-2024 ($)
Figure 127: Israel Gesture Recognition in Consumer Electronics Market Value & Volume, 2023-2030 ($)
Figure 128: Israel GDP and Population, 2023-2024 ($)
Figure 129: Israel GDP – Composition of 2023, By Sector of Origin
Figure 130: Israel Export and Import Value & Volume, 2023-2024 ($)
Figure 131: Entropy Share, By Strategies, 2023-2024* (%)Gesture Recognition in Consumer Electronics Market
Figure 132: Developments, 2023-2024*Gesture Recognition in Consumer Electronics Market
Figure 133: Company 1 Gesture Recognition in Consumer Electronics Market Net Revenue, By Years, 2023-2024* ($)
Figure 134: Company 1 Gesture Recognition in Consumer Electronics Market Net Revenue Share, By Business segments, 2023 (%)
Figure 135: Company 1 Gesture Recognition in Consumer Electronics Market Net Sales Share, By Geography, 2023 (%)
Figure 136: Company 2 Gesture Recognition in Consumer Electronics Market Net Revenue, By Years, 2023-2024* ($)
Figure 137: Company 2 Gesture Recognition in Consumer Electronics Market Net Revenue Share, By Business segments, 2023 (%)
Figure 138: Company 2 Gesture Recognition in Consumer Electronics Market Net Sales Share, By Geography, 2023 (%)
Figure 139: Company 3 Gesture Recognition in Consumer Electronics Market Net Revenue, By Years, 2023-2024* ($)
Figure 140: Company 3 Gesture Recognition in Consumer Electronics Market Net Revenue Share, By Business segments, 2023 (%)
Figure 141: Company 3 Gesture Recognition in Consumer Electronics Market Net Sales Share, By Geography, 2023 (%)
Figure 142: Company 4 Gesture Recognition in Consumer Electronics Market Net Revenue, By Years, 2023-2024* ($)
Figure 143: Company 4 Gesture Recognition in Consumer Electronics Market Net Revenue Share, By Business segments, 2023 (%)
Figure 144: Company 4 Gesture Recognition in Consumer Electronics Market Net Sales Share, By Geography, 2023 (%)
Figure 145: Company 5 Gesture Recognition in Consumer Electronics Market Net Revenue, By Years, 2023-2024* ($)
Figure 146: Company 5 Gesture Recognition in Consumer Electronics Market Net Revenue Share, By Business segments, 2023 (%)
Figure 147: Company 5 Gesture Recognition in Consumer Electronics Market Net Sales Share, By Geography, 2023 (%)
Figure 148: Company 6 Gesture Recognition in Consumer Electronics Market Net Revenue, By Years, 2023-2024* ($)
Figure 149: Company 6 Gesture Recognition in Consumer Electronics Market Net Revenue Share, By Business segments, 2023 (%)
Figure 150: Company 6 Gesture Recognition in Consumer Electronics Market Net Sales Share, By Geography, 2023 (%)
Figure 151: Company 7 Gesture Recognition in Consumer Electronics Market Net Revenue, By Years, 2023-2024* ($)
Figure 152: Company 7 Gesture Recognition in Consumer Electronics Market Net Revenue Share, By Business segments, 2023 (%)
Figure 153: Company 7 Gesture Recognition in Consumer Electronics Market Net Sales Share, By Geography, 2023 (%)
Figure 154: Company 8 Gesture Recognition in Consumer Electronics Market Net Revenue, By Years, 2023-2024* ($)
Figure 155: Company 8 Gesture Recognition in Consumer Electronics Market Net Revenue Share, By Business segments, 2023 (%)
Figure 156: Company 8 Gesture Recognition in Consumer Electronics Market Net Sales Share, By Geography, 2023 (%)
Figure 157: Company 9 Gesture Recognition in Consumer Electronics Market Net Revenue, By Years, 2023-2024* ($)
Figure 158: Company 9 Gesture Recognition in Consumer Electronics Market Net Revenue Share, By Business segments, 2023 (%)
Figure 159: Company 9 Gesture Recognition in Consumer Electronics Market Net Sales Share, By Geography, 2023 (%)
Figure 160: Company 10 Gesture Recognition in Consumer Electronics Market Net Revenue, By Years, 2023-2024* ($)
Figure 161: Company 10 Gesture Recognition in Consumer Electronics Market Net Revenue Share, By Business segments, 2023 (%)
Figure 162: Company 10 Gesture Recognition in Consumer Electronics Market Net Sales Share, By Geography, 2023 (%)
Figure 163: Company 11 Gesture Recognition in Consumer Electronics Market Net Revenue, By Years, 2023-2024* ($)
Figure 164: Company 11 Gesture Recognition in Consumer Electronics Market Net Revenue Share, By Business segments, 2023 (%)
Figure 165: Company 11 Gesture Recognition in Consumer Electronics Market Net Sales Share, By Geography, 2023 (%)
Figure 166: Company 12 Gesture Recognition in Consumer Electronics Market Net Revenue, By Years, 2023-2024* ($)
Figure 167: Company 12 Gesture Recognition in Consumer Electronics Market Net Revenue Share, By Business segments, 2023 (%)
Figure 168: Company 12 Gesture Recognition in Consumer Electronics Market Net Sales Share, By Geography, 2023 (%)
Figure 169: Company 13 Gesture Recognition in Consumer Electronics Market Net Revenue, By Years, 2023-2024* ($)
Figure 170: Company 13 Gesture Recognition in Consumer Electronics Market Net Revenue Share, By Business segments, 2023 (%)
Figure 171: Company 13 Gesture Recognition in Consumer Electronics Market Net Sales Share, By Geography, 2023 (%)
Figure 172: Company 14 Gesture Recognition in Consumer Electronics Market Net Revenue, By Years, 2023-2024* ($)
Figure 173: Company 14 Gesture Recognition in Consumer Electronics Market Net Revenue Share, By Business segments, 2023 (%)
Figure 174: Company 14 Gesture Recognition in Consumer Electronics Market Net Sales Share, By Geography, 2023 (%)
Figure 175: Company 15 Gesture Recognition in Consumer Electronics Market Net Revenue, By Years, 2023-2024* ($)
Figure 176: Company 15 Gesture Recognition in Consumer Electronics Market Net Revenue Share, By Business segments, 2023 (%)
Figure 177: Company 15 Gesture Recognition in Consumer Electronics Market Net Sales Share, By Geography, 2023 (%)