 Email
Email Print
Print


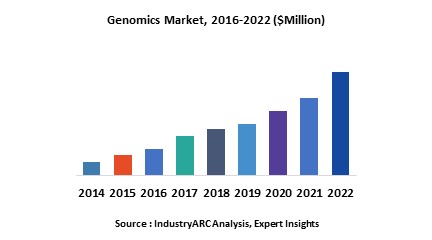
Global Genomic Market Overview:
A genome is the genetic material of an organism. It includes both the genes and the noncoding DNA, as well as mitochondrial DNA and chloroplast DNA. The study of genomes is called genomics. The genomics market is gaining traction owing to its applications in various fields of study such as intragenomic phenomenon including epistasis, pleiotropy, heterosis, and other interactions between loci and alleles within the genome. In this era of medical and life science innovations shaping itself as an inevitable uptake for sustainability of mankind, the genomic research is poised for exponential growth owing to imperative genetic innovations feeding off it. Abundant potential has driven this arcade to reach a staggering market size of $16 billion - $16.5 billion as of 2018, and the demand is estimated to increment at formidable CAGR of 9.2% to 10.2% during the forecast period of 2019 to 2025.
Global Genomic Market Outlook:
Genomics is extensively employed in healthcare, agriculture, biotechnology, DNA sequencing, and diagnostics. In the healthcare segment, genomics is used for the development of vaccines and drugs. This segment leads the application vertical and is growing with a CAGR of 10.1%-10.7 % through to 2025. Genomics plays a significant part in diagnosis of several genetic disorders. It has an ample scope in personalized medication as it can advocate a medical management constructed on the genetic face of a person with the help of clinical data and AI. It is also applied in synthetic biology and bioengineering. Genomics research in agriculture is hired for plant breeding and genetics to cultivate crop production. The understanding of gene function and the accessibility of genomic maps along with an enhanced understanding of genetic variant will aid the plant breeders to identify the traits and then manipulate those traits to obtain a high yield. All these factors affecting the enormous medical and agricultural sector are all set to stroke the genomics market with abundant demand.
Global Genomic Market Growth Drivers:
As per the National Center for Biotechnology Information, U.S, the progression in oncology (study and treatment of tumor) expenses is forecast to rise 7%–10% annually throughout 2020, with universal oncology cost exceeding $150 billion[1]. As per the WHO, cancer is a leading cause of death worldwide, accounting for an estimated 9.6 million deaths in 2018[2]. And the total annual economic cost of cancer at the initial period of this decade was estimated at approximately $1.16 trillion. Thus the application of genomics in exploring cell-free circulating DNA by several R&D sectors as a potential biomarker for cancers is driving the market towards exponential growth. The genomics market with its current potential displays all the necessary traits it can adapt in the coming years to divert a huge chunk of traffic and revenue from the omnipresent cancer diagnostics.
As per the Food and Agriculture Organization of United Nations, between 1960 and 1990 the arable land increased by 1.5 billion ha, and in the recent past decades the elevation recorded is just 155 million ha[3]. With decreasing arable floor and the increasing global population augmenting the demand for food by 70% (by 2050), obtaining a high yield is a major trend in the agricultural sector. Genomics market is all set to capitalize on this unprecedented demand scenario. Genomics supplements the understanding of gene function and the accessibility of genomic maps along with an enhanced understanding of genetic variant, thus aiding the plant breeders to identify the traits and then manipulate those traits to obtain a high yield.
After an acute analysis of the regional insights of the global genomics market, North America is revealed to hold 39% to 40% of the entire global market size as of 2018. Such dominance can be attributed to several aspects such as cumulative investment on research by federal administrations, growing patient awareness, and accessibility of urbane healthcare facilities.
Global Genomics Market Players Perspective:
Some of other key players profiled in this IndustryARC business intelligence report are Beckton Dickson, Synthetic Genomics Inc. (SGI) ,Cepheid, Inc., Affymetrix, Inc., Bio-Rad Laboratories, Inc., Agilent Technologies, GE Healthcare, Illumina, Inc., Danaher Corporation,F. Hoffmann-La Roche, QIAGEN, Thermo Fisher Scientific and PacBio (Pacific Biosciences of California). Majority of the companies mentioned are situated in North America augmenting the regional affluence in the global market.
Global Genomics Market Trends:
High overload owing to a wide range of reagents and consumables has propelled companies into approving different policies to endure in the market and stay ahead of the curve.
For instance, in January 2017, BD launched Precise WTA Reagents for precise and guileless quantification of hereditary data form single cell analysis. Moreover, in July 2016, SGI-DNA entered into a distribution agreement with VWR International, an American company involved in the distribution of research laboratory products, with over 1,200,000 items to more than 250,000 customers in North America and Europe.
Genomics Market Research Scope
The base year of the study is 2018, with forecast done up to 2025. The study presents a thorough analysis of the competitive landscape, taking into account the market shares of the leading companies. It also provides information on unit shipments. These provide the key market participants with the necessary business intelligence and help them understand the future of the Genomics Market. The assessment includes the forecast, an overview of the competitive structure, the market shares of the competitors, as well as the market trends, market demands, market drivers, market challenges, and product analysis. The market drivers and restraints have been assessed to fathom their impact over the forecast period. This report further identifies the key opportunities for growth while also detailing the key challenges and possible threats. The key areas of focus include the types of equipment in the Genomics Market, and their specific applications in different phases of industrial operations.
Genomics Market Report: Industry Coverage
Types of Solutions Genomics Market:
By Product Types- Microarray chip, Sequencers.
By Application- Genotyping, SNP analysis.
By End-User- Anthropology, Diagnostics.
The Genomics Market report also analyzes the major geographic regions for the market as well as the major countries for the market in these regions. The regions and countries covered in the study include:
- North America: The U.S., Canada, Mexico
- South America: Brazil, Venezuela, Argentina, Ecuador, Peru, Colombia, Costa Rica
- Europe: The U.K., Germany, Italy, France, The Netherlands, Belgium, Spain, Denmark
- APAC: China, Japan, Australia, South Korea, India, Taiwan, Malaysia, Hong Kong
- Middle East and Africa: Israel, South Africa, Saudi Arabia
Reference:
[1]https://www.ncbi.nlm.nih.gov/pmc/articles/PMC5812392/
[2]https://www.who.int/en/news-room/fact-sheets/detail/cancer
[3]http://www.fao.org/3/y4252e/y4252e06a.htm
1. Genomics Market - Overview
1.1. Definitions and Scope
2. Genomics Market - Executive summary
2.1. Market Revenue, Market Size and Key Trends by Company
2.2. Key Trends by type of Application
2.3. Key Trends segmented by Geography
3. Genomics Market
3.1. Comparative analysis
3.1.1. Product Benchmarking - Top 10 companies
3.1.2. Top 5 Financials Analysis
3.1.3. Market Value split by Top 10 companies
3.1.4. Patent Analysis - Top 10 companies
3.1.5. Pricing Analysis
4. Genomics Market – Startup companies Scenario Premium
4.1. Top 10 startup company Analysis by
4.1.1. Investment
4.1.2. Revenue
4.1.3. Market Shares
4.1.4. Market Size and Application Analysis
4.1.5. Venture Capital and Funding Scenario
5. Genomics Market – Industry Market Entry Scenario Premium
5.1. Regulatory Framework Overview
5.2. New Business and Ease of Doing business index
5.3. Case studies of successful ventures
5.4. Customer Analysis – Top 10 companies
6. Genomics Market Forces
6.1. Drivers
6.2. Constraints
6.3. Challenges
6.4. Porters five force model
6.4.1. Bargaining power of suppliers
6.4.2. Bargaining powers of customers
6.4.3. Threat of new entrants
6.4.4. Rivalry among existing players
6.4.5. Threat of substitutes
7. Genomics Market -Strategic analysis
7.1. Value chain analysis
7.2. Opportunities analysis
7.3. Product life cycle
7.4. Suppliers and distributors Market Share
8. Genomics Market – By Product Type (Market Size -$Million / $Billion)
8.1. Market Size and Market Share Analysis
8.2. Application Revenue and Trend Research
8.3. Product Segment Analysis
8.3.1. Introduction
8.3.2. Products
8.3.2.1. Microarray Chips
8.3.2.2. DNA Sequencers
8.3.2.3. Thermal Cyclers
8.3.2.4. Electrophoresis Equipment
8.3.2.5. Mass Spectrometers
8.3.2.6. Others
8.3.3. Reagents Used
9. Genomics Market – Service Industry Analysis (Market Size -$Million / $Billion)
9.1. Introduction
9.2. Bio-Informatics Database
9.3. Bio-Informatics Tools
9.4. Laboratory Services
9.4.1. DNA Sample Sequencing
9.4.2. De Novo Sequencing
9.4.3. Targeted Re-Sequencing
9.4.4. Individual Genome Sequencing
9.4.5. SNP Analysis
9.4.6. Molecular Biology
9.4.7. Gene Expression Analysis
9.4.8. Biomarker Solutions
9.4.9. Others
10. Genomics Market – By Technique (Market Size -$Million / $Billion)
10.1. PCR
10.2. Microarray analysis
10.3. Chromatography
10.4. X-ray crystallography
10.5. Electrophoresis
10.6. Others
11. Genomics Market – By Application (Market Size -$Million / $Billion)
11.1. Genotyping
11.2. Epigenetics
11.3. Gene expression and transcriptome analysis
11.4. Cytogenomics
11.5. Personalized medicine
11.6. Proteomics
11.7. Vaccine synthesis
11.8. Synthetic Biology and Bioengineering
11.11. Drug discovery
11.10. Gene mapping
11.11. Social science
11.12. Others
12. Genomics – By End Use Industry(Market Size -$Million / $Billion)
12.1. Segment type Size and Market Share Analysis
12.2. Application Revenue and Trends by type of Application
12.3. Application Segment Analysis by Type
12.3.1. Introduction
12.3.2. Anthropology
12.3.3. Agriculture
12.3.4. Biotechnology
12.3.5. Diagnostics
12.3.6. Medicine
12.3.7. Others
13. Genomics - By Geography (Market Size -$Million / $Billion)
13.1. Genomics Market - North America Segment Research
13.2. North America Market Research (Million / $Billion)
13.2.1. Segment type Size and Market Size Analysis
13.2.2. Revenue and Trends
13.2.3. Application Revenue and Trends by type of Application
13.2.4. Company Revenue and Product Analysis
13.2.5. North America Product type and Application Market Size
13.2.5.1. U.S.
13.2.5.2. Canada
13.2.5.3. Mexico
13.2.5.4. Rest of North America
13.3. Genomics - South America Segment Research
13.4. South America Market Research (Market Size -$Million / $Billion)
13.4.1. Segment type Size and Market Size Analysis
13.4.2. Revenue and Trends
13.4.3. Application Revenue and Trends by type of Application
13.4.4. Company Revenue and Product Analysis
13.4.5. South America Product type and Application Market Size
13.4.5.1. Brazil
13.4.5.2. Venezuela
13.4.5.3. Argentina
13.4.5.4. Ecuador
13.4.5.5. Peru
13.4.5.6. Colombia
13.4.5.7. Costa Rica
13.4.5.8. Rest of South America
13.5. Genomics - Europe Segment Research
13.6. Europe Market Research (Market Size -$Million / $Billion)
13.6.1. Segment type Size and Market Size Analysis
13.6.2. Revenue and Trends
13.6.3. Application Revenue and Trends by type of Application
13.6.4. Company Revenue and Product Analysis
13.6.5. Europe Segment Product type and Application Market Size
13.6.5.1. U.K
13.6.5.2. Germany
13.6.5.3. Italy
13.6.5.4. France
13.6.5.5. Netherlands
13.6.5.6. Belgium
13.6.5.7. Spain
13.6.5.8. Denmark
13.6.5.9. Rest of Europe
13.7. Genomics – APAC Segment Research
13.8. APAC Market Research (Market Size -$Million / $Billion)
13.8.1. Segment type Size and Market Size Analysis
13.8.2. Revenue and Trends
13.8.3. Application Revenue and Trends by type of Application
13.8.4. Company Revenue and Product Analysis
13.8.5. APAC Segment – Product type and Application Market Size
13.8.5.1. China
13.8.5.2. Australia
13.8.5.3. Japan
13.8.5.4. South Korea
13.8.5.5. India
13.8.5.6. Taiwan
13.8.5.7. Malaysia
14. Genomics Market - Entropy
14.1. New product launches
14.2. M&A's, collaborations, JVs and partnerships
15. Genomics Market – Industry / Segment Competition landscape Premium
15.1. Market Share Analysis
15.1.1. Market Share by Country- Top companies
15.1.2. Market Share by Region- Top 10 companies
15.1.3. Market Share by type of Application – Top 10 companies
15.1.4. Market Share by type of Product / Product category- Top 10 companies
15.1.5. Market Share at global level- Top 10 companies
15.1.6. Best Practises for companies
16. Genomics Market – Key Company List by Country Premium
17. Genomics Market Company Analysis
17.1. Market Share, Company Revenue, Products, M&A, Developments
17.2. Luminex Corporation
17.3. Myriad Genetics Inc
17.4. Thermo Fisher Scientific Inc.
17.5. Pacific Biosciences of California, Inc
17.6. Ge Healthcare
17.7. Perkinelmer Inc.
17.8. Bayer Healthcare Llc
17.9. F. Hoffmann-La Roche Ltd
17.10. Illumina, Inc.
17.11. Agilent Technologies Inc.
17.12. Bio-Rad Laboratories
17.13. Qiagen N.V.
17.14. Company 13
17.15. Company 14
17.16. Company 15
"*Financials would be provided on a best efforts basis for private companies"
18. Genomics Market -Appendix
18.1. Abbreviations
18.2. Sources
19. Genomics Market -Methodology Premium
19.1. Research Methodology
19.1.1. Company Expert Interviews
19.1.2. Industry Databases
19.1.3. Associations
19.1.4. Company News
19.1.5. Company Annual Reports
19.1.6. Application Trends
19.1.7. New Products and Product database
19.1.8. Company Transcripts
19.1.9. R&D Trends
19.1.10. Key Opinion Leaders Interviews
19.1.11. Supply and Demand Trends
List of Tables
Table 1: Genomics Market Overview 2021-2026
Table 2: Genomics Market Leader Analysis 2018-2019 (US$)
Table 3: Genomics Market Product Analysis 2018-2019 (US$)
Table 4: Genomics Market End User Analysis 2018-2019 (US$)
Table 5: Genomics Market Patent Analysis 2013-2018* (US$)
Table 6: Genomics Market Financial Analysis 2018-2019 (US$)
Table 7: Genomics Market Driver Analysis 2018-2019 (US$)
Table 8: Genomics Market Challenges Analysis 2018-2019 (US$)
Table 9: Genomics Market Constraint Analysis 2018-2019 (US$)
Table 10: Genomics Market Supplier Bargaining Power Analysis 2018-2019 (US$)
Table 11: Genomics Market Buyer Bargaining Power Analysis 2018-2019 (US$)
Table 12: Genomics Market Threat of Substitutes Analysis 2018-2019 (US$)
Table 13: Genomics Market Threat of New Entrants Analysis 2018-2019 (US$)
Table 14: Genomics Market Degree of Competition Analysis 2018-2019 (US$)
Table 15: Genomics Market Value Chain Analysis 2018-2019 (US$)
Table 16: Genomics Market Pricing Analysis 2021-2026 (US$)
Table 17: Genomics Market Opportunities Analysis 2021-2026 (US$)
Table 18: Genomics Market Product Life Cycle Analysis 2021-2026 (US$)
Table 19: Genomics Market Supplier Analysis 2018-2019 (US$)
Table 20: Genomics Market Distributor Analysis 2018-2019 (US$)
Table 21: Genomics Market Trend Analysis 2018-2019 (US$)
Table 22: Genomics Market Size 2018 (US$)
Table 23: Genomics Market Forecast Analysis 2021-2026 (US$)
Table 24: Genomics Market Sales Forecast Analysis 2021-2026 (Units)
Table 25: Genomics Market, Revenue & Volume, By Product Type, 2021-2026 ($)
Table 26: Genomics Market By Product Type, Revenue & Volume, By Introduction, 2021-2026 ($)
Table 27: Genomics Market By Product Type, Revenue & Volume, By Products, 2021-2026 ($)
Table 28: Genomics Market By Product Type, Revenue & Volume, By DNA Microarrays, 2021-2026 ($)
Table 29: Genomics Market By Product Type, Revenue & Volume, By Electrophoresis, 2021-2026 ($)
Table 30: Genomics Market By Product Type, Revenue & Volume, By X-Ray Crystallography, 2021-2026 ($)
Table 31: Genomics Market, Revenue & Volume, By Service Industry Analysis, 2021-2026 ($)
Table 32: Genomics Market By Service Industry Analysis, Revenue & Volume, By Introduction, 2021-2026 ($)
Table 33: Genomics Market By Service Industry Analysis, Revenue & Volume, By Bio-Informatics Database, 2021-2026 ($)
Table 34: Genomics Market By Service Industry Analysis, Revenue & Volume, By Bio-Informatics Tools, 2021-2026 ($)
Table 35: Genomics Market By Service Industry Analysis, Revenue & Volume, By Laboratory Services, 2021-2026 ($)
Table 36: Genomics Market By Service Industry Analysis, Revenue & Volume, By DNA Sample Sequencing, 2021-2026 ($)
Table 37: Genomics Market, Revenue & Volume, By End User Application, 2021-2026 ($)
Table 38: Genomics Market By End User Application, Revenue & Volume, By Introduction, 2021-2026 ($)
Table 39: Genomics Market By End User Application, Revenue & Volume, By Anthropology, 2021-2026 ($)
Table 40: Genomics Market By End User Application, Revenue & Volume, By Agriculture, 2021-2026 ($)
Table 41: Genomics Market By End User Application, Revenue & Volume, By Cytogenetics, 2021-2026 ($)
Table 42: Genomics Market By End User Application, Revenue & Volume, By Diagnostics, 2021-2026 ($)
Table 43: North America Genomics Market, Revenue & Volume, By Product Type, 2021-2026 ($)
Table 44: North America Genomics Market, Revenue & Volume, By Service Industry Analysis, 2021-2026 ($)
Table 45: North America Genomics Market, Revenue & Volume, By End User Application, 2021-2026 ($)
Table 46: South america Genomics Market, Revenue & Volume, By Product Type, 2021-2026 ($)
Table 47: South america Genomics Market, Revenue & Volume, By Service Industry Analysis, 2021-2026 ($)
Table 48: South america Genomics Market, Revenue & Volume, By End User Application, 2021-2026 ($)
Table 49: Europe Genomics Market, Revenue & Volume, By Product Type, 2021-2026 ($)
Table 50: Europe Genomics Market, Revenue & Volume, By Service Industry Analysis, 2021-2026 ($)
Table 51: Europe Genomics Market, Revenue & Volume, By End User Application, 2021-2026 ($)
Table 52: APAC Genomics Market, Revenue & Volume, By Product Type, 2021-2026 ($)
Table 53: APAC Genomics Market, Revenue & Volume, By Service Industry Analysis, 2021-2026 ($)
Table 54: APAC Genomics Market, Revenue & Volume, By End User Application, 2021-2026 ($)
Table 55: Middle East & Africa Genomics Market, Revenue & Volume, By Product Type, 2021-2026 ($)
Table 56: Middle East & Africa Genomics Market, Revenue & Volume, By Service Industry Analysis, 2021-2026 ($)
Table 57: Middle East & Africa Genomics Market, Revenue & Volume, By End User Application, 2021-2026 ($)
Table 58: Russia Genomics Market, Revenue & Volume, By Product Type, 2021-2026 ($)
Table 59: Russia Genomics Market, Revenue & Volume, By Service Industry Analysis, 2021-2026 ($)
Table 60: Russia Genomics Market, Revenue & Volume, By End User Application, 2021-2026 ($)
Table 61: Israel Genomics Market, Revenue & Volume, By Product Type, 2021-2026 ($)
Table 62: Israel Genomics Market, Revenue & Volume, By Service Industry Analysis, 2021-2026 ($)
Table 63: Israel Genomics Market, Revenue & Volume, By End User Application, 2021-2026 ($)
Table 64: Top Companies 2018 (US$)Genomics Market, Revenue & Volume
Table 65: Product Launch 2018-2019Genomics Market, Revenue & Volume
Table 66: Mergers & Acquistions 2018-2019Genomics Market, Revenue & Volume
List of Figures
Figure 1: Overview of Genomics Market 2021-2026
Figure 2: Market Share Analysis for Genomics Market 2018 (US$)
Figure 3: Product Comparison in Genomics Market 2018-2019 (US$)
Figure 4: End User Profile for Genomics Market 2018-2019 (US$)
Figure 5: Patent Application and Grant in Genomics Market 2013-2018* (US$)
Figure 6: Top 5 Companies Financial Analysis in Genomics Market 2018-2019 (US$)
Figure 7: Market Entry Strategy in Genomics Market 2018-2019
Figure 8: Ecosystem Analysis in Genomics Market 2018
Figure 9: Average Selling Price in Genomics Market 2021-2026
Figure 10: Top Opportunites in Genomics Market 2018-2019
Figure 11: Market Life Cycle Analysis in Genomics Market
Figure 12: GlobalBy Product TypeGenomics Market Revenue, 2021-2026 ($)
Figure 13: GlobalBy Service Industry AnalysisGenomics Market Revenue, 2021-2026 ($)
Figure 14: GlobalBy End User ApplicationGenomics Market Revenue, 2021-2026 ($)
Figure 15: Global Genomics Market - By Geography
Figure 16: Global Genomics Market Value & Volume, By Geography, 2021-2026 ($)
Figure 17: Global Genomics Market CAGR, By Geography, 2021-2026 (%)
Figure 18: North America Genomics Market Value & Volume, 2021-2026 ($)
Figure 19: US Genomics Market Value & Volume, 2021-2026 ($)
Figure 20: US GDP and Population, 2018-2019 ($)
Figure 21: US GDP – Composition of 2018, By Sector of Origin
Figure 22: US Export and Import Value & Volume, 2018-2019 ($)
Figure 23: Canada Genomics Market Value & Volume, 2021-2026 ($)
Figure 24: Canada GDP and Population, 2018-2019 ($)
Figure 25: Canada GDP – Composition of 2018, By Sector of Origin
Figure 26: Canada Export and Import Value & Volume, 2018-2019 ($)
Figure 27: Mexico Genomics Market Value & Volume, 2021-2026 ($)
Figure 28: Mexico GDP and Population, 2018-2019 ($)
Figure 29: Mexico GDP – Composition of 2018, By Sector of Origin
Figure 30: Mexico Export and Import Value & Volume, 2018-2019 ($)
Figure 31: South America Genomics Market Value & Volume, 2021-2026 ($)
Figure 32: Brazil Genomics Market Value & Volume, 2021-2026 ($)
Figure 33: Brazil GDP and Population, 2018-2019 ($)
Figure 34: Brazil GDP – Composition of 2018, By Sector of Origin
Figure 35: Brazil Export and Import Value & Volume, 2018-2019 ($)
Figure 36: Venezuela Genomics Market Value & Volume, 2021-2026 ($)
Figure 37: Venezuela GDP and Population, 2018-2019 ($)
Figure 38: Venezuela GDP – Composition of 2018, By Sector of Origin
Figure 39: Venezuela Export and Import Value & Volume, 2018-2019 ($)
Figure 40: Argentina Genomics Market Value & Volume, 2021-2026 ($)
Figure 41: Argentina GDP and Population, 2018-2019 ($)
Figure 42: Argentina GDP – Composition of 2018, By Sector of Origin
Figure 43: Argentina Export and Import Value & Volume, 2018-2019 ($)
Figure 44: Ecuador Genomics Market Value & Volume, 2021-2026 ($)
Figure 45: Ecuador GDP and Population, 2018-2019 ($)
Figure 46: Ecuador GDP – Composition of 2018, By Sector of Origin
Figure 47: Ecuador Export and Import Value & Volume, 2018-2019 ($)
Figure 48: Peru Genomics Market Value & Volume, 2021-2026 ($)
Figure 49: Peru GDP and Population, 2018-2019 ($)
Figure 50: Peru GDP – Composition of 2018, By Sector of Origin
Figure 51: Peru Export and Import Value & Volume, 2018-2019 ($)
Figure 52: Colombia Genomics Market Value & Volume, 2021-2026 ($)
Figure 53: Colombia GDP and Population, 2018-2019 ($)
Figure 54: Colombia GDP – Composition of 2018, By Sector of Origin
Figure 55: Colombia Export and Import Value & Volume, 2018-2019 ($)
Figure 56: Costa Rica Genomics Market Value & Volume, 2021-2026 ($)
Figure 57: Costa Rica GDP and Population, 2018-2019 ($)
Figure 58: Costa Rica GDP – Composition of 2018, By Sector of Origin
Figure 59: Costa Rica Export and Import Value & Volume, 2018-2019 ($)
Figure 60: Europe Genomics Market Value & Volume, 2021-2026 ($)
Figure 61: U.K Genomics Market Value & Volume, 2021-2026 ($)
Figure 62: U.K GDP and Population, 2018-2019 ($)
Figure 63: U.K GDP – Composition of 2018, By Sector of Origin
Figure 64: U.K Export and Import Value & Volume, 2018-2019 ($)
Figure 65: Germany Genomics Market Value & Volume, 2021-2026 ($)
Figure 66: Germany GDP and Population, 2018-2019 ($)
Figure 67: Germany GDP – Composition of 2018, By Sector of Origin
Figure 68: Germany Export and Import Value & Volume, 2018-2019 ($)
Figure 69: Italy Genomics Market Value & Volume, 2021-2026 ($)
Figure 70: Italy GDP and Population, 2018-2019 ($)
Figure 71: Italy GDP – Composition of 2018, By Sector of Origin
Figure 72: Italy Export and Import Value & Volume, 2018-2019 ($)
Figure 73: France Genomics Market Value & Volume, 2021-2026 ($)
Figure 74: France GDP and Population, 2018-2019 ($)
Figure 75: France GDP – Composition of 2018, By Sector of Origin
Figure 76: France Export and Import Value & Volume, 2018-2019 ($)
Figure 77: Netherlands Genomics Market Value & Volume, 2021-2026 ($)
Figure 78: Netherlands GDP and Population, 2018-2019 ($)
Figure 79: Netherlands GDP – Composition of 2018, By Sector of Origin
Figure 80: Netherlands Export and Import Value & Volume, 2018-2019 ($)
Figure 81: Belgium Genomics Market Value & Volume, 2021-2026 ($)
Figure 82: Belgium GDP and Population, 2018-2019 ($)
Figure 83: Belgium GDP – Composition of 2018, By Sector of Origin
Figure 84: Belgium Export and Import Value & Volume, 2018-2019 ($)
Figure 85: Spain Genomics Market Value & Volume, 2021-2026 ($)
Figure 86: Spain GDP and Population, 2018-2019 ($)
Figure 87: Spain GDP – Composition of 2018, By Sector of Origin
Figure 88: Spain Export and Import Value & Volume, 2018-2019 ($)
Figure 89: Denmark Genomics Market Value & Volume, 2021-2026 ($)
Figure 90: Denmark GDP and Population, 2018-2019 ($)
Figure 91: Denmark GDP – Composition of 2018, By Sector of Origin
Figure 92: Denmark Export and Import Value & Volume, 2018-2019 ($)
Figure 93: APAC Genomics Market Value & Volume, 2021-2026 ($)
Figure 94: China Genomics Market Value & Volume, 2021-2026
Figure 95: China GDP and Population, 2018-2019 ($)
Figure 96: China GDP – Composition of 2018, By Sector of Origin
Figure 97: China Export and Import Value & Volume, 2018-2019 ($)Genomics Market China Export and Import Value & Volume, 2018-2019 ($)
Figure 98: Australia Genomics Market Value & Volume, 2021-2026 ($)
Figure 99: Australia GDP and Population, 2018-2019 ($)
Figure 100: Australia GDP – Composition of 2018, By Sector of Origin
Figure 101: Australia Export and Import Value & Volume, 2018-2019 ($)
Figure 102: South Korea Genomics Market Value & Volume, 2021-2026 ($)
Figure 103: South Korea GDP and Population, 2018-2019 ($)
Figure 104: South Korea GDP – Composition of 2018, By Sector of Origin
Figure 105: South Korea Export and Import Value & Volume, 2018-2019 ($)
Figure 106: India Genomics Market Value & Volume, 2021-2026 ($)
Figure 107: India GDP and Population, 2018-2019 ($)
Figure 108: India GDP – Composition of 2018, By Sector of Origin
Figure 109: India Export and Import Value & Volume, 2018-2019 ($)
Figure 110: Taiwan Genomics Market Value & Volume, 2021-2026 ($)
Figure 111: Taiwan GDP and Population, 2018-2019 ($)
Figure 112: Taiwan GDP – Composition of 2018, By Sector of Origin
Figure 113: Taiwan Export and Import Value & Volume, 2018-2019 ($)
Figure 114: Malaysia Genomics Market Value & Volume, 2021-2026 ($)
Figure 115: Malaysia GDP and Population, 2018-2019 ($)
Figure 116: Malaysia GDP – Composition of 2018, By Sector of Origin
Figure 117: Malaysia Export and Import Value & Volume, 2018-2019 ($)
Figure 118: Hong Kong Genomics Market Value & Volume, 2021-2026 ($)
Figure 119: Hong Kong GDP and Population, 2018-2019 ($)
Figure 120: Hong Kong GDP – Composition of 2018, By Sector of Origin
Figure 121: Hong Kong Export and Import Value & Volume, 2018-2019 ($)
Figure 122: Middle East & Africa Genomics Market Middle East & Africa 3D Printing Market Value & Volume, 2021-2026 ($)
Figure 123: Russia Genomics Market Value & Volume, 2021-2026 ($)
Figure 124: Russia GDP and Population, 2018-2019 ($)
Figure 125: Russia GDP – Composition of 2018, By Sector of Origin
Figure 126: Russia Export and Import Value & Volume, 2018-2019 ($)
Figure 127: Israel Genomics Market Value & Volume, 2021-2026 ($)
Figure 128: Israel GDP and Population, 2018-2019 ($)
Figure 129: Israel GDP – Composition of 2018, By Sector of Origin
Figure 130: Israel Export and Import Value & Volume, 2018-2019 ($)
Figure 131: Entropy Share, By Strategies, 2018-2019* (%)Genomics Market
Figure 132: Developments, 2018-2019*Genomics Market
Figure 133: Company 1 Genomics Market Net Revenue, By Years, 2018-2019* ($)
Figure 134: Company 1 Genomics Market Net Revenue Share, By Business segments, 2018 (%)
Figure 135: Company 1 Genomics Market Net Sales Share, By Geography, 2018 (%)
Figure 136: Company 2 Genomics Market Net Revenue, By Years, 2018-2019* ($)
Figure 137: Company 2 Genomics Market Net Revenue Share, By Business segments, 2018 (%)
Figure 138: Company 2 Genomics Market Net Sales Share, By Geography, 2018 (%)
Figure 139: Company 3 Genomics Market Net Revenue, By Years, 2018-2019* ($)
Figure 140: Company 3 Genomics Market Net Revenue Share, By Business segments, 2018 (%)
Figure 141: Company 3 Genomics Market Net Sales Share, By Geography, 2018 (%)
Figure 142: Company 4 Genomics Market Net Revenue, By Years, 2018-2019* ($)
Figure 143: Company 4 Genomics Market Net Revenue Share, By Business segments, 2018 (%)
Figure 144: Company 4 Genomics Market Net Sales Share, By Geography, 2018 (%)
Figure 145: Company 5 Genomics Market Net Revenue, By Years, 2018-2019* ($)
Figure 146: Company 5 Genomics Market Net Revenue Share, By Business segments, 2018 (%)
Figure 147: Company 5 Genomics Market Net Sales Share, By Geography, 2018 (%)
Figure 148: Company 6 Genomics Market Net Revenue, By Years, 2018-2019* ($)
Figure 149: Company 6 Genomics Market Net Revenue Share, By Business segments, 2018 (%)
Figure 150: Company 6 Genomics Market Net Sales Share, By Geography, 2018 (%)
Figure 151: Company 7 Genomics Market Net Revenue, By Years, 2018-2019* ($)
Figure 152: Company 7 Genomics Market Net Revenue Share, By Business segments, 2018 (%)
Figure 153: Company 7 Genomics Market Net Sales Share, By Geography, 2018 (%)
Figure 154: Company 8 Genomics Market Net Revenue, By Years, 2018-2019* ($)
Figure 155: Company 8 Genomics Market Net Revenue Share, By Business segments, 2018 (%)
Figure 156: Company 8 Genomics Market Net Sales Share, By Geography, 2018 (%)
Figure 157: Company 9 Genomics Market Net Revenue, By Years, 2018-2019* ($)
Figure 158: Company 9 Genomics Market Net Revenue Share, By Business segments, 2018 (%)
Figure 159: Company 9 Genomics Market Net Sales Share, By Geography, 2018 (%)
Figure 160: Company 10 Genomics Market Net Revenue, By Years, 2018-2019* ($)
Figure 161: Company 10 Genomics Market Net Revenue Share, By Business segments, 2018 (%)
Figure 162: Company 10 Genomics Market Net Sales Share, By Geography, 2018 (%)
Figure 163: Company 11 Genomics Market Net Revenue, By Years, 2018-2019* ($)
Figure 164: Company 11 Genomics Market Net Revenue Share, By Business segments, 2018 (%)
Figure 165: Company 11 Genomics Market Net Sales Share, By Geography, 2018 (%)
Figure 166: Company 12 Genomics Market Net Revenue, By Years, 2018-2019* ($)
Figure 167: Company 12 Genomics Market Net Revenue Share, By Business segments, 2018 (%)
Figure 168: Company 12 Genomics Market Net Sales Share, By Geography, 2018 (%)
Figure 169: Company 13 Genomics Market Net Revenue, By Years, 2018-2019* ($)
Figure 170: Company 13 Genomics Market Net Revenue Share, By Business segments, 2018 (%)
Figure 171: Company 13 Genomics Market Net Sales Share, By Geography, 2018 (%)
Figure 172: Company 14 Genomics Market Net Revenue, By Years, 2018-2019* ($)
Figure 173: Company 14 Genomics Market Net Revenue Share, By Business segments, 2018 (%)
Figure 174: Company 14 Genomics Market Net Sales Share, By Geography, 2018 (%)
Figure 175: Company 15 Genomics Market Net Revenue, By Years, 2018-2019* ($)
Figure 176: Company 15 Genomics Market Net Revenue Share, By Business segments, 2018 (%)
Figure 177: Company 15 Genomics Market Net Sales Share, By Geography, 2018 (%)