Biomedical Sensor Market - Forecast(2024 - 2030)

Report Code: HCR 0029 Report Format: PDF + Excel

Biomedical Sensor Market Overview

The Biomedical Sensor Market size is estimated to reach $16.2 billion by 2027. Furthermore, it is poised to grow at a CAGR of 7.53% over the forecast period of 2022-2027. Biomedical sensors are special electronic devices that can transduce biomedical signals into measurable electrical signals. Such sensors are the key component in various medical diagnostic instruments and equipment. Some of the common sensors are blood glucose sensors, electrocardiogram sensors or ECG, pulse oximeters, and blood oxygen sensors. Research and extensive usage of such sensors is facilitated by the fact that they can improve the overall understanding of biological processes and technology, which can ease the diagnosis and treatment. Numerous discoveries and inventions in biomedical, physical, chemical, and electronic materials have quickly gained importance in applications for biomedical sensors, such as microstructure and integrated cell molecular detection sensors, drug analysis, screening sensors, and micro-nano implantable probes. The growing need to detect diseases and pathogens at early stages coupled with providing better medical assistance to decrease the fatality rates supplemented by superior medical diagnosis and treatment have been the key drivers for the Biomedical Sensors Industry for the projected period of 2022-2027.

Report Coverage

The report: Biomedical Sensor Market Forecast (2022-2027)”, by Industry ARC covers an in-depth analysis of the following segments of the Biomedical Sensor Market.

By Type- Wired and Wireless.
By Sensor Type- Physical Sensors, Chemical Sensors, Biopotential Electrodes, and Bioanalytic.  
By Industry- Pharmaceutical, Healthcare, and Others.
By Geography- North America (U.S., Canada, Mexico), Europe (Germany, United Kingdom (U.K.), France, Italy, Spain, Russia, and Rest of Europe), Asia Pacific (China, Japan India, South Korea, Australia, and New Zealand, and Rest of Asia Pacific), South America (Brazil, Argentina, and Rest of South America), and Rest of the World (the Middle East, and Africa)

Key Takeaways

  • Geographically, North America’s biomedical sensors market held a dominant market share in the year 2021. It is owing to two chief reasons, firstly countries like the US have been a forefront leader in medical expenditure, be it public health or research and development activities. Secondly, the consumption of such sensors has been immensely owing to the growing geriatric population with varied health conditions. However, Asia-Pacific is expected to offer lucrative growth opportunities to the marketers in the projected period of 2022-2027 owing to the growing inclination of nations to outsource manufacturing activities coupled with growing per capita income.
  • The growing need to detect diseases and pathogens at early stages coupled with providing better medical assistance to decrease the fatality rates supplemented by superior medical diagnosis and treatment have been the key drivers for the Biomedical Sensors Market. However, high cost associated coupled with high intricacy of device networks is some of the challenges faced by the market.
  • A detailed analysis of strengths, weaknesses, opportunities, and threats will be provided in the Biomedical Sensors Market Report.

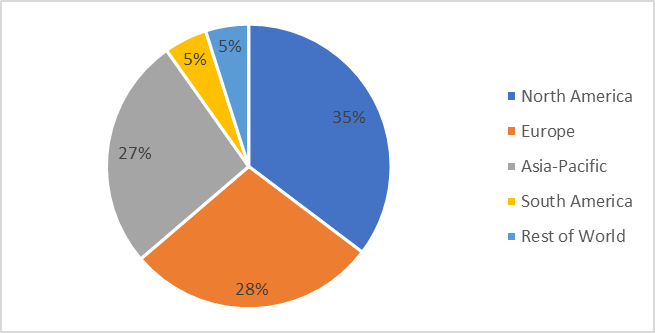
Biomedical Sensor Market- Geography (%) for 2021.

For more details on this report - Request for Sample

Biomedical Sensor Market Segmentation Analysis- By Sensor Type

The Biomedical Sensor Market based on sensor type can be further segmented into Physical Sensors, Chemical Sensors, Biopotential Electrodes, and Bioanalytic. Physical sensors held a dominant market share in the year 2021. It is owing to the vast array of sub-segments it holds, which helps the care providers to deliver efficient care and service. For example, mechanical, thermal, hydraulic, electric, and optical are some of the examples of common physical biomedical sensors. Blood pressure machines are one of the common examples of physical sensors and given the rise of people suffering from hypertension the demand for such devices/sensors have soared. Nearly one billion people or one in six people have hypertension.

However, bioanalytic or biosensors are estimated to be the fastest-growing, with a CAGR of 8.2% over the forecast period of 2022-2027. The following includes enzyme detection, antigen detection, antibody foundation, and other DNA and RNA sequencing formulations. The following class of sensors would be highly demanded in the future owing to the higher-case load in various malignancies. For example, around 100 various forms of antibodies are under review globally which have the potential to cure ailments and conditions such as Cancer and other neuro ailments.

Biomedical Sensor Market Segmentation Analysis- By Industry

The biomedical sensors market based on the industry can be further segmented into Pharmaceutical, Healthcare, and Others. Healthcare held a dominant market share in the year 2021. It is widely owing to the pandemic pressures, which forced people to rely on various forms of imaging sensors or blood glucose sensors, pulse oximeters, or even other chemical sensors. Globally, around 326 million people have been diagnosed with such a virus, while officials estimate the number of actual patients afflicted with the said virus to be close to 2-3 billion people.

However, the Pharmaceutical industry is estimated to be the fastest-growing, with a CAGR of 8.41% over the forecast period of 2022-2027. It is owing to the growing research and development activities being partaken in biotech and pharmaceutical industries to cure ailments and find cures with plausible detection and elimination standards. Since around 50 vaccines are under safety and dosage trials, 49 vaccines have entered into phase II trials, while around 4 vaccines are going through large-scale efficacy tests in phase III. Additionally, various drugs and monoclonal antibodies are being extensively researched, which would work on RBD than protein spikes. Owing to such reasons, the market is positioned favorably.

Biomedical Sensor Market Segmentation Analysis- By Geography

The biomedical sensors market based on geography can be further segmented into North America, Europe, Asia-Pacific, South America, and the Rest of the World. North America held a dominant market share of 35% as compared to the other regions in 2021. It is owing to two chief reasons, firstly countries like the US have been a forefront leader in medical expenditure, be it public health or research and development activities. Secondly, the consumption of such sensors has been immensely owing to the growing geriatric population with varied health conditions. For example, around 20% of US GDP or $4.1 trillion is spent on healthcare spending, which is by far the highest contribution and budget allotment for any country. Additionally, the said region has various pharma giants which allow for the active use of such sensors.

However, Asia-Pacific is expected to offer lucrative growth opportunities to marketers in the projected period of 2022-2027. It is owing to the significant rise in the cases of various diseases such as Diabetes and Hypertension. Additionally, most of the Asia-Pacific countries have noted an increase in the overall geriatric population which would further allow the market to hold great potential.

Biomedical Sensors Market Drivers

The growing proportion of the aging population coupled with new forms of diseases has been a key driver for the market.

The world is growing old, and the said fact has been accepted by various organizations such as CDC, WHO, and others. The brighter side of the said fact is that medical sciences have advanced to an extent, where a patient can live an extended life on supplemental forms of support such as ventilators and artificial hearts or key organs. As per CDC estimates, around 71 million people of the US will cross the threshold of 65 years and would represent close to 25% of the population, which currently is close to 19%. However, populations are burdened with diseases or have a general state of poor health. As per CDC reports, around 22.2% of those above 65 have “fair or poor health” and around 7% of the population need some form of personal care. Furthermore, hypertension or high blood pressure coupled with other cardiovascular diseases allows the use of biomedical sensors. Some forms of biomedical sensors used in gauging blood pressure are liquid coupling direct measurement, pipe-end sensing measurement, indirect blood pressure sensing measurement. 

The use of biomedical sensors in the field of nanotechnology along with continual improvements and developments in non-invasive medical applications have been a key driver for the market.

Nanotech enabled sensors to have been continually providing solutions in the field of physical, chemical, and biological sensing. The said sensing can increase the detection specificity, sensitivity, multiplexing capability, and portability for a wide series of health, safety, and environmental assessments. NNI (National Nanotechnology Initiative) agencies have been participating and providing coordinated efforts to stimulate the existing and emerging projects. Some of the major agencies are-> NIOSH, NIH, NSF, FDA, NASA, NIST, and CPSI. Scientists have found a way to form porous metal nanostructures in thin films. The findings could lead to improved biosensing devices in the future. Further, nanotechnology can be extensively used to treat diseases and conditions such as diabetes, cancer, and various neuro/cardiovascular diseases. As for 2020, around 490 million people suffer from diabetes globally and around 18.1 million cancer cases have been prevalent in the world for 2020.

Biomedical Sensor Market Challenges

Security concerns related to the use and transfer of patient information to the providers, supplemented by long-product development cycles and other harms caused by energy to one’s body pose themselves as unique challenges.

The cases of data breaches from the afflicted medical condition have been increasing throughout the world. As per reports more than 40 million healthcare records have been exposed or have been impermissibly disclosed over the period of 12 months. Additionally, around 674 reported breaches resulted in the infringement of data. On average, between July 2020 and June 2021, an average of 3,343,448 healthcare records were breached each month. Furthermore, machines/ medical sensors such as ECG provides massive amounts of radiation which can increase the overall risk of cancer. Owing to such risks, the overall risks are multiplied.

Biomedical Sensors Market Industry Outlook

Product launches, mergers and acquisitions, joint ventures, and geographical expansions are key strategies adopted by players in the Biomedical Sensor Market. Biomedical Sensors top 10 companies include:

  1. GE Healthcare
  2. Honeywell International Inc.
  3. STMicroelectronics N.V.
  4. First Sensor AG
  5. Medtronic PLC
  6. Smith’s Medicals
  7. Measurement Specialities
  8. Analog Devices
  9. Texas Instruments
  10. NXP Semiconductor

Recent Developments

  • In January 2022, Electronic Textile sensors have been studied to provide and decode vital body signals. The digitization of textiles (textronics) has created new opportunities for integration with conformable sensors to enable unobtrusive, noninvasive, and continuous decoding of vital body signals. it analyzes the performance characterization techniques currently used for these sensors and highlights the need for standardized test methods in the following aspects: biocompatibility, thermal and tactile comfort, aging, and operation of the biomedical sensing modality at a standard human stretch.
  • In January 2022, Electroninks has expanded the line of particle-free conductive inks with new gold and platinum formulations. The addition of gold and platinum inks gives makers of consumer electronics, medical devices, sensors, and semiconductors the ability to make lighter, less expensive, and more environmentally friendly products.  The new gold and platinum metal inks consist of metal-organic precursors that decompose cleanly at lower temperatures than nanoparticle inks and can be UV-cured. 
  • In December 2021, Pop-Up electronic sensors could now detect when individual heart cells would misbehave. Engineers at the University of California San Diego have developed a powerful new tool that monitors the electrical activity inside heart cells, using tiny "pop-up" sensors that poke into cells without damaging them. The device directly measures the movement and speed of electrical signals traveling within a single heart cell -- a first -- as well as between multiple heart cells. It is also the first to measure these signals inside the cells of 3D tissues.

Relevant Titles

Medical Sensors Market- Forecast (2022-2027)
Report Code- HCR 0140

pH Sensors Market- Forecast (2022-2027)
Report Code- AIR 0041 

For more Lifesciences and Healthcare related reports, please click here

1. Biomedical Sensor Market Overview
    1.1 Definitions and Scope
2. Biomedical Sensor Market- Executive Summary
3. Biomedical Sensor Market – Market Landscape
    3.1 Company Benchmarking- Key Companies
    3.2 Key Company Financial Analysis
    3.3 Market Share Analysis
    3.4 Patent Analysis
    3.5 Pricing Analysis (Comparison of General Price Offerings in the Market)
4. Biomedical Sensor Market – Startup Company Scenario (Premium)
    4.1 Investment
    4.2 Revenue
    4.3 Venture Capital and Funding Scenario
5. Biomedical Sensor Market – Industry Market Entry Scenario Premium (Premium)
    5.1 Regulatory Scenario
    5.2 New Business and Ease of Doing business index
    5.3 Case Studies of Successful Ventures
6. Biomedical Sensor Market - Market Forces
    6.1 Market Drivers
    6.2 Market Constraints
    6.3 Porters five force model
        6.3.1 Bargaining power of suppliers
        6.3.2 Bargaining powers of customers
        6.3.3 Threat of new entrants
        6.3.4 Rivalry among existing players
        6.3.5 Threat of substitutes
7. Biomedical Sensor Market – By Strategic Analysis
    7.1 Value Chain Analysis
    7.2 Opportunities Analysis
    7.3 Market Life Cycle Analysis
8. Biomedical Sensor Market- By Type (Market Size –$Million/$Billion) 
    8.1 Wired
    8.2 Wireless
9. Biomedical Sensor Market- By Sensor Type (Market Size –$Million/$Billion) 
    9.1 Physical Sensors
        9.1.1 Geometric
        9.1.2 Mechanical
        9.1.3 Thermal
        9.1.4 Hydraulic
        9.1.5 Electric
        9.1.6 Optical
    9.2 Chemical Sensors
        9.2.1 Gas
        9.2.2 Electrochemical
        9.2.3 Photometric
        9.2.4 Others
    9.3 Biopotential Sensors
        9.3.1 Body Surface Biopotential Electrode
        9.3.2 Metal Plate
        9.3.3 Intracavitary and Intratissue Electrode
        9.3.4 Microelectrode
    9.4 Bioanalytic Sensors
        9.4.1 Enzymes
        9.4.2 Protein
        9.4.3 Antigen
        9.4.4 Antibody
        9.4.5 Ligand
        9.4.6 Cell
        9.4.7 DNA
10. Biomedical Sensor Market- By Industry (Market Size –$Million/$Billion) 
    10.1 Pharmaceutical
    10.2 Healthcare
    10.3 Others
11. Biomedical Sensor Market - By Geography (Market Size -$Million/Billion)
    11.1 North America
        11.1.1 U.S
        11.1.2 Canada
        11.1.3 Mexico
    11.2 Europe
        11.2.1 Germany
        11.2.2 France
        11.2.3 UK
        11.2.4 Italy
        11.2.5 Spain
        11.2.6 Russia
        11.2.7 Rest of Europe
    11.3 Asia-Pacific
        11.3.1 China
        11.3.2 Japan
        11.3.3 South Korea
        11.3.4 India
        11.3.5 Australia & New Zealand
        11.3.6 Rest of APAC
    11.4 South America
        11.4.1 Brazil
        11.4.2 Argentina
        11.4.3 Chile
        11.4.4 Colombia
        11.4.5 Rest of South America
    11.5 Rest of the World
        11.5.1 Middle East
        11.5.2 Africa
12. Biomedical Sensor Market - Market Entropy
    12.1 New product launches
    12.2 M&A's, collaborations, JVs and partnerships
13. Biomedical Sensor Market – Industry Competition Landscape (Premium)
    13.1 Market Share Analysis
        13.1.1 Global Market Share – Key Companies
        13.1.2 Market Share by Region – Key Companies
        13.1.3 Market Share by Countries – Key Companies
    13.2 Competition Matrix
    13.3 Best Practices for Companies
14. Biomedical Sensor Market – Key Company List by Country Premium (Premium)
15. Biomedical Sensor Market - Company Analysis
    15.1 Company 1
    15.2 Company 2
    15.3 Company 3
    15.4 Company 4
    15.5 Company 5
    15.6 Company 6
    15.7 Company 7
    15.8 Company 8
    15.9 Company 9
    15.10 Company 10

"*Financials would be provided on a best-efforts basis for private companies
List of Tables:

Table1: Biomedical Sensor Market Overview 2021-2026
Table2: Biomedical Sensor Market Leader Analysis 2018-2019 (US$)
Table3: Biomedical Sensor Market Product Analysis 2018-2019 (US$)
Table4: Biomedical Sensor Market End User Analysis 2018-2019 (US$)
Table5: Biomedical Sensor Market Patent Analysis 2013-2018* (US$)
Table6: Biomedical Sensor Market Financial Analysis 2018-2019 (US$)
Table7: Biomedical Sensor Market Driver Analysis 2018-2019 (US$)
Table8: Biomedical Sensor Market Challenges Analysis 2018-2019 (US$)
Table9: Biomedical Sensor Market Constraint Analysis 2018-2019 (US$)
Table10: Biomedical Sensor Market Supplier Bargaining Power Analysis 2018-2019 (US$)
Table11: Biomedical Sensor Market Buyer Bargaining Power Analysis 2018-2019 (US$)
Table12: Biomedical Sensor Market Threat of Substitutes Analysis 2018-2019 (US$)
Table13: Biomedical Sensor Market Threat of New Entrants Analysis 2018-2019 (US$)
Table14: Biomedical Sensor Market Degree of Competition Analysis 2018-2019 (US$)
Table15: Biomedical Sensor Market Value Chain Analysis 2018-2019 (US$)
Table16: Biomedical Sensor Market Pricing Analysis 2021-2026 (US$)
Table17: Biomedical Sensor Market Opportunities Analysis 2021-2026 (US$)
Table18: Biomedical Sensor Market Product Life Cycle Analysis 2021-2026 (US$)
Table19: Biomedical Sensor Market Supplier Analysis 2018-2019 (US$)
Table20: Biomedical Sensor Market Distributor Analysis 2018-2019 (US$)
Table21: Biomedical Sensor Market Trend Analysis 2018-2019 (US$)
Table22: Biomedical Sensor Market Size 2018 (US$)
Table23: Biomedical Sensor Market Forecast Analysis 2021-2026 (US$)
Table24: Biomedical Sensor Market Sales Forecast Analysis 2021-2026 (Units)
Table25: Biomedical Sensor Market, Revenue & Volume,by type/parameter, 2021-2026 ($)
Table26: Biomedical Sensor Market by type/parameter, Revenue & Volume,Temperature, 2021-2026 ($)
Table27: Biomedical Sensor Market by type/parameter, Revenue & Volume,Pressure, 2021-2026 ($)
Table28: Biomedical Sensor Market by type/parameter, Revenue & Volume,Coronary Imaging, 2021-2026 ($)
Table29: Biomedical Sensor Market by type/parameter, Revenue & Volume,Oxygenation, 2021-2026 ($)
Table30: Biomedical Sensor Market by type/parameter, Revenue & Volume,Pulse Oximeter, 2021-2026 ($)
Table31: Biomedical Sensor Market, Revenue & Volume,Applications, 2021-2026 ($)
Table32: Biomedical Sensor Market Applications, Revenue & Volume,In-Vitro, 2021-2026 ($)
Table33: Biomedical Sensor Market Applications, Revenue & Volume,Noninvasive, 2021-2026 ($)
Table34: Biomedical Sensor Market Applications, Revenue & Volume,Minimally invasive, 2021-2026 ($)
Table35: Biomedical Sensor Market Applications, Revenue & Volume,Invasive, 2021-2026 ($)
Table36: Biomedical Sensor Market Applications, Revenue & Volume,Vivo, 2021-2026 ($)
Table37: North America Biomedical Sensor Market, Revenue & Volume,by type/parameter, 2021-2026 ($)
Table38: North America Biomedical Sensor Market, Revenue & Volume,Applications, 2021-2026 ($)
Table39: South america Biomedical Sensor Market, Revenue & Volume,by type/parameter, 2021-2026 ($)
Table40: South america Biomedical Sensor Market, Revenue & Volume,Applications, 2021-2026 ($)
Table41: Europe Biomedical Sensor Market, Revenue & Volume,by type/parameter, 2021-2026 ($)
Table42: Europe Biomedical Sensor Market, Revenue & Volume,Applications, 2021-2026 ($)
Table43: APAC Biomedical Sensor Market, Revenue & Volume,by type/parameter, 2021-2026 ($)
Table44: APAC Biomedical Sensor Market, Revenue & Volume,Applications, 2021-2026 ($)
Table45: Middle East & Africa Biomedical Sensor Market, Revenue & Volume,by type/parameter, 2021-2026 ($)
Table46: Middle East & Africa Biomedical Sensor Market, Revenue & Volume,Applications, 2021-2026 ($)
Table47: Russia Biomedical Sensor Market, Revenue & Volume,by type/parameter, 2021-2026 ($)
Table48: Russia Biomedical Sensor Market, Revenue & Volume,Applications, 2021-2026 ($)
Table49: Israel Biomedical Sensor Market, Revenue & Volume,by type/parameter, 2021-2026 ($)
Table50: Israel Biomedical Sensor Market, Revenue & Volume,Applications, 2021-2026 ($)
Table51: Top Companies 2018 (US$) Biomedical Sensor Market, Revenue & Volume,,
Table52: Product Launch 2018-2019 Biomedical Sensor Market, Revenue & Volume,,
Table53: Mergers & Acquistions 2018-2019 Biomedical Sensor Market, Revenue & Volume,,


List of Figures:

Figure 1: Overview of Biomedical Sensor Market 2021-2026
Figure 2: Market Share Analysis for Biomedical Sensor Market 2018 (US$)
Figure 3: Product Comparison in Biomedical Sensor Market 2018-2019 (US$)
Figure 4: End User Profile for Biomedical Sensor Market 2018-2019 (US$)
Figure 5: Patent Application and Grant in Biomedical Sensor Market 2013-2018* (US$)
Figure 6: Top 5 Companies Financial Analysis in Biomedical Sensor Market 2018-2019 (US$)
Figure 7: Market Entry Strategy in Biomedical Sensor Market 2018-2019
Figure 8: Ecosystem Analysis in Biomedical Sensor Market 2018
Figure 9: Average Selling Price in Biomedical Sensor Market 2021-2026
Figure 10: Top Opportunites in Biomedical Sensor Market 2018-2019
Figure 11: Market Life Cycle Analysis in Biomedical Sensor Market
Figure 12: Globalby type/parameter Biomedical Sensor Market Revenue, 2021-2026 ($)
Figure 13: GlobalApplications Biomedical Sensor Market Revenue, 2021-2026 ($)
Figure 14: Global Biomedical Sensor Market - By Geography
Figure 15: Global Biomedical Sensor Market Value & Volume, By Geography, 2021-2026 ($) 
Figure 16: Global Biomedical Sensor Market CAGR, By Geography, 2021-2026 (%)
Figure 17: North America Biomedical Sensor Market Value & Volume, 2021-2026 ($)
Figure 18: US Biomedical Sensor Market Value & Volume, 2021-2026 ($)
Figure 19: US GDP and Population, 2018-2019 ($)
Figure 20: US GDP – Composition of 2018, By Sector of Origin
Figure 21: US Export and Import Value & Volume, 2018-2019 ($)
Figure 22: Canada Biomedical Sensor Market Value & Volume, 2021-2026 ($)
Figure 23: Canada GDP and Population, 2018-2019 ($)
Figure 24: Canada GDP – Composition of 2018, By Sector of Origin
Figure 25: Canada Export and Import Value & Volume, 2018-2019 ($)
Figure 26: Mexico Biomedical Sensor Market Value & Volume, 2021-2026 ($)
Figure 27: Mexico GDP and Population, 2018-2019 ($)
Figure 28: Mexico GDP – Composition of 2018, By Sector of Origin
Figure 29: Mexico Export and Import Value & Volume, 2018-2019 ($)
Figure 30: South America Biomedical Sensor Market Value & Volume, 2021-2026 ($)
Figure 31: Brazil Biomedical Sensor Market Value & Volume, 2021-2026 ($)
Figure 32: Brazil GDP and Population, 2018-2019 ($)
Figure 33: Brazil GDP – Composition of 2018, By Sector of Origin
Figure 34: Brazil Export and Import Value & Volume, 2018-2019 ($)
Figure 35: Venezuela Biomedical Sensor Market Value & Volume, 2021-2026 ($)
Figure 36: Venezuela GDP and Population, 2018-2019 ($)
Figure 37: Venezuela GDP – Composition of 2018, By Sector of Origin
Figure 38: Venezuela Export and Import Value & Volume, 2018-2019 ($)
Figure 39: Argentina Biomedical Sensor Market Value & Volume, 2021-2026 ($)
Figure 40: Argentina GDP and Population, 2018-2019 ($)
Figure 41: Argentina GDP – Composition of 2018, By Sector of Origin
Figure 42: Argentina Export and Import Value & Volume, 2018-2019 ($)
Figure 43: Ecuador Biomedical Sensor Market Value & Volume, 2021-2026 ($)
Figure 44: Ecuador GDP and Population, 2018-2019 ($)
Figure 45: Ecuador GDP – Composition of 2018, By Sector of Origin
Figure 46: Ecuador Export and Import Value & Volume, 2018-2019 ($)
Figure 47: Peru Biomedical Sensor Market Value & Volume, 2021-2026 ($)
Figure 48: Peru GDP and Population, 2018-2019 ($)
Figure 49: Peru GDP – Composition of 2018, By Sector of Origin
Figure 50: Peru Export and Import Value & Volume, 2018-2019 ($)
Figure 51: Colombia Biomedical Sensor Market Value & Volume, 2021-2026 ($)
Figure 52: Colombia GDP and Population, 2018-2019 ($)
Figure 53: Colombia GDP – Composition of 2018, By Sector of Origin
Figure 54: Colombia Export and Import Value & Volume, 2018-2019 ($)
Figure 55: Costa Rica Biomedical Sensor Market Value & Volume, 2021-2026 ($)
Figure 56: Costa Rica GDP and Population, 2018-2019 ($)
Figure 57: Costa Rica GDP – Composition of 2018, By Sector of Origin
Figure 58: Costa Rica Export and Import Value & Volume, 2018-2019 ($)
Figure 59: Europe Biomedical Sensor Market Value & Volume, 2021-2026 ($)
Figure 60: U.K Biomedical Sensor Market Value & Volume, 2021-2026 ($)
Figure 61: U.K GDP and Population, 2018-2019 ($)
Figure 62: U.K GDP – Composition of 2018, By Sector of Origin
Figure 63: U.K Export and Import Value & Volume, 2018-2019 ($)
Figure 64: Germany Biomedical Sensor Market Value & Volume, 2021-2026 ($)
Figure 65: Germany GDP and Population, 2018-2019 ($)
Figure 66: Germany GDP – Composition of 2018, By Sector of Origin
Figure 67: Germany Export and Import Value & Volume, 2018-2019 ($)
Figure 68: Italy Biomedical Sensor Market Value & Volume, 2021-2026 ($)
Figure 69: Italy GDP and Population, 2018-2019 ($)
Figure 70: Italy GDP – Composition of 2018, By Sector of Origin
Figure 71: Italy Export and Import Value & Volume, 2018-2019 ($)
Figure 72: France Biomedical Sensor Market Value & Volume, 2021-2026 ($)
Figure 73: France GDP and Population, 2018-2019 ($)
Figure 74: France GDP – Composition of 2018, By Sector of Origin
Figure 75: France Export and Import Value & Volume, 2018-2019 ($)
Figure 76: Netherlands Biomedical Sensor Market Value & Volume, 2021-2026 ($)
Figure 77: Netherlands GDP and Population, 2018-2019 ($)
Figure 78: Netherlands GDP – Composition of 2018, By Sector of Origin
Figure 79: Netherlands Export and Import Value & Volume, 2018-2019 ($)
Figure 80: Belgium Biomedical Sensor Market Value & Volume, 2021-2026 ($)
Figure 81: Belgium GDP and Population, 2018-2019 ($)
Figure 82: Belgium GDP – Composition of 2018, By Sector of Origin
Figure 83: Belgium Export and Import Value & Volume, 2018-2019 ($)
Figure 84: Spain Biomedical Sensor Market Value & Volume, 2021-2026 ($)
Figure 85: Spain GDP and Population, 2018-2019 ($)
Figure 86: Spain GDP – Composition of 2018, By Sector of Origin
Figure 87: Spain Export and Import Value & Volume, 2018-2019 ($)
Figure 88: Denmark Biomedical Sensor Market Value & Volume, 2021-2026 ($)
Figure 89: Denmark GDP and Population, 2018-2019 ($)
Figure 90: Denmark GDP – Composition of 2018, By Sector of Origin
Figure 91: Denmark Export and Import Value & Volume, 2018-2019 ($)
Figure 92: APAC Biomedical Sensor Market Value & Volume, 2021-2026 ($)
Figure 93: China Biomedical Sensor Market Value & Volume, 2021-2026
Figure 94: China GDP and Population, 2018-2019 ($)
Figure 95: China GDP – Composition of 2018, By Sector of Origin
Figure 96: China Export and Import Value & Volume, 2018-2019 ($) Biomedical Sensor Market China Export and Import Value & Volume, 2018-2019 ($)
Figure 97: Australia Biomedical Sensor Market Value & Volume, 2021-2026 ($)
Figure 98: Australia GDP and Population, 2018-2019 ($)
Figure 99: Australia GDP – Composition of 2018, By Sector of Origin
Figure 100: Australia Export and Import Value & Volume, 2018-2019 ($)
Figure 101: South Korea Biomedical Sensor Market Value & Volume, 2021-2026 ($)
Figure 102: South Korea GDP and Population, 2018-2019 ($)
Figure 103: South Korea GDP – Composition of 2018, By Sector of Origin
Figure 104: South Korea Export and Import Value & Volume, 2018-2019 ($)
Figure 105: India Biomedical Sensor Market Value & Volume, 2021-2026 ($)
Figure 106: India GDP and Population, 2018-2019 ($)
Figure 107: India GDP – Composition of 2018, By Sector of Origin
Figure 108: India Export and Import Value & Volume, 2018-2019 ($)
Figure 109: Taiwan Biomedical Sensor Market Value & Volume, 2021-2026 ($)
Figure 110: Taiwan GDP and Population, 2018-2019 ($)
Figure 111: Taiwan GDP – Composition of 2018, By Sector of Origin
Figure 112: Taiwan Export and Import Value & Volume, 2018-2019 ($)
Figure 113: Malaysia Biomedical Sensor Market Value & Volume, 2021-2026 ($)
Figure 114: Malaysia GDP and Population, 2018-2019 ($)
Figure 115: Malaysia GDP – Composition of 2018, By Sector of Origin
Figure 116: Malaysia Export and Import Value & Volume, 2018-2019 ($)
Figure 117: Hong Kong Biomedical Sensor Market Value & Volume, 2021-2026 ($)
Figure 118: Hong Kong GDP and Population, 2018-2019 ($)
Figure 119: Hong Kong GDP – Composition of 2018, By Sector of Origin
Figure 120: Hong Kong Export and Import Value & Volume, 2018-2019 ($)
Figure 121: Middle East & Africa Biomedical Sensor Market Middle East & Africa 3D Printing Market Value & Volume, 2021-2026 ($)
Figure 122: Russia Biomedical Sensor Market Value & Volume, 2021-2026 ($)
Figure 123: Russia GDP and Population, 2018-2019 ($)
Figure 124: Russia GDP – Composition of 2018, By Sector of Origin
Figure 125: Russia Export and Import Value & Volume, 2018-2019 ($)
Figure 126: Israel Biomedical Sensor Market Value & Volume, 2021-2026 ($)
Figure 127: Israel GDP and Population, 2018-2019 ($)
Figure 128: Israel GDP – Composition of 2018, By Sector of Origin
Figure 129: Israel Export and Import Value & Volume, 2018-2019 ($)
Figure 130: Entropy Share, By Strategies, 2018-2019* (%) Biomedical Sensor Market 
Figure 131: Developments, 2018-2019* Biomedical Sensor Market 
Figure 132: Company 1 Biomedical Sensor Market Net Revenue, By Years, 2018-2019* ($)
Figure 133: Company 1 Biomedical Sensor Market Net Revenue Share, By Business segments, 2018 (%)
Figure 134: Company 1 Biomedical Sensor Market Net Sales Share, By Geography, 2018 (%)
Figure 135: Company 2 Biomedical Sensor Market Net Revenue, By Years, 2018-2019* ($)
Figure 136: Company 2 Biomedical Sensor Market Net Revenue Share, By Business segments, 2018 (%)
Figure 137: Company 2 Biomedical Sensor Market Net Sales Share, By Geography, 2018 (%)
Figure 138: Company 3 Biomedical Sensor Market Net Revenue, By Years, 2018-2019* ($)
Figure 139: Company 3 Biomedical Sensor Market Net Revenue Share, By Business segments, 2018 (%)
Figure 140: Company 3 Biomedical Sensor Market Net Sales Share, By Geography, 2018 (%)
Figure 141: Company 4 Biomedical Sensor Market Net Revenue, By Years, 2018-2019* ($)
Figure 142: Company 4 Biomedical Sensor Market Net Revenue Share, By Business segments, 2018 (%)
Figure 143: Company 4 Biomedical Sensor Market Net Sales Share, By Geography, 2018 (%)
Figure 144: Company 5 Biomedical Sensor Market Net Revenue, By Years, 2018-2019* ($)
Figure 145: Company 5 Biomedical Sensor Market Net Revenue Share, By Business segments, 2018 (%)
Figure 146: Company 5 Biomedical Sensor Market Net Sales Share, By Geography, 2018 (%)
Figure 147: Company 6 Biomedical Sensor Market Net Revenue, By Years, 2018-2019* ($)
Figure 148: Company 6 Biomedical Sensor Market Net Revenue Share, By Business segments, 2018 (%)
Figure 149: Company 6 Biomedical Sensor Market Net Sales Share, By Geography, 2018 (%)
Figure 150: Company 7 Biomedical Sensor Market Net Revenue, By Years, 2018-2019* ($)
Figure 151: Company 7 Biomedical Sensor Market Net Revenue Share, By Business segments, 2018 (%)
Figure 152: Company 7 Biomedical Sensor Market Net Sales Share, By Geography, 2018 (%)
Figure 153: Company 8 Biomedical Sensor Market Net Revenue, By Years, 2018-2019* ($)
Figure 154: Company 8 Biomedical Sensor Market Net Revenue Share, By Business segments, 2018 (%)
Figure 155: Company 8 Biomedical Sensor Market Net Sales Share, By Geography, 2018 (%)
Figure 156: Company 9 Biomedical Sensor Market Net Revenue, By Years, 2018-2019* ($)
Figure 157: Company 9 Biomedical Sensor Market Net Revenue Share, By Business segments, 2018 (%)
Figure 158: Company 9 Biomedical Sensor Market Net Sales Share, By Geography, 2018 (%)
Figure 159: Company 10 Biomedical Sensor Market Net Revenue, By Years, 2018-2019* ($)
Figure 160: Company 10 Biomedical Sensor Market Net Revenue Share, By Business segments, 2018 (%)
Figure 161: Company 10 Biomedical Sensor Market Net Sales Share, By Geography, 2018 (%)
Figure 162: Company 11 Biomedical Sensor Market Net Revenue, By Years, 2018-2019* ($)
Figure 163: Company 11 Biomedical Sensor Market Net Revenue Share, By Business segments, 2018 (%)
Figure 164: Company 11 Biomedical Sensor Market Net Sales Share, By Geography, 2018 (%)
Figure 165: Company 12 Biomedical Sensor Market Net Revenue, By Years, 2018-2019* ($)
Figure 166: Company 12 Biomedical Sensor Market Net Revenue Share, By Business segments, 2018 (%)
Figure 167: Company 12 Biomedical Sensor Market Net Sales Share, By Geography, 2018 (%)
Figure 168: Company 13 Biomedical Sensor Market Net Revenue, By Years, 2018-2019* ($)
Figure 169: Company 13 Biomedical Sensor Market Net Revenue Share, By Business segments, 2018 (%)
Figure 170: Company 13 Biomedical Sensor Market Net Sales Share, By Geography, 2018 (%)
Figure 171: Company 14 Biomedical Sensor Market Net Revenue, By Years, 2018-2019* ($)
Figure 172: Company 14 Biomedical Sensor Market Net Revenue Share, By Business segments, 2018 (%)
Figure 173: Company 14 Biomedical Sensor Market Net Sales Share, By Geography, 2018 (%)
Figure 174: Company 15 Biomedical Sensor Market Net Revenue, By Years, 2018-2019* ($)
Figure 175: Company 15 Biomedical Sensor Market Net Revenue Share, By Business segments, 2018 (%)
Figure 176: Company 15 Biomedical Sensor Market Net Sales Share, By Geography, 2018 (%)