 Email
Email Print
Print


Cheese Market Overview
Cheese Market size is estimated to reach $157.2 billion by 2027, growing at a CAGR of 3.7% during the forecast period 2022-2027. Cheese is a dairy product generated by an extensive series of flavors, textures and forms by the coagulation of milk protein termed casein. Cheddar cheese is manufactured all over the world. Fresh mozzarella is typically white, however when seasoned it turns to a light yellow relying on the animal's daily intake of food. Certain people view parmesan cheese as a functional food. American cheese is a kind of pasteurized processed cheese. Blue cheese is a semi-soft cheese with a cutting, salted flavor. Cheese prepared from the milk of 100 percent grass-fed animals is the greatest in nutrients and also includes omega-3 fatty acids and vitamin K-2. The surging application of processed cheese including American cheese in regional cuisines and fast food products is set to drive the Cheese Market. The emergence of private labels in developing nations is set to propel the growth of the Cheese Industry during the forecast period 2022-2027. This represents the Cheese Industry Outlook.
Cheese Market Report Coverage
The “Cheese Market Report - Forecast
(2022-2027)” by IndustryARC, covers an in-depth analysis of the following
segments in the Cheese
Market.
Key Takeaways
- Geographically, Europe (Cheese market share) accounted for the highest revenue share in 2021 and it is poised to dominate the market over the period 2022-2027 owing to soaring per capita intake of cheese including Mozzarella cheese in countries like the Czech Republic, Germany and France in the European region.
- Cheese Market growth is being driven by the emerging leverage of western cuisines involving the application of cheddar cheese. However, the short shelf life of cheese is one of the major factors hampering the growth of the Cheese Market.
- Cheese Market Detailed Analysis on the Strength, Weakness and Opportunities of the prominent players operating in the market will be provided in the Cheese Market report.
Cheese
Market Segment Analysis - by Product Type
The Cheese Market based on product type can be further segmented into Mozzarella Cheese, Cheddar Cheese, Parmesan Cheese and Others. The Cheddar Cheese Segment held the largest Cheese market share in 2021. This growth is owing to the surging intake of cheddar cheese attributed to cheddar being a wonderful source of protein. American cheese is a typical constituent in certain classic American dishes like cheeseburgers and grilled cheese sandwiches. The soaring content of calcium in Cheddar Cheese is further propelling the growth of the Cheddar Cheese segment. Furthermore, the Mozzarella Cheese segment is estimated to grow with the fastest CAGR of 4.3% during the forecast period 2022-2027 owing to upsurging applications of mozzarella cheese in homemade pizzas and homemade cheese curds together with mozzarella cheese being a source of biotin and niacin.
Cheese
Market Segment Analysis - by Distribution Channel
The Cheese Market based on distribution channels can be further segmented into Supermarkets And Hypermarkets, Convenience Stores, Specialty Stores, Online Stores and Others. The Online Stores Segment held the largest Cheese market share in 2021. This growth is owing to skyrocketing application of e-commerce-based websites for the purchase of different kinds of cheese like American Cheese online. The effortless accessibility of cheese products at the click of a button is further propelling the growth of this segment. Furthermore, the Supermarkets And Hypermarkets segment is estimated to grow with the fastest CAGR of 4.5% during the forecast period 2022-2027 owing to the snowballing product accessibility and enormous product options pertaining to cheese products like Mozzarella cheese and Parmesan cheese backed by convenient shopping experiences for buyers and adherence to quality assurance.
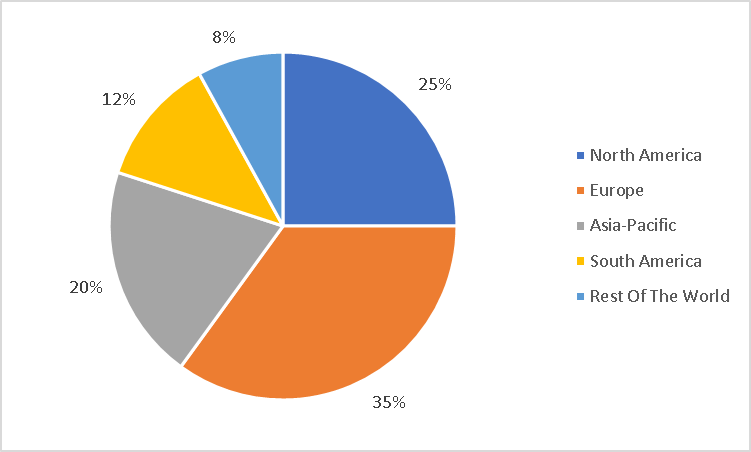
Cheese Market Segment Analysis - by Geography
Europe (Cheese Market) held the largest Cheese market share with 35% of the overall market in 2021. The growth of this region is owing to a surging intake of cheese like cheddar cheese and mozzarella cheese in the European region. The soaring application of Parmesan cheese shredded over pasta dishes is further propelling the growth of the Cheese Industry, thereby contributing to the Cheese Industry Outlook, in the European region. Furthermore, the Asia-Pacific region is estimated to be the region with the fastest CAGR over the forecast period 2022-2027. This growth is owing to factors like heightened intake of American Cheese in the Asia-Pacific region. The expanding application of Cheese in fast food items like burgers, pasta and pizza. is further fuelling the progress of the Cheese Market in the Asia-Pacific region.
Cheese Market Drivers
Surging Health Advantages of Blue Cheese are Projected to Drive the Growth of the Cheese Market:
Blue cheese is abundant in nutrients and offers an assortment of noteworthy health advantages. For example, blue cheese provides soaring calcium content even in comparison with additional kinds of cheese. A once-ounce serving of blue cheese includes 150mg of calcium. Owing to the great calcium content, blue cheese may assist people in accomplishing healthier bone density. Over time, intake of blue cheese safeguards bone health and assists in decreasing the hazard of developing osteoporosis. Intake of blue cheese may assist in the avoidance of obesity and decrease the hazard of cardiovascular disease. The surging health advantages of blue cheese are therefore fuelling the growth of the Cheese Market during the forecast period 2022-2027.
For More Details on This Report - Request for Sample
Soaring Significance of Omega-3 Fatty Acids in Cheese is Expected to Boost the Growth of the Cheese industry:
As per the Daily Mail, an investigation by U.S. and Australian researchers including 1000 adults, discovered that those who routinely consume dairy products like milk, cheese and yogurt have superior scores on tests of mental ability than people who seldom partake in dairy products. As per U.S. Investigation, including 104 pensioners, where scientists discovered senior people with greater levels of beneficial fats in their blood had low brain shrinkage usual of Alzheimer’s disease. These beneficial fats are omega-3 fatty acids discovered in foods like oily fish. A 2-ounce serving of fontina cheese offers 448mg of omega-3 fatty acids. The soaring significance of Omega-3 Fatty Acids in Cheese is therefore driving the growth of the Cheese Industry, thereby contributing to the Cheese Industry Outlook during the forecast period 2022-2027.
Cheese Market Challenges
Existence of Lactose in Cheddar, High Calories in Cheddar Cheese and Dairy Allergies are Hampering the Growth of the Cheese Market:
Lactose intolerance is a great issue and nearly 65-70% of the global population is lactose intolerant. Cheddar includes a tiny quantity of lactose. Unfortunately, when lactose-intolerant people partake in lactose, they may experience abdominal pain, bloating and diarrhea among others. Cheddar cheese is high in calories. Liquefying 200 grams of cheddar cheese on a steak can contribute to calories fast if performed on a regular basis. A very tiny portion of the populace may have allergic reactions to cheese. These issues are thus hampering the growth of the Cheese Market.
Cheese Industry Outlook
Novel product development, mergers and acquisitions, expansions and partnerships are key strategies adopted by players in the Cheese Market. The top 10 companies in the Cheese market are:
- The Kraft Heinz Company
- Almarai
- Associated Milk Producers Inc.
- Britannia Industries
- Arla Foods
- GCMMF (Amul)
- GROUP LACTALIS
- Fonterra
- FrieslandCampina Professional
- Dairy Farmers of America
Recent Developments
- In November 2021, The Kraft Heinz Company declared that it has finished the sale of some assets in its global cheese business and the license of certain trademarks This was performed to an affiliate of Groupe Lactalis for total consideration of nearly $3.3 billion. This involves cash consideration of nearly $3.2 billion.
- In October 2022, Kraft Heinz introduced vegan cheese singles in 3 flavors. Kraft Heinz and food tech firm NotCo are issuing a dairy-free version of classic Kraft singles American cheese slices this year. This release is being performed as of the earliest products under their partnership.
- In September 2021, the Kraft Heinz Company declared Philadelphia® Cream Cheese Launches Single-Serve Cheesecake. This was performed to assist in preventing the last-bite dilemma. The brand is demonstrating how the last bite dilemma can intensify in a short film.
Relevant Reports:
Report
Code: FBR
0502
Report Code: FBR
0439
Report Code: FBR 14697
For more Food and Beverage Market reports, please click here
Table 1: Cheese Market Overview 2023-2030
Table 2: Cheese Market Leader Analysis 2023-2024 (US$)
Table 3: Cheese Market Product Analysis 2023-2024 (US$)
Table 4: Cheese Market End User Analysis 2023-2024 (US$)
Table 5: Cheese Market Patent Analysis 2021-2023* (US$)
Table 6: Cheese Market Financial Analysis 2023-2024 (US$)
Table 7: Cheese Market Driver Analysis 2023-2024 (US$)
Table 8: Cheese Market Challenges Analysis 2023-2024 (US$)
Table 9: Cheese Market Constraint Analysis 2023-2024 (US$)
Table 10: Cheese Market Supplier Bargaining Power Analysis 2023-2024 (US$)
Table 11: Cheese Market Buyer Bargaining Power Analysis 2023-2024 (US$)
Table 12: Cheese Market Threat of Substitutes Analysis 2023-2024 (US$)
Table 13: Cheese Market Threat of New Entrants Analysis 2023-2024 (US$)
Table 14: Cheese Market Degree of Competition Analysis 2023-2024 (US$)
Table 15: Cheese Market Value Chain Analysis 2023-2024 (US$)
Table 16: Cheese Market Pricing Analysis 2023-2030 (US$)
Table 17: Cheese Market Opportunities Analysis 2023-2030 (US$)
Table 18: Cheese Market Product Life Cycle Analysis 2023-2030 (US$)
Table 19: Cheese Market Supplier Analysis 2023-2024 (US$)
Table 20: Cheese Market Distributor Analysis 2023-2024 (US$)
Table 21: Cheese Market Trend Analysis 2023-2024 (US$)
Table 22: Cheese Market Size 2023 (US$)
Table 23: Cheese Market Forecast Analysis 2023-2030 (US$)
Table 24: Cheese Market Sales Forecast Analysis 2023-2030 (Units)
Table 25: Cheese Market, Revenue & Volume, By Product Type, 2023-2030 ($)
Table 26: Cheese Market By Product Type, Revenue & Volume, By Cheddar and cheddar types, 2023-2030 ($)
Table 27: Cheese Market By Product Type, Revenue & Volume, By Mozzarella and semi-soft cheeses, 2023-2030 ($)
Table 28: Cheese Market By Product Type, Revenue & Volume, By Processed cheese, 2023-2030 ($)
Table 29: Cheese Market By Product Type, Revenue & Volume, By Cream and soft cheeses, 2023-2030 ($)
Table 30: Cheese Market By Product Type, Revenue & Volume, By Fresh and natural cheeses, 2023-2030 ($)
Table 31: Cheese Market, Revenue & Volume, By Milk Source, 2023-2030 ($)
Table 32: Cheese Market By Milk Source, Revenue & Volume, By Cow, 2023-2030 ($)
Table 33: Cheese Market By Milk Source, Revenue & Volume, By Sheep, 2023-2030 ($)
Table 34: Cheese Market By Milk Source, Revenue & Volume, By Goat, 2023-2030 ($)
Table 35: Cheese Market By Milk Source, Revenue & Volume, By Buffalo, 2023-2030 ($)
Table 36: Cheese Market, Revenue & Volume, By Distribution Channel, 2023-2030 ($)
Table 37: Cheese Market By Distribution Channel, Revenue & Volume, By SuperMarket s/HyperMarket s, 2023-2030 ($)
Table 38: Cheese Market By Distribution Channel, Revenue & Volume, By Online stores, 2023-2030 ($)
Table 39: Cheese Market By Distribution Channel, Revenue & Volume, By Convenience stores, 2023-2030 ($)
Table 40: North America Cheese Market, Revenue & Volume, By Product Type, 2023-2030 ($)
Table 41: North America Cheese Market, Revenue & Volume, By Milk Source, 2023-2030 ($)
Table 42: North America Cheese Market, Revenue & Volume, By Distribution Channel, 2023-2030 ($)
Table 43: South america Cheese Market, Revenue & Volume, By Product Type, 2023-2030 ($)
Table 44: South america Cheese Market, Revenue & Volume, By Milk Source, 2023-2030 ($)
Table 45: South america Cheese Market, Revenue & Volume, By Distribution Channel, 2023-2030 ($)
Table 46: Europe Cheese Market, Revenue & Volume, By Product Type, 2023-2030 ($)
Table 47: Europe Cheese Market, Revenue & Volume, By Milk Source, 2023-2030 ($)
Table 48: Europe Cheese Market, Revenue & Volume, By Distribution Channel, 2023-2030 ($)
Table 49: APAC Cheese Market, Revenue & Volume, By Product Type, 2023-2030 ($)
Table 50: APAC Cheese Market, Revenue & Volume, By Milk Source, 2023-2030 ($)
Table 51: APAC Cheese Market, Revenue & Volume, By Distribution Channel, 2023-2030 ($)
Table 52: Middle East & Africa Cheese Market, Revenue & Volume, By Product Type, 2023-2030 ($)
Table 53: Middle East & Africa Cheese Market, Revenue & Volume, By Milk Source, 2023-2030 ($)
Table 54: Middle East & Africa Cheese Market, Revenue & Volume, By Distribution Channel, 2023-2030 ($)
Table 55: Russia Cheese Market, Revenue & Volume, By Product Type, 2023-2030 ($)
Table 56: Russia Cheese Market, Revenue & Volume, By Milk Source, 2023-2030 ($)
Table 57: Russia Cheese Market, Revenue & Volume, By Distribution Channel, 2023-2030 ($)
Table 58: Israel Cheese Market, Revenue & Volume, By Product Type, 2023-2030 ($)
Table 59: Israel Cheese Market, Revenue & Volume, By Milk Source, 2023-2030 ($)
Table 60: Israel Cheese Market, Revenue & Volume, By Distribution Channel, 2023-2030 ($)
Table 61: Top Companies 2023 (US$) Cheese Market, Revenue & Volume
Table 62: Product Launch 2023-2024 Cheese Market, Revenue & Volume
Table 63: Mergers & Acquistions 2023-2024 Cheese Market, Revenue & Volume
List of Figures:
Figure 1: Overview of Cheese Market 2023-2030
Figure 2: Market Share Analysis for Cheese Market 2023 (US$)
Figure 3: Product Comparison in Cheese Market 2023-2024 (US$)
Figure 4: End User Profile for Cheese Market 2023-2024 (US$)
Figure 5: Patent Application and Grant in Cheese Market 2021-2023* (US$)
Figure 6: Top 5 Companies Financial Analysis in Cheese Market 2023-2024 (US$)
Figure 7: Market Entry Strategy in Cheese Market 2023-2024
Figure 8: Ecosystem Analysis in Cheese Market 2023
Figure 9: Average Selling Price in Cheese Market 2023-2030
Figure 10: Top Opportunites in Cheese Market 2023-2024
Figure 11: Market Life Cycle Analysis in Cheese Market
Figure 12: GlobalBy Product Type Cheese Market Revenue, 2023-2030 ($)
Figure 13: GlobalBy Milk Source Cheese Market Revenue, 2023-2030 ($)
Figure 14: GlobalBy Distribution Channel Cheese Market Revenue, 2023-2030 ($)
Figure 15: Global Cheese Market - By Geography
Figure 16: Global Cheese Market Value & Volume, By Geography, 2023-2030 ($)
Figure 17: Global Cheese Market CAGR, By Geography, 2023-2030 (%)
Figure 18: North America Cheese Market Value & Volume, 2023-2030 ($)
Figure 19: US Cheese Market Value & Volume, 2023-2030 ($)
Figure 20: US GDP and Population, 2023-2024 ($)
Figure 21: US GDP – Composition of 2023, By Sector of Origin
Figure 22: US Export and Import Value & Volume, 2023-2024 ($)
Figure 23: Canada Cheese Market Value & Volume, 2023-2030 ($)
Figure 24: Canada GDP and Population, 2023-2024 ($)
Figure 25: Canada GDP – Composition of 2023, By Sector of Origin
Figure 26: Canada Export and Import Value & Volume, 2023-2024 ($)
Figure 27: Mexico Cheese Market Value & Volume, 2023-2030 ($)
Figure 28: Mexico GDP and Population, 2023-2024 ($)
Figure 29: Mexico GDP – Composition of 2023, By Sector of Origin
Figure 30: Mexico Export and Import Value & Volume, 2023-2024 ($)
Figure 31: South America Cheese Market Value & Volume, 2023-2030 ($)
Figure 32: Brazil Cheese Market Value & Volume, 2023-2030 ($)
Figure 33: Brazil GDP and Population, 2023-2024 ($)
Figure 34: Brazil GDP – Composition of 2023, By Sector of Origin
Figure 35: Brazil Export and Import Value & Volume, 2023-2024 ($)
Figure 36: Venezuela Cheese Market Value & Volume, 2023-2030 ($)
Figure 37: Venezuela GDP and Population, 2023-2024 ($)
Figure 38: Venezuela GDP – Composition of 2023, By Sector of Origin
Figure 39: Venezuela Export and Import Value & Volume, 2023-2024 ($)
Figure 40: Argentina Cheese Market Value & Volume, 2023-2030 ($)
Figure 41: Argentina GDP and Population, 2023-2024 ($)
Figure 42: Argentina GDP – Composition of 2023, By Sector of Origin
Figure 43: Argentina Export and Import Value & Volume, 2023-2024 ($)
Figure 44: Ecuador Cheese Market Value & Volume, 2023-2030 ($)
Figure 45: Ecuador GDP and Population, 2023-2024 ($)
Figure 46: Ecuador GDP – Composition of 2023, By Sector of Origin
Figure 47: Ecuador Export and Import Value & Volume, 2023-2024 ($)
Figure 48: Peru Cheese Market Value & Volume, 2023-2030 ($)
Figure 49: Peru GDP and Population, 2023-2024 ($)
Figure 50: Peru GDP – Composition of 2023, By Sector of Origin
Figure 51: Peru Export and Import Value & Volume, 2023-2024 ($)
Figure 52: Colombia Cheese Market Value & Volume, 2023-2030 ($)
Figure 53: Colombia GDP and Population, 2023-2024 ($)
Figure 54: Colombia GDP – Composition of 2023, By Sector of Origin
Figure 55: Colombia Export and Import Value & Volume, 2023-2024 ($)
Figure 56: Costa Rica Cheese Market Value & Volume, 2023-2030 ($)
Figure 57: Costa Rica GDP and Population, 2023-2024 ($)
Figure 58: Costa Rica GDP – Composition of 2023, By Sector of Origin
Figure 59: Costa Rica Export and Import Value & Volume, 2023-2024 ($)
Figure 60: Europe Cheese Market Value & Volume, 2023-2030 ($)
Figure 61: U.K Cheese Market Value & Volume, 2023-2030 ($)
Figure 62: U.K GDP and Population, 2023-2024 ($)
Figure 63: U.K GDP – Composition of 2023, By Sector of Origin
Figure 64: U.K Export and Import Value & Volume, 2023-2024 ($)
Figure 65: Germany Cheese Market Value & Volume, 2023-2030 ($)
Figure 66: Germany GDP and Population, 2023-2024 ($)
Figure 67: Germany GDP – Composition of 2023, By Sector of Origin
Figure 68: Germany Export and Import Value & Volume, 2023-2024 ($)
Figure 69: Italy Cheese Market Value & Volume, 2023-2030 ($)
Figure 70: Italy GDP and Population, 2023-2024 ($)
Figure 71: Italy GDP – Composition of 2023, By Sector of Origin
Figure 72: Italy Export and Import Value & Volume, 2023-2024 ($)
Figure 73: France Cheese Market Value & Volume, 2023-2030 ($)
Figure 74: France GDP and Population, 2023-2024 ($)
Figure 75: France GDP – Composition of 2023, By Sector of Origin
Figure 76: France Export and Import Value & Volume, 2023-2024 ($)
Figure 77: Netherlands Cheese Market Value & Volume, 2023-2030 ($)
Figure 78: Netherlands GDP and Population, 2023-2024 ($)
Figure 79: Netherlands GDP – Composition of 2023, By Sector of Origin
Figure 80: Netherlands Export and Import Value & Volume, 2023-2024 ($)
Figure 81: Belgium Cheese Market Value & Volume, 2023-2030 ($)
Figure 82: Belgium GDP and Population, 2023-2024 ($)
Figure 83: Belgium GDP – Composition of 2023, By Sector of Origin
Figure 84: Belgium Export and Import Value & Volume, 2023-2024 ($)
Figure 85: Spain Cheese Market Value & Volume, 2023-2030 ($)
Figure 86: Spain GDP and Population, 2023-2024 ($)
Figure 87: Spain GDP – Composition of 2023, By Sector of Origin
Figure 88: Spain Export and Import Value & Volume, 2023-2024 ($)
Figure 89: Denmark Cheese Market Value & Volume, 2023-2030 ($)
Figure 90: Denmark GDP and Population, 2023-2024 ($)
Figure 91: Denmark GDP – Composition of 2023, By Sector of Origin
Figure 92: Denmark Export and Import Value & Volume, 2023-2024 ($)
Figure 93: APAC Cheese Market Value & Volume, 2023-2030 ($)
Figure 94: China Cheese Market Value & Volume, 2023-2030
Figure 95: China GDP and Population, 2023-2024 ($)
Figure 96: China GDP – Composition of 2023, By Sector of Origin
Figure 97: China Export and Import Value & Volume, 2023-2024 ($) Cheese Market China Export and Import Value & Volume, 2023-2024 ($)
Figure 98: Australia Cheese Market Value & Volume, 2023-2030 ($)
Figure 99: Australia GDP and Population, 2023-2024 ($)
Figure 100: Australia GDP – Composition of 2023, By Sector of Origin
Figure 101: Australia Export and Import Value & Volume, 2023-2024 ($)
Figure 102: South Korea Cheese Market Value & Volume, 2023-2030 ($)
Figure 103: South Korea GDP and Population, 2023-2024 ($)
Figure 104: South Korea GDP – Composition of 2023, By Sector of Origin
Figure 105: South Korea Export and Import Value & Volume, 2023-2024 ($)
Figure 106: India Cheese Market Value & Volume, 2023-2030 ($)
Figure 107: India GDP and Population, 2023-2024 ($)
Figure 108: India GDP – Composition of 2023, By Sector of Origin
Figure 109: India Export and Import Value & Volume, 2023-2024 ($)
Figure 110: Taiwan Cheese Market Value & Volume, 2023-2030 ($)
Figure 111: Taiwan GDP and Population, 2023-2024 ($)
Figure 112: Taiwan GDP – Composition of 2023, By Sector of Origin
Figure 113: Taiwan Export and Import Value & Volume, 2023-2024 ($)
Figure 114: Malaysia Cheese Market Value & Volume, 2023-2030 ($)
Figure 115: Malaysia GDP and Population, 2023-2024 ($)
Figure 116: Malaysia GDP – Composition of 2023, By Sector of Origin
Figure 117: Malaysia Export and Import Value & Volume, 2023-2024 ($)
Figure 118: Hong Kong Cheese Market Value & Volume, 2023-2030 ($)
Figure 119: Hong Kong GDP and Population, 2023-2024 ($)
Figure 120: Hong Kong GDP – Composition of 2023, By Sector of Origin
Figure 121: Hong Kong Export and Import Value & Volume, 2023-2024 ($)
Figure 122: Middle East & Africa Cheese Market Middle East & Africa 3D Printing Market Value & Volume, 2023-2030 ($)
Figure 123: Russia Cheese Market Value & Volume, 2023-2030 ($)
Figure 124: Russia GDP and Population, 2023-2024 ($)
Figure 125: Russia GDP – Composition of 2023, By Sector of Origin
Figure 126: Russia Export and Import Value & Volume, 2023-2024 ($)
Figure 127: Israel Cheese Market Value & Volume, 2023-2030 ($)
Figure 128: Israel GDP and Population, 2023-2024 ($)
Figure 129: Israel GDP – Composition of 2023, By Sector of Origin
Figure 130: Israel Export and Import Value & Volume, 2023-2024 ($)
Figure 131: Entropy Share, By Strategies, 2023-2024* (%) Cheese Market
Figure 132: Developments, 2023-2024* Cheese Market
Figure 133: Company 1 Cheese Market Net Revenue, By Years, 2023-2024* ($)
Figure 134: Company 1 Cheese Market Net Revenue Share, By Business segments, 2023 (%)
Figure 135: Company 1 Cheese Market Net Sales Share, By Geography, 2023 (%)
Figure 136: Company 2 Cheese Market Net Revenue, By Years, 2023-2024* ($)
Figure 137: Company 2 Cheese Market Net Revenue Share, By Business segments, 2023 (%)
Figure 138: Company 2 Cheese Market Net Sales Share, By Geography, 2023 (%)
Figure 139: Company 3 Cheese Market Net Revenue, By Years, 2023-2024* ($)
Figure 140: Company 3 Cheese Market Net Revenue Share, By Business segments, 2023 (%)
Figure 141: Company 3 Cheese Market Net Sales Share, By Geography, 2023 (%)
Figure 142: Company 4 Cheese Market Net Revenue, By Years, 2023-2024* ($)
Figure 143: Company 4 Cheese Market Net Revenue Share, By Business segments, 2023 (%)
Figure 144: Company 4 Cheese Market Net Sales Share, By Geography, 2023 (%)
Figure 145: Company 5 Cheese Market Net Revenue, By Years, 2023-2024* ($)
Figure 146: Company 5 Cheese Market Net Revenue Share, By Business segments, 2023 (%)
Figure 147: Company 5 Cheese Market Net Sales Share, By Geography, 2023 (%)
Figure 148: Company 6 Cheese Market Net Revenue, By Years, 2023-2024* ($)
Figure 149: Company 6 Cheese Market Net Revenue Share, By Business segments, 2023 (%)
Figure 150: Company 6 Cheese Market Net Sales Share, By Geography, 2023 (%)
Figure 151: Company 7 Cheese Market Net Revenue, By Years, 2023-2024* ($)
Figure 152: Company 7 Cheese Market Net Revenue Share, By Business segments, 2023 (%)
Figure 153: Company 7 Cheese Market Net Sales Share, By Geography, 2023 (%)
Figure 154: Company 8 Cheese Market Net Revenue, By Years, 2023-2024* ($)
Figure 155: Company 8 Cheese Market Net Revenue Share, By Business segments, 2023 (%)
Figure 156: Company 8 Cheese Market Net Sales Share, By Geography, 2023 (%)
Figure 157: Company 9 Cheese Market Net Revenue, By Years, 2023-2024* ($)
Figure 158: Company 9 Cheese Market Net Revenue Share, By Business segments, 2023 (%)
Figure 159: Company 9 Cheese Market Net Sales Share, By Geography, 2023 (%)
Figure 160: Company 10 Cheese Market Net Revenue, By Years, 2023-2024* ($)
Figure 161: Company 10 Cheese Market Net Revenue Share, By Business segments, 2023 (%)
Figure 162: Company 10 Cheese Market Net Sales Share, By Geography, 2023 (%)
Figure 163: Company 11 Cheese Market Net Revenue, By Years, 2023-2024* ($)
Figure 164: Company 11 Cheese Market Net Revenue Share, By Business segments, 2023 (%)
Figure 165: Company 11 Cheese Market Net Sales Share, By Geography, 2023 (%)
Figure 166: Company 12 Cheese Market Net Revenue, By Years, 2023-2024* ($)
Figure 167: Company 12 Cheese Market Net Revenue Share, By Business segments, 2023 (%)
Figure 168: Company 12 Cheese Market Net Sales Share, By Geography, 2023 (%)
Figure 169: Company 13 Cheese Market Net Revenue, By Years, 2023-2024* ($)
Figure 170: Company 13 Cheese Market Net Revenue Share, By Business segments, 2023 (%)
Figure 171: Company 13 Cheese Market Net Sales Share, By Geography, 2023 (%)
Figure 172: Company 14 Cheese Market Net Revenue, By Years, 2023-2024* ($)
Figure 173: Company 14 Cheese Market Net Revenue Share, By Business segments, 2023 (%)
Figure 174: Company 14 Cheese Market Net Sales Share, By Geography, 2023 (%)
Figure 175: Company 15 Cheese Market Net Revenue, By Years, 2023-2024* ($)
Figure 176: Company 15 Cheese Market Net Revenue Share, By Business segments, 2023 (%)
Figure 177: Company 15 Cheese Market Net Sales Share, By Geography, 2023 (%)