 Email
Email Print
Print


Machine To Machine Communication Market- By Technology,By End Users,By Application,By Geography - Global Opportunity Analysis & Industry Forecast, 2024 - 2030
Machine To Machine Communication Market Overview
Machine To Machine Communication Market Size is forecast to reach $43073 Million by 2030, at a CAGR of 6.90% during forecast period 2024-2030.Supportive government policies, increasing demand for connectivity along with growing concern for safety is driving the M2M communication market. The smart home market, automotive industry, healthcare, manufacturing & supply chain verticals will fuel their growth by innovating more technologies in M2M communications. Moreover, the increasing M2M connections in various industries and the growing adoption of new connectivity technologies will further accelerate machine-to-machine (M2M) connections market growth in the forecast period 2024-2030. Moreover, the substantial penetration of cellular services globally and increasing adoption of 4G, and emerging 5G cellular technology is further driving the growth of the wireless connectivity technology in the machine-to-machine (M2M) connections market. Hence these benefits are analysed to drive the market in the forecast period 2024-2030.
Report Coverage
The report: “Machine To Machine Communication Market – Forecast (2024-2030)”, by IndustryARC covers an in-depth analysis of the following segments of the Machine To Machine Communication market
By Technology: Wired Technologies (Ethernet, Industrial, Industrial Ethernet, Modbus, Profinet, Foundation Fieldbus), Wireless Technologies (Short Range, Wi-Fi, Zigbee, Bluetooth, Cellular Network, Second Generation (2G), Third Generation (3G), Fourth Generation (4G)/Long-Term Evolution (LTE)
By Devices: Wi-Fi, Sensors, Software
By End Users: Manufacturing, Healthcare, Security & Surveillance, Automotive & Transportation/ Logistics, Oil & Gas, Consumer Electronics, Warehouse Management, Agriculture, Others
By Application: Patient Monitoring Systems, Fall Detector, Smart Pill Dispenser, Telemedicine, Smart Grids, Smart Meters, Telematics, Fleet Tracking/Monitoring, Intelligent Vending Machines, Contactless Checkout/Pos, Digital Signage, Smart Appliances, Others
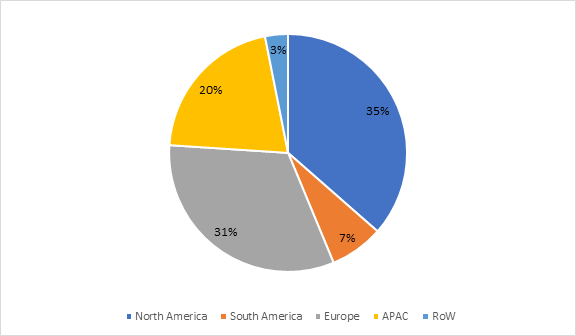
By Geography: North America (U.S, Canada, Mexico), South America(Brazil, Argentina and others), Europe(Germany, UK, France, Italy, Spain, Russia and Others), APAC(China, Japan India, SK, Aus and Others), and RoW (Middle east and Africa)
Key Takeaways
- North America dominated the market by a market share of more than 34.9% in 2020, early adoption of advanced technologies and presence of developed regions such as U.S and Canada is analysed to drive the market.
- M2M technology allows manufacturing machines to communicate with each other for exchanging and gathering information such as machining process conditions and thus to enhance productivity and efficiency.
- The growing adoption of short-range wireless connectivity technologies such as Wi-Fi, Bluetooth, and ZigBee for multiple applications such as in-car infotainment systems, patient monitoring devices, wireless beacons, and smart appliances is driving the growth of the market for the wireless technology segment.
- Machine To Machine Communication top 10 companies include AT&T Inc., Cisco Systems Inc., Huawei Technologies Co., Ltd., NXP Semiconductors N.V., Texas Instruments Incorporated, Intel Corporation, Gemalto N.V., Vodafone Group PLC, Murata Manufacturing Co., Ltd., U-Blox Holding AG, Fanstel Corporation among others.
Machine To Machine Communication Market Segment Analysis - By Technology
Wireless technology is growing at a highest CAGR of 9.6% in the forecast period 2024-2030. The growing adoption of short-range wireless connectivity technologies such as Wi-Fi, Bluetooth, and ZigBee for multiple applications such as in-car infotainment systems, patient monitoring devices, wireless beacons, and smart appliances is driving the growth of the market for the wireless technology segment.
Machine To Machine Communication Market Segment Analysis - By Industry Vertical
Manufacturing sector in Machine To Machine Communication is growing at a CAGR of 9.9% in the forecast period. M2M technology allows manufacturing machines to communicate with each other for exchanging and gathering information such as machining process conditions and thus enhancing productivity and efficiency. Machine-to-machine technology is in high demand among manufacturers because of its real-time communication abilities and the way it allows them to remotely track their supply chains and monitor warehouse operations from any location. Increasingly global supply chains have made these features invaluable to manufacturers. Many manufacturing companies have been investing heavily in deploying this technology. Industries such as ABB, Siemens, Honeywell and so on have invested heavily in this technology. Hence these advancements are analyzed to drive the market in the forecast period 2024-2030.
Machine To Machine Communication Market Segment Analysis - By Geography
North America dominated the market by a market share of more than 34.9% in 2020, early adoption of advanced technologies and presence of developed regions such as U.S and Canada are analysed to drive the market. In addition, it is the most advanced region and it has highest number of smart homes solutions with 4.5 million systems installed as of 2019. The usage and applications of M2M in the smart home space is rising owing to its wide applications. Moreover, U.S. is leading the market in North America as the rising demand of cloud based services and high-speed networks enable easy access, analysis and manipulation of stored data transaction to help customers improve their business operations. Hence these advancements are analyzed to drive the market in the forecast period 2021-2026.
Machine To Machine Communication Market Drivers
M2M in supply chain management
M2M technology plays a vital role in the improvement of supply chain processes. This Communication allows enterprises to improve their existing supply chain processes by enabling the remote monitoring of vehicles. In addition, it also enables the provision of real-time updates about cargo shipments, reduces the cost to the company, and enhances data security. In supply chains, M2M technology increases visibility and allows for significant reduction in uncertainties in supply chain. Similarly, in a warehouse, M2M devices can be deployed to track the inventory so that stockholders and enterprises can respond to the market dynamics and to decide when to refill and when to go on sale.
Increased penetration of IoT and Communication technologies.
The growing popularity of Internet of Things (IoT) is poised to drive the growth of the M2M communication market. The increasing number of connected devices is projected to provide impetus to market growth in the forecast period. Also, the developments in network technology are anticipated to influence the market growth pattern positively. In addition, increased penetration of 4G services and commercialization of 5G services is poised to have a huge impact on the expansion of the M2M communication market in the upcoming years. Moreover, developments in wireless technology are also prognosticated to project an accelerated growth rate of the market in the forecast period 2024-2030.
Machine To Machine Communication Market Challenges
Rising Security Issues
Although Machine To Machine communications is growing at a rapid phase. Rising security concerns in devices are analyzed to hamper the market growth. In addition while constructing an efficient global digital world combining personal/private data, these security and privacy issues are even higher. Hence these security issues are analyze to hamper the market growth in the forecast period 2021-2026.
Machine To Machine Communication Market Landscape
Technology launches, acquisitions, Partnerships and R&D activities are key strategies adopted by players in the LATAM LMS-Frontline worker training market. In 2020, the market of Machine To Machine Communication industry outlook has been fragmented by several companies. Machine To Machine Communication top 10 companies include AT&T Inc., Cisco Systems Inc., Huawei Technologies Co., Ltd., NXP Semiconductors N.V., Texas Instruments Incorporated, Intel Corporation, Gemalto N.V., Vodafone Group PLC, Murata Manufacturing Co., Ltd., U-Blox Holding AG, Fanstel Corporation among others.
Acquisitions/Technology Launches
- In July 2021, Abracon, LLC, an industry leader in passive components, today announced the successful acquisitions of Proant AB and Proant Asia Limited, privately held antenna suppliers headquartered in Umeå, Sweden and Hong Kong, respectively. Abracon will integrate Proant's antenna product portfolio ranging from 150 MHz up to 8 GHz with a focus on wireless M2M and IoT applications.
Key Market Players:
The Top 5 companies in the Retail Machine To Machine Communication Market are:
- Cisco Systems, Inc.
- AT&T Inc.
- Qualcomm Incorporated
- Intel Corporation
- Vodafone Group Plc
For more Information and Communications Technology related reports, please click here
List of Tables
Table 1 Machine To Machine communication Market Overview 2023-2030
Table 2 Machine To Machine communication Market Leader Analysis 2023-2024 (US$)
Table 3 Machine To Machine communication MarketProduct Analysis 2023-2024 (US$)
Table 4 Machine To Machine communication MarketEnd User Analysis 2023-2024 (US$)
Table 5 Machine To Machine communication MarketPatent Analysis 2021-2023* (US$)
Table 6 Machine To Machine communication MarketFinancial Analysis 2023-2024 (US$)
Table 7 Machine To Machine communication Market Driver Analysis 2023-2024 (US$)
Table 8 Machine To Machine communication MarketChallenges Analysis 2023-2024 (US$)
Table 9 Machine To Machine communication MarketConstraint Analysis 2023-2024 (US$)
Table 10 Machine To Machine communication Market Supplier Bargaining Power Analysis 2023-2024 (US$)
Table 11 Machine To Machine communication Market Buyer Bargaining Power Analysis 2023-2024 (US$)
Table 12 Machine To Machine communication Market Threat of Substitutes Analysis 2023-2024 (US$)
Table 13 Machine To Machine communication Market Threat of New Entrants Analysis 2023-2024 (US$)
Table 14 Machine To Machine communication Market Degree of Competition Analysis 2023-2024 (US$)
Table 15 Machine To Machine communication MarketValue Chain Analysis 2023-2024 (US$)
Table 16 Machine To Machine communication MarketPricing Analysis 2023-2030 (US$)
Table 17 Machine To Machine communication MarketOpportunities Analysis 2023-2030 (US$)
Table 18 Machine To Machine communication MarketProduct Life Cycle Analysis 2023-2030 (US$)
Table 19 Machine To Machine communication MarketSupplier Analysis 2023-2024 (US$)
Table 20 Machine To Machine communication MarketDistributor Analysis 2023-2024 (US$)
Table 21 Machine To Machine communication Market Trend Analysis 2023-2024 (US$)
Table 22 Machine To Machine communication Market Size 2023 (US$)
Table 23 Machine To Machine communication Market Forecast Analysis 2023-2030 (US$)
Table 24 Machine To Machine communication Market Sales Forecast Analysis 2023-2030 (Units)
Table 25 Machine To Machine communication Market, Revenue & Volume,By Technology, 2023-2030 ($)
Table 26 Machine To Machine communication MarketBy Technology, Revenue & Volume,By Wired Technology, 2023-2030 ($)
Table 27 Machine To Machine communication MarketBy Technology, Revenue & Volume,By Wireless Technology, 2023-2030 ($)
Table 28 Machine To Machine communication MarketBy Technology, Revenue & Volume,By Cellular, 2023-2030 ($)
Table 29 Machine To Machine communication MarketBy Technology, Revenue & Volume,By Satellite, 2023-2030 ($)
Table 30 Machine To Machine communication Market, Revenue & Volume,By End User Industry, 2023-2030 ($)
Table 31 Machine To Machine communication MarketBy End User Industry, Revenue & Volume,By Manufacturing, 2023-2030 ($)
Table 32 Machine To Machine communication MarketBy End User Industry, Revenue & Volume,By Healthcare, 2023-2030 ($)
Table 33 Machine To Machine communication MarketBy End User Industry, Revenue & Volume,By Security & Surveillance, 2023-2030 ($)
Table 34 Machine To Machine communication MarketBy End User Industry, Revenue & Volume,By Automotive & Transportation/ Logistics, 2023-2030 ($)
Table 35 Machine To Machine communication MarketBy End User Industry, Revenue & Volume,By Oil & Gas, 2023-2030 ($)
Table 36 North America Machine To Machine communication Market, Revenue & Volume,By Technology, 2023-2030 ($)
Table 37 North America Machine To Machine communication Market, Revenue & Volume,By End User Industry, 2023-2030 ($)
Table 38 South america Machine To Machine communication Market, Revenue & Volume,By Technology, 2023-2030 ($)
Table 39 South america Machine To Machine communication Market, Revenue & Volume,By End User Industry, 2023-2030 ($)
Table 40 Europe Machine To Machine communication Market, Revenue & Volume,By Technology, 2023-2030 ($)
Table 41 Europe Machine To Machine communication Market, Revenue & Volume,By End User Industry, 2023-2030 ($)
Table 42 APAC Machine To Machine communication Market, Revenue & Volume,By Technology, 2023-2030 ($)
Table 43 APAC Machine To Machine communication Market, Revenue & Volume,By End User Industry, 2023-2030 ($)
Table 44 Middle East & Africa Machine To Machine communication Market, Revenue & Volume,By Technology, 2023-2030 ($)
Table 45 Middle East & Africa Machine To Machine communication Market, Revenue & Volume,By End User Industry, 2023-2030 ($)
Table 46 Russia Machine To Machine communication Market, Revenue & Volume,By Technology, 2023-2030 ($)
Table 47 Russia Machine To Machine communication Market, Revenue & Volume,By End User Industry, 2023-2030 ($)
Table 48 Israel Machine To Machine communication Market, Revenue & Volume,By Technology, 2023-2030 ($)
Table 49 Israel Machine To Machine communication Market, Revenue & Volume,By End User Industry, 2023-2030 ($)
Table 50 Top Companies 2023 (US$)Machine To Machine communication Market, Revenue & Volume,,
Table 51 Product Launch 2023-2024Machine To Machine communication Market, Revenue & Volume,,
Table 52 Mergers & Acquistions 2023-2024Machine To Machine communication Market, Revenue & Volume,,
List of Figures
Figure 1 Overview of Machine To Machine communication Market 2023-2030
Figure 2 Market Share Analysis for Machine To Machine communication Market 2023 (US$)
Figure 3 Product Comparison in Machine To Machine communication Market 2023-2024 (US$)
Figure 4 End User Profile for Machine To Machine communication Market 2023-2024 (US$)
Figure 5 Patent Application and Grant in Machine To Machine communication Market 2021-2023* (US$)
Figure 6 Top 5 Companies Financial Analysis in Machine To Machine communication Market 2023-2024 (US$)
Figure 7 Market Entry Strategy in Machine To Machine communication Market 2023-2024
Figure 8 Ecosystem Analysis in Machine To Machine communication Market2023
Figure 9 Average Selling Price in Machine To Machine communication Market 2023-2030
Figure 10 Top Opportunites in Machine To Machine communication Market 2023-2024
Figure 11 Market Life Cycle Analysis in Machine To Machine communication Market
Figure 12 GlobalBy TechnologyMachine To Machine communication Market Revenue, 2023-2030 ($)
Figure 13 GlobalBy End User IndustryMachine To Machine communication Market Revenue, 2023-2030 ($)
Figure 14 Global Machine To Machine communication Market - By Geography
Figure 15 Global Machine To Machine communication Market Value & Volume, By Geography, 2023-2030 ($)
Figure 16 Global Machine To Machine communication Market CAGR, By Geography, 2023-2030 (%)
Figure 17 North America Machine To Machine communication Market Value & Volume, 2023-2030 ($)
Figure 18 US Machine To Machine communication Market Value & Volume, 2023-2030 ($)
Figure 19 US GDP and Population, 2023-2024 ($)
Figure 20 US GDP – Composition of 2023, By Sector of Origin
Figure 21 US Export and Import Value & Volume, 2023-2024 ($)
Figure 22 Canada Machine To Machine communication Market Value & Volume, 2023-2030 ($)
Figure 23 Canada GDP and Population, 2023-2024 ($)
Figure 24 Canada GDP – Composition of 2023, By Sector of Origin
Figure 25 Canada Export and Import Value & Volume, 2023-2024 ($)
Figure 26 Mexico Machine To Machine communication Market Value & Volume, 2023-2030 ($)
Figure 27 Mexico GDP and Population, 2023-2024 ($)
Figure 28 Mexico GDP – Composition of 2023, By Sector of Origin
Figure 29 Mexico Export and Import Value & Volume, 2023-2024 ($)
Figure 30 South America Machine To Machine communication MarketSouth America 3D Printing Market Value & Volume, 2023-2030 ($)
Figure 31 Brazil Machine To Machine communication Market Value & Volume, 2023-2030 ($)
Figure 32 Brazil GDP and Population, 2023-2024 ($)
Figure 33 Brazil GDP – Composition of 2023, By Sector of Origin
Figure 34 Brazil Export and Import Value & Volume, 2023-2024 ($)
Figure 35 Venezuela Machine To Machine communication Market Value & Volume, 2023-2030 ($)
Figure 36 Venezuela GDP and Population, 2023-2024 ($)
Figure 37 Venezuela GDP – Composition of 2023, By Sector of Origin
Figure 38 Venezuela Export and Import Value & Volume, 2023-2024 ($)
Figure 39 Argentina Machine To Machine communication Market Value & Volume, 2023-2030 ($)
Figure 40 Argentina GDP and Population, 2023-2024 ($)
Figure 41 Argentina GDP – Composition of 2023, By Sector of Origin
Figure 42 Argentina Export and Import Value & Volume, 2023-2024 ($)
Figure 43 Ecuador Machine To Machine communication Market Value & Volume, 2023-2030 ($)
Figure 44 Ecuador GDP and Population, 2023-2024 ($)
Figure 45 Ecuador GDP – Composition of 2023, By Sector of Origin
Figure 46 Ecuador Export and Import Value & Volume, 2023-2024 ($)
Figure 47 Peru Machine To Machine communication Market Value & Volume, 2023-2030 ($)
Figure 48 Peru GDP and Population, 2023-2024 ($)
Figure 49 Peru GDP – Composition of 2023, By Sector of Origin
Figure 50 Peru Export and Import Value & Volume, 2023-2024 ($)
Figure 51 Colombia Machine To Machine communication Market Value & Volume, 2023-2030 ($)
Figure 52 Colombia GDP and Population, 2023-2024 ($)
Figure 53 Colombia GDP – Composition of 2023, By Sector of Origin
Figure 54 Colombia Export and Import Value & Volume, 2023-2024 ($)
Figure 55 Costa Rica Machine To Machine communication MarketCosta Rica 3D Printing Market Value & Volume, 2023-2030 ($)
Figure 56 Costa Rica GDP and Population, 2023-2024 ($)
Figure 57 Costa Rica GDP – Composition of 2023, By Sector of Origin
Figure 58 Costa Rica Export and Import Value & Volume, 2023-2024 ($)
Figure 59 Europe Machine To Machine communication Market Value & Volume, 2023-2030 ($)
Figure 60 U.K Machine To Machine communication Market Value & Volume, 2023-2030 ($)
Figure 61 U.K GDP and Population, 2023-2024 ($)
Figure 62 U.K GDP – Composition of 2023, By Sector of Origin
Figure 63 U.K Export and Import Value & Volume, 2023-2024 ($)
Figure 64 Germany Machine To Machine communication Market Value & Volume, 2023-2030 ($)
Figure 65 Germany GDP and Population, 2023-2024 ($)
Figure 66 Germany GDP – Composition of 2023, By Sector of Origin
Figure 67 Germany Export and Import Value & Volume, 2023-2024 ($)
Figure 68 Italy Machine To Machine communication Market Value & Volume, 2023-2030 ($)
Figure 69 Italy GDP and Population, 2023-2024 ($)
Figure 70 Italy GDP – Composition of 2023, By Sector of Origin
Figure 71 Italy Export and Import Value & Volume, 2023-2024 ($)
Figure 72 France Machine To Machine communication Market Value & Volume, 2023-2030 ($)
Figure 73 France GDP and Population, 2023-2024 ($)
Figure 74 France GDP – Composition of 2023, By Sector of Origin
Figure 75 France Export and Import Value & Volume, 2023-2024 ($)
Figure 76 Netherlands Machine To Machine communication Market Value & Volume, 2023-2030 ($)
Figure 77 Netherlands GDP and Population, 2023-2024 ($)
Figure 78 Netherlands GDP – Composition of 2023, By Sector of Origin
Figure 79 Netherlands Export and Import Value & Volume, 2023-2024 ($)
Figure 80 Belgium Machine To Machine communication Market Value & Volume, 2023-2030 ($)
Figure 81 Belgium GDP and Population, 2023-2024 ($)
Figure 82 Belgium GDP – Composition of 2023, By Sector of Origin
Figure 83 Belgium Export and Import Value & Volume, 2023-2024 ($)
Figure 84 Spain Machine To Machine communication Market Value & Volume, 2023-2030 ($)
Figure 85 Spain GDP and Population, 2023-2024 ($)
Figure 86 Spain GDP – Composition of 2023, By Sector of Origin
Figure 87 Spain Export and Import Value & Volume, 2023-2024 ($)
Figure 88 Denmark Machine To Machine communication Market Value & Volume, 2023-2030 ($)
Figure 89 Denmark GDP and Population, 2023-2024 ($)
Figure 90 Denmark GDP – Composition of 2023, By Sector of Origin
Figure 91 Denmark Export and Import Value & Volume, 2023-2024 ($)
Figure 92 APAC Machine To Machine communication Market Value & Volume, 2023-2030 ($)
Figure 93 China Machine To Machine communication MarketValue & Volume, 2023-2030
Figure 94 China GDP and Population, 2023-2024 ($)
Figure 95 China GDP – Composition of 2023, By Sector of Origin
Figure 96 China Export and Import Value & Volume, 2023-2024 ($)Machine To Machine communication MarketChina Export and Import Value & Volume, 2023-2024 ($)
Figure 97 Australia Machine To Machine communication Market Value & Volume, 2023-2030 ($)
Figure 98 Australia GDP and Population, 2023-2024 ($)
Figure 99 Australia GDP – Composition of 2023, By Sector of Origin
Figure 100 Australia Export and Import Value & Volume, 2023-2024 ($)
Figure 101 South Korea Machine To Machine communication Market Value & Volume, 2023-2030 ($)
Figure 102 South Korea GDP and Population, 2023-2024 ($)
Figure 103 South Korea GDP – Composition of 2023, By Sector of Origin
Figure 104 South Korea Export and Import Value & Volume, 2023-2024 ($)
Figure 105 India Machine To Machine communication Market Value & Volume, 2023-2030 ($)
Figure 106 India GDP and Population, 2023-2024 ($)
Figure 107 India GDP – Composition of 2023, By Sector of Origin
Figure 108 India Export and Import Value & Volume, 2023-2024 ($)
Figure 109 Taiwan Machine To Machine communication MarketTaiwan 3D Printing Market Value & Volume, 2023-2030 ($)
Figure 110 Taiwan GDP and Population, 2023-2024 ($)
Figure 111 Taiwan GDP – Composition of 2023, By Sector of Origin
Figure 112 Taiwan Export and Import Value & Volume, 2023-2024 ($)
Figure 113 Malaysia Machine To Machine communication MarketMalaysia 3D Printing Market Value & Volume, 2023-2030 ($)
Figure 114 Malaysia GDP and Population, 2023-2024 ($)
Figure 115 Malaysia GDP – Composition of 2023, By Sector of Origin
Figure 116 Malaysia Export and Import Value & Volume, 2023-2024 ($)
Figure 117 Hong Kong Machine To Machine communication MarketHong Kong 3D Printing Market Value & Volume, 2023-2030 ($)
Figure 118 Hong Kong GDP and Population, 2023-2024 ($)
Figure 119 Hong Kong GDP – Composition of 2023, By Sector of Origin
Figure 120 Hong Kong Export and Import Value & Volume, 2023-2024 ($)
Figure 121 Middle East & Africa Machine To Machine communication MarketMiddle East & Africa 3D Printing Market Value & Volume, 2023-2030 ($)
Figure 122 Russia Machine To Machine communication MarketRussia 3D Printing Market Value & Volume, 2023-2030 ($)
Figure 123 Russia GDP and Population, 2023-2024 ($)
Figure 124 Russia GDP – Composition of 2023, By Sector of Origin
Figure 125 Russia Export and Import Value & Volume, 2023-2024 ($)
Figure 126 Israel Machine To Machine communication Market Value & Volume, 2023-2030 ($)
Figure 127 Israel GDP and Population, 2023-2024 ($)
Figure 128 Israel GDP – Composition of 2023, By Sector of Origin
Figure 129 Israel Export and Import Value & Volume, 2023-2024 ($)
Figure 130 Entropy Share, By Strategies, 2023-2024* (%)Machine To Machine communication Market
Figure 131 Developments, 2023-2024*Machine To Machine communication Market
Figure 132 Company 1 Machine To Machine communication Market Net Revenue, By Years, 2023-2024* ($)
Figure 133 Company 1 Machine To Machine communication Market Net Revenue Share, By Business segments, 2023 (%)
Figure 134 Company 1 Machine To Machine communication Market Net Sales Share, By Geography, 2023 (%)
Figure 135 Company 2 Machine To Machine communication Market Net Revenue, By Years, 2023-2024* ($)
Figure 136 Company 2 Machine To Machine communication Market Net Revenue Share, By Business segments, 2023 (%)
Figure 137 Company 2 Machine To Machine communication Market Net Sales Share, By Geography, 2023 (%)
Figure 138 Company 3Machine To Machine communication Market Net Revenue, By Years, 2023-2024* ($)
Figure 139 Company 3Machine To Machine communication Market Net Revenue Share, By Business segments, 2023 (%)
Figure 140 Company 3Machine To Machine communication Market Net Sales Share, By Geography, 2023 (%)
Figure 141 Company 4 Machine To Machine communication Market Net Revenue, By Years, 2023-2024* ($)
Figure 142 Company 4 Machine To Machine communication Market Net Revenue Share, By Business segments, 2023 (%)
Figure 143 Company 4 Machine To Machine communication Market Net Sales Share, By Geography, 2023 (%)
Figure 144 Company 5 Machine To Machine communication Market Net Revenue, By Years, 2023-2024* ($)
Figure 145 Company 5 Machine To Machine communication Market Net Revenue Share, By Business segments, 2023 (%)
Figure 146 Company 5 Machine To Machine communication Market Net Sales Share, By Geography, 2023 (%)
Figure 147 Company 6 Machine To Machine communication Market Net Revenue, By Years, 2023-2024* ($)
Figure 148 Company 6 Machine To Machine communication Market Net Revenue Share, By Business segments, 2023 (%)
Figure 149 Company 6 Machine To Machine communication Market Net Sales Share, By Geography, 2023 (%)
Figure 150 Company 7 Machine To Machine communication Market Net Revenue, By Years, 2023-2024* ($)
Figure 151 Company 7 Machine To Machine communication Market Net Revenue Share, By Business segments, 2023 (%)
Figure 152 Company 7 Machine To Machine communication Market Net Sales Share, By Geography, 2023 (%)
Figure 153 Company 8 Machine To Machine communication Market Net Revenue, By Years, 2023-2024* ($)
Figure 154 Company 8 Machine To Machine communication Market Net Revenue Share, By Business segments, 2023 (%)
Figure 155 Company 8 Machine To Machine communication Market Net Sales Share, By Geography, 2023 (%)
Figure 156 Company 9 Machine To Machine communication Market Net Revenue, By Years, 2023-2024* ($)
Figure 157 Company 9 Machine To Machine communication Market Net Revenue Share, By Business segments, 2023 (%)
Figure 158 Company 9 Machine To Machine communication Market Net Sales Share, By Geography, 2023 (%)
Figure 159 Company 10 Machine To Machine communication Market Net Revenue, By Years, 2023-2024* ($)
Figure 160 Company 10 Machine To Machine communication Market Net Revenue Share, By Business segments, 2023 (%)
Figure 161 Company 10 Machine To Machine communication Market Net Sales Share, By Geography, 2023 (%)
Figure 162 Company 11 Machine To Machine communication Market Net Revenue, By Years, 2023-2024* ($)
Figure 163 Company 11 Machine To Machine communication Market Net Revenue Share, By Business segments, 2023 (%)
Figure 164 Company 11 Machine To Machine communication Market Net Sales Share, By Geography, 2023 (%)
Figure 165 Company 12 Machine To Machine communication Market Net Revenue, By Years, 2023-2024* ($)
Figure 166 Company 12 Machine To Machine communication Market Net Revenue Share, By Business segments, 2023 (%)
Figure 167 Company 12 Machine To Machine communication Market Net Sales Share, By Geography, 2023 (%)
Figure 168 Company 13Machine To Machine communication Market Net Revenue, By Years, 2023-2024* ($)
Figure 169 Company 13Machine To Machine communication Market Net Revenue Share, By Business segments, 2023 (%)
Figure 170 Company 13Machine To Machine communication Market Net Sales Share, By Geography, 2023 (%)
Figure 171 Company 14 Machine To Machine communication Market Net Revenue, By Years, 2023-2024* ($)
Figure 172 Company 14 Machine To Machine communication Market Net Revenue Share, By Business segments, 2023 (%)
Figure 173 Company 14 Machine To Machine communication Market Net Sales Share, By Geography, 2023 (%)
Figure 174 Company 15 Machine To Machine communication Market Net Revenue, By Years, 2023-2024* ($)
Figure 175 Company 15 Machine To Machine communication Market Net Revenue Share, By Business segments, 2023 (%)
Figure 176 Company 15 Machine To Machine communication Market Net Sales Share, By Geography, 2023 (%)