 Email
Email Print
Print


Crash Barrier Systems Market - Forecast(2025 - 2031)
Crash Barrier Systems are a strong protective barrier that is erected around a racetrack or in the middle of a dual-lane highway in order to reduce the likelihood of severe accidents.
All existing crash barriers have been designed to reduce the severity of a crash when cars and trucks leave the roadway. Little consideration has been given to the welfare of motorcyclists who collide with these barriers. In most cases the safest barrier for a motorcyclist is ‘no barrier’.
Wire rope barriers are very effective in reducing the severity of crashes when cars and trucks impact with them as they absorb energy. Rigid barriers are less effective as more of the energy of the impact is transmitted to the vehicle occupants resulting in greater injuries. This effect is known as ‘ride-down’ in barrier crash testing.
The rising demand of flexible barrier systems which require low cost of repair after crashes is triggering the growth of crash barrier market, globally. Wire rope barriers, are generally more forgiving than other types because most of the impact energy is dissipated by deflection of the barrier and lower impact forces are imposed on the vehicle and its occupants.
The global market for Crash barrier systems was estimated to be $XX billion in 2014. The global market for Crash barrier systems market is estimated to grow at a CAGR of XX% and is forecast to reach $XX billion by 2021. The Flexible Crash barrier systems are forecast to have the highest growth of XX% during the forecast period 2015-2020. Transportation and Construction sectors are the major end-users for Crash barrier systems. North America and Asia alone are estimated to occupy a share of more than XX% during 2016-2021.
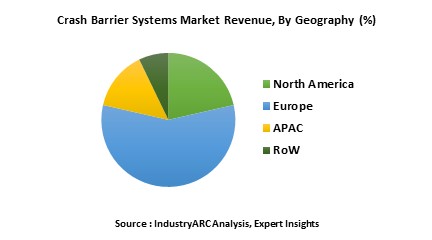
Europe is the largest market for crash barrier systems, owing to the increase in urbanization and industrialization in the region. It is followed by APAC, which is growing due to increase in automotive in the region and most countries are developing countries. Transportation and Construction is driving the market.
Asia is competing with Europe with japan and Australia taking charge, these countries are making laws to adopt the cash barriers along the highways and construction.
Asia is the leading market for Crash barrier systems Market with china leading the charge. Asia region is forecast to have highest growth in the next few years due to growing adoption of crash barrier systems in industrial applications. Asia Crash barrier systems market accounts to XX% of the global market for Crash barrier systems and is the fastest growing market followed by Americas.
All existing crash barriers have been designed to reduce the severity of a crash when cars and trucks leave the roadway. Little consideration has been given to the welfare of motorcyclists who collide with these barriers. In most cases the safest barrier for a motorcyclist is ‘no barrier’.
Wire rope barriers are very effective in reducing the severity of crashes when cars and trucks impact with them as they absorb energy. Rigid barriers are less effective as more of the energy of the impact is transmitted to the vehicle occupants resulting in greater injuries. This effect is known as ‘ride-down’ in barrier crash testing.
The rising demand of flexible barrier systems which require low cost of repair after crashes is triggering the growth of crash barrier market, globally. Wire rope barriers, are generally more forgiving than other types because most of the impact energy is dissipated by deflection of the barrier and lower impact forces are imposed on the vehicle and its occupants.
The global market for Crash barrier systems was estimated to be $XX billion in 2014. The global market for Crash barrier systems market is estimated to grow at a CAGR of XX% and is forecast to reach $XX billion by 2021. The Flexible Crash barrier systems are forecast to have the highest growth of XX% during the forecast period 2015-2020. Transportation and Construction sectors are the major end-users for Crash barrier systems. North America and Asia alone are estimated to occupy a share of more than XX% during 2016-2021.
Europe is the largest market for crash barrier systems, owing to the increase in urbanization and industrialization in the region. It is followed by APAC, which is growing due to increase in automotive in the region and most countries are developing countries. Transportation and Construction is driving the market.
Asia is competing with Europe with japan and Australia taking charge, these countries are making laws to adopt the cash barriers along the highways and construction.
Asia is the leading market for Crash barrier systems Market with china leading the charge. Asia region is forecast to have highest growth in the next few years due to growing adoption of crash barrier systems in industrial applications. Asia Crash barrier systems market accounts to XX% of the global market for Crash barrier systems and is the fastest growing market followed by Americas.
1. Market Overview
2. Executive Summary
3. Crash Barrier Systems Market Landscape
3.1. Market Share Analysis
3.2. Comparative Analysis
3.2.1. Product Benchmarking
3.2.2. End User Profiling
3.2.3. Top 5 Financials Analysis
4. Crash Barrier Systems Market-Forces
4.1. Market Drivers
4.2. Market Constraints & Challenges
4.2.1. Power Of Suppliers
4.2.2. Threats From New Entrants
4.2.3. Power Of Buyer
4.2.4. Threat From Substitute Product
4.2.5. Degree Of Competition
5. Crash Barrier Systems Market-Strategic Analysis
5.1. Crash Barrier Systems Market - Value Chain Analysis
5.2. Pricing Analysis
5.3. Opportunity Analysis
5.4. Product Life Cycle
5.5. Suppliers And Distributors
5.6. Swot Analysis
6. Crash Barrier Systems Market By Types
6.1. Introduction
6.2. Portable Barrier System
6.3. Fixed Barrier System
6.4. Others
7. Crash Barrier Systems Market By Technology
7.1. Introduction
7.2. Rigid Barriers
7.3. Semi-Rigid Barriers
7.4. Flexible Barriers
8. Crash Barrier Systems Market By Device
8.1. Crash Cushions
8.2. Gating And Non-Gating Products
8.3. Guardrails Energy Absorbent Terminals (Geat)
8.4. Water And Sand Filled Plastic Barriers
8.5. Others (Hex-Foam Sandwich Systems, Brake Master, Low Maintenance Attenuators)
9. Crash Barrier Systems Market By Application
9.1. Roadside Barriers
9.2. Median Barriers
9.3. Work Zone Barriers
9.4. Bridge Barriers
9.5. Others (Hilly Terrains, Racing Tracks, And Pedestrian Foot Path Barriers)
10. Crash Barrier Systems Market-By Geography
10.1. Americas
10.1.1. U.S.
10.1.2. Canada
10.1.3. Mexico
10.1.4. Brazil
10.1.5. Ro America
10.2. Europe
10.2.1. U.K.
10.2.2. Germany
10.2.3. Italy
10.2.4. Ro Europe
10.3. Asia
10.3.1. China
10.3.2. South Korea
10.3.3. Japan
10.3.4. India
10.3.5. Ro Apac
10.4. Rest Of The World (Row)
11. Crash Barrier Systems Market Entropy
11.1. New Product Developments
11.2. Mergers And Acquisitions
12. Company Profiles
12.1. Technocrats Security Systems Pvt. Ltd.,
12.2. Transpo Industries, Inc.
12.3. Certified Traffic Controllers, Inc.
12.4. Avon Barrier Corporation Ltd.
12.5. Rs Security Co Ltd
12.6. Trinity Highway Products, Llc.,
12.7. Lindsay Corporation
12.8. Hill & Smith Ltd
12.9. Salmen Tech Company, Inc
12.10. Stalfa Sp. Z O.O. (Llc)
*More than 10 Companies are profiled in this Research Report*
"*Financials would be provided on a best efforts basis for private companies"
List of Tables
Table 1: Crash Barrier Systems Market Overview 2023-2030
Table 2: Crash Barrier Systems Market Leader Analysis 2023-2024 (US$)
Table 3: Crash Barrier Systems MarketProduct Analysis 2023-2024 (US$)
Table 4: Crash Barrier Systems MarketEnd User Analysis 2023-2024 (US$)
Table 5: Crash Barrier Systems MarketPatent Analysis 2021-2023* (US$)
Table 6: Crash Barrier Systems MarketFinancial Analysis 2023-2024 (US$)
Table 7: Crash Barrier Systems Market Driver Analysis 2023-2024 (US$)
Table 8: Crash Barrier Systems MarketChallenges Analysis 2023-2024 (US$)
Table 9: Crash Barrier Systems MarketConstraint Analysis 2023-2024 (US$)
Table 10: Crash Barrier Systems Market Supplier Bargaining Power Analysis 2023-2024 (US$)
Table 11: Crash Barrier Systems Market Buyer Bargaining Power Analysis 2023-2024 (US$)
Table 12: Crash Barrier Systems Market Threat of Substitutes Analysis 2023-2024 (US$)
Table 13: Crash Barrier Systems Market Threat of New Entrants Analysis 2023-2024 (US$)
Table 14: Crash Barrier Systems Market Degree of Competition Analysis 2023-2024 (US$)
Table 15: Crash Barrier Systems MarketValue Chain Analysis 2023-2024 (US$)
Table 16: Crash Barrier Systems MarketPricing Analysis 2023-2030 (US$)
Table 17: Crash Barrier Systems MarketOpportunities Analysis 2023-2030 (US$)
Table 18: Crash Barrier Systems MarketProduct Life Cycle Analysis 2023-2030 (US$)
Table 19: Crash Barrier Systems MarketSupplier Analysis 2023-2024 (US$)
Table 20: Crash Barrier Systems MarketDistributor Analysis 2023-2024 (US$)
Table 21: Crash Barrier Systems Market Trend Analysis 2023-2024 (US$)
Table 22: Crash Barrier Systems Market Size 2023 (US$)
Table 23: Crash Barrier Systems Market Forecast Analysis 2023-2030 (US$)
Table 24: Crash Barrier Systems Market Sales Forecast Analysis 2023-2030 (Units)
Table 25: Crash Barrier Systems Market, Revenue & Volume,By Type, 2023-2030 ($)
Table 26: Crash Barrier Systems MarketBy Type, Revenue & Volume,By Portable Barrier System, 2023-2030 ($)
Table 27: Crash Barrier Systems MarketBy Type, Revenue & Volume,By Fixed Barrier System, 2023-2030 ($)
Table 28: Crash Barrier Systems Market, Revenue & Volume,By Technology, 2023-2030 ($)
Table 29: Crash Barrier Systems MarketBy Technology, Revenue & Volume,By Rigid Barriers, 2023-2030 ($)
Table 30: Crash Barrier Systems MarketBy Technology, Revenue & Volume,By Semi-Rigid Barriers, 2023-2030 ($)
Table 31: Crash Barrier Systems MarketBy Technology, Revenue & Volume,By Flexible Barriers, 2023-2030 ($)
Table 32: Crash Barrier Systems Market, Revenue & Volume,By Device, 2023-2030 ($)
Table 33: Crash Barrier Systems MarketBy Device, Revenue & Volume,By Crash Cushions, 2023-2030 ($)
Table 34: Crash Barrier Systems MarketBy Device, Revenue & Volume,By Gating And Non-Gating Products, 2023-2030 ($)
Table 35: Crash Barrier Systems MarketBy Device, Revenue & Volume,By Guardrails Energy Absorbent Terminals, 2023-2030 ($)
Table 36: Crash Barrier Systems MarketBy Device, Revenue & Volume,By Water And Sand Filled Plastic Barriers, 2023-2030 ($)
Table 37: Crash Barrier Systems MarketBy Device, Revenue & Volume,By Hex-Foam Sandwich Systems, 2023-2030 ($)
Table 38: North America Crash Barrier Systems Market, Revenue & Volume,By Type, 2023-2030 ($)
Table 39: North America Crash Barrier Systems Market, Revenue & Volume,By Technology, 2023-2030 ($)
Table 40: North America Crash Barrier Systems Market, Revenue & Volume,By Device, 2023-2030 ($)
Table 41: South america Crash Barrier Systems Market, Revenue & Volume,By Type, 2023-2030 ($)
Table 42: South america Crash Barrier Systems Market, Revenue & Volume,By Technology, 2023-2030 ($)
Table 43: South america Crash Barrier Systems Market, Revenue & Volume,By Device, 2023-2030 ($)
Table 44: Europe Crash Barrier Systems Market, Revenue & Volume,By Type, 2023-2030 ($)
Table 45: Europe Crash Barrier Systems Market, Revenue & Volume,By Technology, 2023-2030 ($)
Table 46: Europe Crash Barrier Systems Market, Revenue & Volume,By Device, 2023-2030 ($)
Table 47: APAC Crash Barrier Systems Market, Revenue & Volume,By Type, 2023-2030 ($)
Table 48: APAC Crash Barrier Systems Market, Revenue & Volume,By Technology, 2023-2030 ($)
Table 49: APAC Crash Barrier Systems Market, Revenue & Volume,By Device, 2023-2030 ($)
Table 50: Middle East & Africa Crash Barrier Systems Market, Revenue & Volume,By Type, 2023-2030 ($)
Table 51: Middle East & Africa Crash Barrier Systems Market, Revenue & Volume,By Technology, 2023-2030 ($)
Table 52: Middle East & Africa Crash Barrier Systems Market, Revenue & Volume,By Device, 2023-2030 ($)
Table 53: Russia Crash Barrier Systems Market, Revenue & Volume,By Type, 2023-2030 ($)
Table 54: Russia Crash Barrier Systems Market, Revenue & Volume,By Technology, 2023-2030 ($)
Table 55: Russia Crash Barrier Systems Market, Revenue & Volume,By Device, 2023-2030 ($)
Table 56: Israel Crash Barrier Systems Market, Revenue & Volume,By Type, 2023-2030 ($)
Table 57: Israel Crash Barrier Systems Market, Revenue & Volume,By Technology, 2023-2030 ($)
Table 58: Israel Crash Barrier Systems Market, Revenue & Volume,By Device, 2023-2030 ($)
Table 59: Top Companies 2023 (US$)Crash Barrier Systems Market, Revenue & Volume,,
Table 60: Product Launch 2023-2024Crash Barrier Systems Market, Revenue & Volume,,
Table 61: Mergers & Acquistions 2023-2024Crash Barrier Systems Market, Revenue & Volume,,
List of Figures
Figure 1: Overview of Crash Barrier Systems Market 2023-2030
Figure 2: Market Share Analysis for Crash Barrier Systems Market 2023 (US$)
Figure 3: Product Comparison in Crash Barrier Systems Market 2023-2024 (US$)
Figure 4: End User Profile for Crash Barrier Systems Market 2023-2024 (US$)
Figure 5: Patent Application and Grant in Crash Barrier Systems Market 2021-2023* (US$)
Figure 6: Top 5 Companies Financial Analysis in Crash Barrier Systems Market 2023-2024 (US$)
Figure 7: Market Entry Strategy in Crash Barrier Systems Market 2023-2024
Figure 8: Ecosystem Analysis in Crash Barrier Systems Market2023
Figure 9: Average Selling Price in Crash Barrier Systems Market 2023-2030
Figure 10: Top Opportunites in Crash Barrier Systems Market 2023-2024
Figure 11: Market Life Cycle Analysis in Crash Barrier Systems Market
Figure 12: GlobalBy TypeCrash Barrier Systems Market Revenue, 2023-2030 ($)
Figure 13: GlobalBy TechnologyCrash Barrier Systems Market Revenue, 2023-2030 ($)
Figure 14: GlobalBy DeviceCrash Barrier Systems Market Revenue, 2023-2030 ($)
Figure 15: Global Crash Barrier Systems Market - By Geography
Figure 16: Global Crash Barrier Systems Market Value & Volume, By Geography, 2023-2030 ($)
Figure 17: Global Crash Barrier Systems Market CAGR, By Geography, 2023-2030 (%)
Figure 18: North America Crash Barrier Systems Market Value & Volume, 2023-2030 ($)
Figure 19: US Crash Barrier Systems Market Value & Volume, 2023-2030 ($)
Figure 20: US GDP and Population, 2023-2024 ($)
Figure 21: US GDP – Composition of 2023, By Sector of Origin
Figure 22: US Export and Import Value & Volume, 2023-2024 ($)
Figure 23: Canada Crash Barrier Systems Market Value & Volume, 2023-2030 ($)
Figure 24: Canada GDP and Population, 2023-2024 ($)
Figure 25: Canada GDP – Composition of 2023, By Sector of Origin
Figure 26: Canada Export and Import Value & Volume, 2023-2024 ($)
Figure 27: Mexico Crash Barrier Systems Market Value & Volume, 2023-2030 ($)
Figure 28: Mexico GDP and Population, 2023-2024 ($)
Figure 29: Mexico GDP – Composition of 2023, By Sector of Origin
Figure 30: Mexico Export and Import Value & Volume, 2023-2024 ($)
Figure 31: South America Crash Barrier Systems MarketSouth America 3D Printing Market Value & Volume, 2023-2030 ($)
Figure 32: Brazil Crash Barrier Systems Market Value & Volume, 2023-2030 ($)
Figure 33: Brazil GDP and Population, 2023-2024 ($)
Figure 34: Brazil GDP – Composition of 2023, By Sector of Origin
Figure 35: Brazil Export and Import Value & Volume, 2023-2024 ($)
Figure 36: Venezuela Crash Barrier Systems Market Value & Volume, 2023-2030 ($)
Figure 37: Venezuela GDP and Population, 2023-2024 ($)
Figure 38: Venezuela GDP – Composition of 2023, By Sector of Origin
Figure 39: Venezuela Export and Import Value & Volume, 2023-2024 ($)
Figure 40: Argentina Crash Barrier Systems Market Value & Volume, 2023-2030 ($)
Figure 41: Argentina GDP and Population, 2023-2024 ($)
Figure 42: Argentina GDP – Composition of 2023, By Sector of Origin
Figure 43: Argentina Export and Import Value & Volume, 2023-2024 ($)
Figure 44: Ecuador Crash Barrier Systems Market Value & Volume, 2023-2030 ($)
Figure 45: Ecuador GDP and Population, 2023-2024 ($)
Figure 46: Ecuador GDP – Composition of 2023, By Sector of Origin
Figure 47: Ecuador Export and Import Value & Volume, 2023-2024 ($)
Figure 48: Peru Crash Barrier Systems Market Value & Volume, 2023-2030 ($)
Figure 49: Peru GDP and Population, 2023-2024 ($)
Figure 50: Peru GDP – Composition of 2023, By Sector of Origin
Figure 51: Peru Export and Import Value & Volume, 2023-2024 ($)
Figure 52: Colombia Crash Barrier Systems Market Value & Volume, 2023-2030 ($)
Figure 53: Colombia GDP and Population, 2023-2024 ($)
Figure 54: Colombia GDP – Composition of 2023, By Sector of Origin
Figure 55: Colombia Export and Import Value & Volume, 2023-2024 ($)
Figure 56: Costa Rica Crash Barrier Systems MarketCosta Rica 3D Printing Market Value & Volume, 2023-2030 ($)
Figure 57: Costa Rica GDP and Population, 2023-2024 ($)
Figure 58: Costa Rica GDP – Composition of 2023, By Sector of Origin
Figure 59: Costa Rica Export and Import Value & Volume, 2023-2024 ($)
Figure 60: Europe Crash Barrier Systems Market Value & Volume, 2023-2030 ($)
Figure 61: U.K Crash Barrier Systems Market Value & Volume, 2023-2030 ($)
Figure 62: U.K GDP and Population, 2023-2024 ($)
Figure 63: U.K GDP – Composition of 2023, By Sector of Origin
Figure 64: U.K Export and Import Value & Volume, 2023-2024 ($)
Figure 65: Germany Crash Barrier Systems Market Value & Volume, 2023-2030 ($)
Figure 66: Germany GDP and Population, 2023-2024 ($)
Figure 67: Germany GDP – Composition of 2023, By Sector of Origin
Figure 68: Germany Export and Import Value & Volume, 2023-2024 ($)
Figure 69: Italy Crash Barrier Systems Market Value & Volume, 2023-2030 ($)
Figure 70: Italy GDP and Population, 2023-2024 ($)
Figure 71: Italy GDP – Composition of 2023, By Sector of Origin
Figure 72: Italy Export and Import Value & Volume, 2023-2024 ($)
Figure 73: France Crash Barrier Systems Market Value & Volume, 2023-2030 ($)
Figure 74: France GDP and Population, 2023-2024 ($)
Figure 75: France GDP – Composition of 2023, By Sector of Origin
Figure 76: France Export and Import Value & Volume, 2023-2024 ($)
Figure 77: Netherlands Crash Barrier Systems Market Value & Volume, 2023-2030 ($)
Figure 78: Netherlands GDP and Population, 2023-2024 ($)
Figure 79: Netherlands GDP – Composition of 2023, By Sector of Origin
Figure 80: Netherlands Export and Import Value & Volume, 2023-2024 ($)
Figure 81: Belgium Crash Barrier Systems Market Value & Volume, 2023-2030 ($)
Figure 82: Belgium GDP and Population, 2023-2024 ($)
Figure 83: Belgium GDP – Composition of 2023, By Sector of Origin
Figure 84: Belgium Export and Import Value & Volume, 2023-2024 ($)
Figure 85: Spain Crash Barrier Systems Market Value & Volume, 2023-2030 ($)
Figure 86: Spain GDP and Population, 2023-2024 ($)
Figure 87: Spain GDP – Composition of 2023, By Sector of Origin
Figure 88: Spain Export and Import Value & Volume, 2023-2024 ($)
Figure 89: Denmark Crash Barrier Systems Market Value & Volume, 2023-2030 ($)
Figure 90: Denmark GDP and Population, 2023-2024 ($)
Figure 91: Denmark GDP – Composition of 2023, By Sector of Origin
Figure 92: Denmark Export and Import Value & Volume, 2023-2024 ($)
Figure 93: APAC Crash Barrier Systems Market Value & Volume, 2023-2030 ($)
Figure 94: China Crash Barrier Systems MarketValue & Volume, 2023-2030
Figure 95: China GDP and Population, 2023-2024 ($)
Figure 96: China GDP – Composition of 2023, By Sector of Origin
Figure 97: China Export and Import Value & Volume, 2023-2024 ($)Crash Barrier Systems MarketChina Export and Import Value & Volume, 2023-2024 ($)
Figure 98: Australia Crash Barrier Systems Market Value & Volume, 2023-2030 ($)
Figure 99: Australia GDP and Population, 2023-2024 ($)
Figure 100: Australia GDP – Composition of 2023, By Sector of Origin
Figure 101: Australia Export and Import Value & Volume, 2023-2024 ($)
Figure 102: South Korea Crash Barrier Systems Market Value & Volume, 2023-2030 ($)
Figure 103: South Korea GDP and Population, 2023-2024 ($)
Figure 104: South Korea GDP – Composition of 2023, By Sector of Origin
Figure 105: South Korea Export and Import Value & Volume, 2023-2024 ($)
Figure 106: India Crash Barrier Systems Market Value & Volume, 2023-2030 ($)
Figure 107: India GDP and Population, 2023-2024 ($)
Figure 108: India GDP – Composition of 2023, By Sector of Origin
Figure 109: India Export and Import Value & Volume, 2023-2024 ($)
Figure 110: Taiwan Crash Barrier Systems MarketTaiwan 3D Printing Market Value & Volume, 2023-2030 ($)
Figure 111: Taiwan GDP and Population, 2023-2024 ($)
Figure 112: Taiwan GDP – Composition of 2023, By Sector of Origin
Figure 113: Taiwan Export and Import Value & Volume, 2023-2024 ($)
Figure 114: Malaysia Crash Barrier Systems MarketMalaysia 3D Printing Market Value & Volume, 2023-2030 ($)
Figure 115: Malaysia GDP and Population, 2023-2024 ($)
Figure 116: Malaysia GDP – Composition of 2023, By Sector of Origin
Figure 117: Malaysia Export and Import Value & Volume, 2023-2024 ($)
Figure 118: Hong Kong Crash Barrier Systems MarketHong Kong 3D Printing Market Value & Volume, 2023-2030 ($)
Figure 119: Hong Kong GDP and Population, 2023-2024 ($)
Figure 120: Hong Kong GDP – Composition of 2023, By Sector of Origin
Figure 121: Hong Kong Export and Import Value & Volume, 2023-2024 ($)
Figure 122: Middle East & Africa Crash Barrier Systems MarketMiddle East & Africa 3D Printing Market Value & Volume, 2023-2030 ($)
Figure 123: Russia Crash Barrier Systems MarketRussia 3D Printing Market Value & Volume, 2023-2030 ($)
Figure 124: Russia GDP and Population, 2023-2024 ($)
Figure 125: Russia GDP – Composition of 2023, By Sector of Origin
Figure 126: Russia Export and Import Value & Volume, 2023-2024 ($)
Figure 127: Israel Crash Barrier Systems Market Value & Volume, 2023-2030 ($)
Figure 128: Israel GDP and Population, 2023-2024 ($)
Figure 129: Israel GDP – Composition of 2023, By Sector of Origin
Figure 130: Israel Export and Import Value & Volume, 2023-2024 ($)
Figure 131: Entropy Share, By Strategies, 2023-2024* (%)Crash Barrier Systems Market
Figure 132: Developments, 2023-2024*Crash Barrier Systems Market
Figure 133: Company 1 Crash Barrier Systems Market Net Revenue, By Years, 2023-2024* ($)
Figure 134: Company 1 Crash Barrier Systems Market Net Revenue Share, By Business segments, 2023 (%)
Figure 135: Company 1 Crash Barrier Systems Market Net Sales Share, By Geography, 2023 (%)
Figure 136: Company 2 Crash Barrier Systems Market Net Revenue, By Years, 2023-2024* ($)
Figure 137: Company 2 Crash Barrier Systems Market Net Revenue Share, By Business segments, 2023 (%)
Figure 138: Company 2 Crash Barrier Systems Market Net Sales Share, By Geography, 2023 (%)
Figure 139: Company 3Crash Barrier Systems Market Net Revenue, By Years, 2023-2024* ($)
Figure 140: Company 3Crash Barrier Systems Market Net Revenue Share, By Business segments, 2023 (%)
Figure 141: Company 3Crash Barrier Systems Market Net Sales Share, By Geography, 2023 (%)
Figure 142: Company 4 Crash Barrier Systems Market Net Revenue, By Years, 2023-2024* ($)
Figure 143: Company 4 Crash Barrier Systems Market Net Revenue Share, By Business segments, 2023 (%)
Figure 144: Company 4 Crash Barrier Systems Market Net Sales Share, By Geography, 2023 (%)
Figure 145: Company 5 Crash Barrier Systems Market Net Revenue, By Years, 2023-2024* ($)
Figure 146: Company 5 Crash Barrier Systems Market Net Revenue Share, By Business segments, 2023 (%)
Figure 147: Company 5 Crash Barrier Systems Market Net Sales Share, By Geography, 2023 (%)
Figure 148: Company 6 Crash Barrier Systems Market Net Revenue, By Years, 2023-2024* ($)
Figure 149: Company 6 Crash Barrier Systems Market Net Revenue Share, By Business segments, 2023 (%)
Figure 150: Company 6 Crash Barrier Systems Market Net Sales Share, By Geography, 2023 (%)
Figure 151: Company 7 Crash Barrier Systems Market Net Revenue, By Years, 2023-2024* ($)
Figure 152: Company 7 Crash Barrier Systems Market Net Revenue Share, By Business segments, 2023 (%)
Figure 153: Company 7 Crash Barrier Systems Market Net Sales Share, By Geography, 2023 (%)
Figure 154: Company 8 Crash Barrier Systems Market Net Revenue, By Years, 2023-2024* ($)
Figure 155: Company 8 Crash Barrier Systems Market Net Revenue Share, By Business segments, 2023 (%)
Figure 156: Company 8 Crash Barrier Systems Market Net Sales Share, By Geography, 2023 (%)
Figure 157: Company 9 Crash Barrier Systems Market Net Revenue, By Years, 2023-2024* ($)
Figure 158: Company 9 Crash Barrier Systems Market Net Revenue Share, By Business segments, 2023 (%)
Figure 159: Company 9 Crash Barrier Systems Market Net Sales Share, By Geography, 2023 (%)
Figure 160: Company 10 Crash Barrier Systems Market Net Revenue, By Years, 2023-2024* ($)
Figure 161: Company 10 Crash Barrier Systems Market Net Revenue Share, By Business segments, 2023 (%)
Figure 162: Company 10 Crash Barrier Systems Market Net Sales Share, By Geography, 2023 (%)
Figure 163: Company 11 Crash Barrier Systems Market Net Revenue, By Years, 2023-2024* ($)
Figure 164: Company 11 Crash Barrier Systems Market Net Revenue Share, By Business segments, 2023 (%)
Figure 165: Company 11 Crash Barrier Systems Market Net Sales Share, By Geography, 2023 (%)
Figure 166: Company 12 Crash Barrier Systems Market Net Revenue, By Years, 2023-2024* ($)
Figure 167: Company 12 Crash Barrier Systems Market Net Revenue Share, By Business segments, 2023 (%)
Figure 168: Company 12 Crash Barrier Systems Market Net Sales Share, By Geography, 2023 (%)
Figure 169: Company 13Crash Barrier Systems Market Net Revenue, By Years, 2023-2024* ($)
Figure 170: Company 13Crash Barrier Systems Market Net Revenue Share, By Business segments, 2023 (%)
Figure 171: Company 13Crash Barrier Systems Market Net Sales Share, By Geography, 2023 (%)
Figure 172: Company 14 Crash Barrier Systems Market Net Revenue, By Years, 2023-2024* ($)
Figure 173: Company 14 Crash Barrier Systems Market Net Revenue Share, By Business segments, 2023 (%)
Figure 174: Company 14 Crash Barrier Systems Market Net Sales Share, By Geography, 2023 (%)
Figure 175: Company 15 Crash Barrier Systems Market Net Revenue, By Years, 2023-2024* ($)
Figure 176: Company 15 Crash Barrier Systems Market Net Revenue Share, By Business segments, 2023 (%)
Figure 177: Company 15 Crash Barrier Systems Market Net Sales Share, By Geography, 2023 (%)