 Email
Email Print
Print


Drone refers to a UAV (unmanned aerial vehicle), and also referred to as an unpiloted aerial vehicle and a remotely piloted aircraft or simply we can consider it as a flying robot. Unmanned aircraft systems (UAS) are an aircraft and its associated elements, which are operated with no pilot on board. Drones are used in a situations or conditions where manned flight is considered to be too risky or harmful.
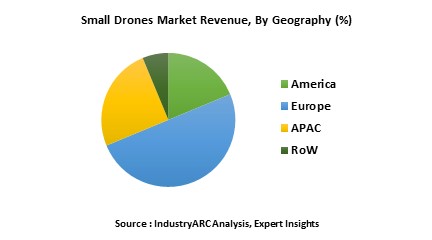
The global small drones market has grown from USD XX Billion in 2015 and projected to grow about USD XX Billion by 2020, at a CAGR of XX% during the forecast period because the geographical information regarding the manufacturing and utilization of small drones is extensively increasing from a past decade. Many countries have taken up the use of drones in the field of army and the information shows us about the usage of drones in order to target the other countries. Among the major countries, U.S.A occupies the first position to approve the usage of drones, followed by Britain, Germany, and Poland and so on. As such even India started using the drone market for both defense as well as commercial applications. But there are some drone strikes across the globes where a survey explains that all the developed countries approves the utilization of drones whereas the developing countries partially approve the drone strikes. India tops the list of drone importing countries wherein India bought X% of the world’s unmanned aerial vehicle imports between 1985 and 2016.
The applications of this particular small drones may be seen in different fields such as defense, mining, automotive industries, chemical industries etc, the major utilization of drones can be seen where there is an involvement of human risks. Small drones for example are: agriculture, mining, pipeline and power inspection, highway monitoring, natural resources monitoring, atmospheric research, media and entertainment, sport photos, filming, wildlife protection, disaster relief, geographical information system, defense applications.
The environments of utility of drones are not same. Owing to the dynamism of the market and new technology there is a vast development in the utility as well as manufacturing of small drones when compared to few decades ago. Being small drones which are sub-segment of the unarmed aerial vehicles, these products are constantly evolving and experiencing a rapid upsurge in terms of technological advancements, increasing automation. The drivers of this small drones market may vary with respect to time but some of the constant drivers of this particular market are majorly its components manufacturing companies as well as also the technological advancements. Few of the drivers of this particular market are the growth of global positioning system (GPS), frame manufacturing companies and technological advancements.
The major application of small drones is in the field of defense where there is an involvement of human risks. So, the usage of drones in the place of humans may reduce the loss of human lives and even a better targeting and precision can be achieved. Some believe that the asymmetry of fighting humans with machines that are controlled from a safe distance lacks integrity and honor that was once valued during warfare. Others feel that if such technology is available, then a moral duty exists to employ it to save as many lives as possible. Drones are seen by many in the military as delivering precision strikes without the need for more intrusive military action. Security and Control, Battlefield Management can be achieved perfectly at any instant of time.
1. Small Drones Market - Overview
1.1. Definitions and Scope
2. Small Drones Market - Executive summary
2.1. Market Revenue, Market Size and Key Trends by Company
2.2. Key Trends by type of Application
2.3. Key Trends segmented by Geography
3. Small Drones Market
3.1. Comparative analysis
3.1.1. Product Benchmarking - Top 10 companies
3.1.2. Top 5 Financials Analysis
3.1.3. Market Value split by Top 10 companies
3.1.4. Patent Analysis - Top 10 companies
3.1.5. Pricing Analysis
4. Small Drones Market – Startup companies Scenario Premium
4.1. Top 10 startup company Analysis by
4.1.1. Investment
4.1.2. Revenue
4.1.3. Market Shares
4.1.4. Market Size and Application Analysis
4.1.5. Venture Capital and Funding Scenario
5. Small Drones Market – Industry Market Entry Scenario Premium
5.1. Regulatory Framework Overview
5.2. New Business and Ease of Doing business index
5.3. Case studies of successful ventures
5.4. Customer Analysis – Top 10 companies
6. Small Drones Market Forces
6.1. Drivers
6.2. Constraints
6.3. Challenges
6.4. Porters five force model
6.4.1. Bargaining power of suppliers
6.4.2. Bargaining powers of customers
6.4.3. Threat of new entrants
6.4.4. Rivalry among existing players
6.4.5. Threat of substitutes
7. Small Drones Market -Strategic analysis
7.1. Value chain analysis
7.2. Opportunities analysis
7.3. Product life cycle
7.4. Suppliers and distributors Market Share
8. Small Drones Market – By Maximum Take-Off Weight (Market Size -$Million / $Billion)
8.1. Market Size and Market Share Analysis
8.2. Application Revenue and Trend Research
8.3. Product Segment Analysis
8.3.1. Introduction
8.3.2. Nano (<=250g)
8.3.3. Micro (>250g – 2kg)
8.3.4. Mini
8.3.4.1. >2-25kg
8.3.4.2. >25-150kg
9. Small Drones Market – By Type (Market Size -$Million / $Billion)
9.1. Introduction
9.2. Rotary Blade
9.2.1. Single
9.2.2. Multi
9.3. Fixed Wing
9.4. Others
10. Small Drones Market – By Payload (Market Size -$Million / $Billion)
10.1. Introduction
10.2. Video Cameras
10.3. Wireless Communication Systems
10.4. Sensors
10.5. Narcotics
10.6. Explosives
10.7. Parcels
10.8. Medicines
10.9. Meals
10.10. Supplies
10.11. Fire Extinguishers
10.12. Others
11. Small Drones Market – By Width (Market Size -$Million / $Billion)
11.1. Introduction
11.2. <=75 mm
11.3. >75-<=200 mm
11.4. >200-<=500 mm
11.5. >500-<=1000 mm
11.6. >1000-<=2000 mm
11.7. >=2000 mm
12. Small Drones Market – By Distribution Channel (Market Size -$Million / $Billion)
12.1. Introduction
12.2. Online
12.3. Offline
12.3.1. Hypermarkets
12.3.2. Specialized Stores
12.3.3. Others
13. Small Drones – By End Use(Market Size -$Million / $Billion)
13.1. Segment type Size and Market Share Analysis
13.2. Application Revenue and Trends by type of Application
13.3. Application Segment Analysis by Type
13.3.1. Introduction
13.3.2. Security
13.3.2.1. Surveillance & Monitoring
13.3.2.1.1. Traffic
13.3.2.1.2. Border
13.3.2.1.3. Coastal
13.3.2.1.4. Airports
13.3.2.1.5. International Summit Meetings
13.3.2.1.6. Administrative Buildings
13.3.2.1.6.1. Courts
13.3.2.1.6.2. Parliaments
13.3.2.1.6.3. Power Stations
13.3.2.1.6.4. Others
13.3.2.1.7. Others
13.3.2.2. Criminal Investigations
13.3.2.3. Emergency Communication Networks
13.3.2.4. Anti-Piracy Operations
13.3.2.5. Others
13.3.3. Mining
13.3.3.1. Monitoring
13.3.3.1.1. Mines
13.3.3.1.2. Minerals
13.3.3.1.3. Stockpile
13.3.3.1.4. Others
13.3.3.2. Mapping Deposit Sites
13.3.3.3. Tracking Equipment
13.3.3.4. Time-Lapse Photography
13.3.3.5. Others
13.3.4. Search and Rescue
13.3.4.1. Terrorism Search and Rescue
13.3.4.2. Natural Disasters Monitoring
13.3.4.3. Post-Disaster-Relief Operations
13.3.4.4. Catastrophe Monitoring
13.3.4.5. Others
13.3.5. Inspection
13.3.5.1. Oil Pipeline
13.3.5.2. Gas Pipeline
13.3.5.3. Bridge
13.3.5.4. Monumental
13.3.5.5. Power Line / Cable
13.3.5.6. Critical Infrastructure
13.3.5.7. Wind Turbine / Windmill
13.3.5.8. Railway / Train Line
13.3.5.9. Railway / Train Line
13.3.5.10. Railway / Train Line
13.3.5.11. Others
13.3.6. Agriculture
13.3.6.1. Multi-Spectral Imaging
13.3.6.2. Thermal Mapping
13.3.6.3. Others
13.3.7. Science and Academic Research
13.3.8. Surveying and Mapping
13.3.8.1. Roads
13.3.8.2. Railways
13.3.8.3. Power lines
13.3.8.4. Others
13.3.9. Media & Entertainment (Recreational)
13.3.10. Others
14. Small Drones - By Geography (Market Size -$Million / $Billion)
14.1. Small Drones Market - North America Segment Research
14.2. North America Market Research (Million / $Billion)
14.2.1. Segment type Size and Market Size Analysis
14.2.2. Revenue and Trends
14.2.3. Application Revenue and Trends by type of Application
14.2.4. Company Revenue and Product Analysis
14.2.5. North America Product type and Application Market Size
14.2.5.1. U.S.
14.2.5.2. Canada
14.2.5.3. Mexico
14.2.5.4. Rest of North America
14.3. Small Drones - South America Segment Research
14.4. South America Market Research (Market Size -$Million / $Billion)
14.4.1. Segment type Size and Market Size Analysis
14.4.2. Revenue and Trends
14.4.3. Application Revenue and Trends by type of Application
14.4.4. Company Revenue and Product Analysis
14.4.5. South America Product type and Application Market Size
14.4.5.1. Brazil
14.4.5.2. Venezuela
14.4.5.3. Argentina
14.4.5.4. Ecuador
14.4.5.5. Peru
14.4.5.6. Colombia
14.4.5.7. Costa Rica
14.4.5.8. Rest of South America
14.5. Small Drones - Europe Segment Research
14.6. Europe Market Research (Market Size -$Million / $Billion)
14.6.1. Segment type Size and Market Size Analysis
14.6.2. Revenue and Trends
14.6.3. Application Revenue and Trends by type of Application
14.6.4. Company Revenue and Product Analysis
14.6.5. Europe Segment Product type and Application Market Size
14.6.5.1. U.K
14.6.5.2. Germany
14.6.5.3. Italy
14.6.5.4. France
14.6.5.5. Netherlands
14.6.5.6. Belgium
14.6.5.7. Spain
14.6.5.8. Denmark
14.6.5.9. Rest of Europe
14.7. Small Drones – APAC Segment Research
14.8. APAC Market Research (Market Size -$Million / $Billion)
14.8.1. Segment type Size and Market Size Analysis
14.8.2. Revenue and Trends
14.8.3. Application Revenue and Trends by type of Application
14.8.4. Company Revenue and Product Analysis
14.8.5. APAC Segment – Product type and Application Market Size
14.8.5.1. China
14.8.5.2. Australia
14.8.5.3. Japan
14.8.5.4. South Korea
14.8.5.5. India
14.8.5.6. Taiwan
14.8.5.7. Malaysia
15. Small Drones Market - Entropy
15.1. New product launches
15.2. M&A's, collaborations, JVs and partnerships
16. Small Drones Market – Industry / Segment Competition landscape Premium
16.1. Market Share Analysis
16.1.1. Market Share by Country- Top companies
16.1.2. Market Share by Region- Top 10 companies
16.1.3. Market Share by type of Application – Top 10 companies
16.1.4. Market Share by type of Product / Product category- Top 10 companies
16.1.5. Market Share at global level- Top 10 companies
16.1.6. Best Practises for companies
17. Small Drones Market – Key Company List by Country Premium
18. Small Drones Market Company Analysis
18.1. Market Share, Company Revenue, Products, M&A, Developments
18.2. Company 1
18.3. Company 2
18.4. Company 3
18.5. Company 4
18.6. Company 5
18.7. Company 6
18.8. Company 7
18.9. Company 8
18.10. Company 9
18.11. Company 10 and more
"*Financials would be provided on a best efforts basis for private companies"
19. Small Drones Market -Appendix
19.1. Abbreviations
19.2. Sources
20. Small Drones Market -Methodology Premium
20.1. Research Methodology
20.1.1. Company Expert Interviews
20.1.2. Industry Databases
20.1.3. Associations
20.1.4. Company News
20.1.5. Company Annual Reports
20.1.6. Application Trends
20.1.7. New Products and Product database
20.1.8. Company Transcripts
20.1.9. R&D Trends
20.1.10. Key Opinion Leaders Interviews
20.1.11. Supply and Demand Trends
List of Tables
Table 1 Small Drones Market Overview 2023-2030
Table 2 Small Drones Market Leader Analysis 2023-2030 (US$)
Table 3 Small Drones MarketProduct Analysis 2023-2030 (US$)
Table 4 Small Drones MarketEnd User Analysis 2023-2030 (US$)
Table 5 Small Drones MarketPatent Analysis 2013-2023* (US$)
Table 6 Small Drones MarketFinancial Analysis 2023-2030 (US$)
Table 7 Small Drones Market Driver Analysis 2023-2030 (US$)
Table 8 Small Drones MarketChallenges Analysis 2023-2030 (US$)
Table 9 Small Drones MarketConstraint Analysis 2023-2030 (US$)
Table 10 Small Drones Market Supplier Bargaining Power Analysis 2023-2030 (US$)
Table 11 Small Drones Market Buyer Bargaining Power Analysis 2023-2030 (US$)
Table 12 Small Drones Market Threat of Substitutes Analysis 2023-2030 (US$)
Table 13 Small Drones Market Threat of New Entrants Analysis 2023-2030 (US$)
Table 14 Small Drones Market Degree of Competition Analysis 2023-2030 (US$)
Table 15 Small Drones MarketValue Chain Analysis 2023-2030 (US$)
Table 16 Small Drones MarketPricing Analysis 2023-2030 (US$)
Table 17 Small Drones MarketOpportunities Analysis 2023-2030 (US$)
Table 18 Small Drones MarketProduct Life Cycle Analysis 2023-2030 (US$)
Table 19 Small Drones MarketSupplier Analysis 2023-2030 (US$)
Table 20 Small Drones MarketDistributor Analysis 2023-2030 (US$)
Table 21 Small Drones Market Trend Analysis 2023-2030 (US$)
Table 22 Small Drones Market Size 2023 (US$)
Table 23 Small Drones Market Forecast Analysis 2023-2030 (US$)
Table 24 Small Drones Market Sales Forecast Analysis 2023-2030 (Units)
Table 25 Small Drones Market, Revenue & Volume,By Frame, 2023-2030 ($)
Table 26 Small Drones MarketBy Frame, Revenue & Volume,By Tricopter, 2023-2030 ($)
Table 27 Small Drones MarketBy Frame, Revenue & Volume,By Quadcopter, 2023-2030 ($)
Table 28 Small Drones MarketBy Frame, Revenue & Volume,By Hexacopter, 2023-2030 ($)
Table 29 Small Drones MarketBy Frame, Revenue & Volume,By Octacopter, 2023-2030 ($)
Table 30 Small Drones Market, Revenue & Volume,By Material, 2023-2030 ($)
Table 31 Small Drones MarketBy Material, Revenue & Volume,By Wood, 2023-2030 ($)
Table 32 Small Drones MarketBy Material, Revenue & Volume,By Plastics, 2023-2030 ($)
Table 33 Small Drones MarketBy Material, Revenue & Volume,By Aluminium, 2023-2030 ($)
Table 34 Small Drones MarketBy Material, Revenue & Volume,By Iron Alloys, 2023-2030 ($)
Table 35 Small Drones Market, Revenue & Volume,By Actuating Mechanism, 2023-2030 ($)
Table 36 Small Drones MarketBy Actuating Mechanism, Revenue & Volume,By Electric Motors, 2023-2030 ($)
Table 37 Small Drones MarketBy Actuating Mechanism, Revenue & Volume,By Servo Motors, 2023-2030 ($)
Table 38 Small Drones Market, Revenue & Volume,By Altitude, 2023-2030 ($)
Table 39 Small Drones MarketBy Altitude, Revenue & Volume,By Low Altitude, 2023-2030 ($)
Table 40 Small Drones MarketBy Altitude, Revenue & Volume,By Medium Altitude, 2023-2030 ($)
Table 41 Small Drones MarketBy Altitude, Revenue & Volume,By High Altitude, 2023-2030 ($)
Table 42 Small Drones Market, Revenue & Volume,By Industry, 2023-2030 ($)
Table 43 Small Drones MarketBy Industry, Revenue & Volume,By Aerospace And Defence , 2023-2030 ($)
Table 44 Small Drones MarketBy Industry, Revenue & Volume,By Automobile , 2023-2030 ($)
Table 45 Small Drones MarketBy Industry, Revenue & Volume,By Agriculture, 2023-2030 ($)
Table 46 Small Drones MarketBy Industry, Revenue & Volume,By Imaging, 2023-2030 ($)
Table 47 Small Drones MarketBy Industry, Revenue & Volume,By Oil & Gas, 2023-2030 ($)
Table 48 North America Small Drones Market, Revenue & Volume,By Frame, 2023-2030 ($)
Table 49 North America Small Drones Market, Revenue & Volume,By Material, 2023-2030 ($)
Table 50 North America Small Drones Market, Revenue & Volume,By Actuating Mechanism, 2023-2030 ($)
Table 51 North America Small Drones Market, Revenue & Volume,By Altitude, 2023-2030 ($)
Table 52 North America Small Drones Market, Revenue & Volume,By Industry, 2023-2030 ($)
Table 53 South america Small Drones Market, Revenue & Volume,By Frame, 2023-2030 ($)
Table 54 South america Small Drones Market, Revenue & Volume,By Material, 2023-2030 ($)
Table 55 South america Small Drones Market, Revenue & Volume,By Actuating Mechanism, 2023-2030 ($)
Table 56 South america Small Drones Market, Revenue & Volume,By Altitude, 2023-2030 ($)
Table 57 South america Small Drones Market, Revenue & Volume,By Industry, 2023-2030 ($)
Table 58 Europe Small Drones Market, Revenue & Volume,By Frame, 2023-2030 ($)
Table 59 Europe Small Drones Market, Revenue & Volume,By Material, 2023-2030 ($)
Table 60 Europe Small Drones Market, Revenue & Volume,By Actuating Mechanism, 2023-2030 ($)
Table 61 Europe Small Drones Market, Revenue & Volume,By Altitude, 2023-2030 ($)
Table 62 Europe Small Drones Market, Revenue & Volume,By Industry, 2023-2030 ($)
Table 63 APAC Small Drones Market, Revenue & Volume,By Frame, 2023-2030 ($)
Table 64 APAC Small Drones Market, Revenue & Volume,By Material, 2023-2030 ($)
Table 65 APAC Small Drones Market, Revenue & Volume,By Actuating Mechanism, 2023-2030 ($)
Table 66 APAC Small Drones Market, Revenue & Volume,By Altitude, 2023-2030 ($)
Table 67 APAC Small Drones Market, Revenue & Volume,By Industry, 2023-2030 ($)
Table 68 Middle East & Africa Small Drones Market, Revenue & Volume,By Frame, 2023-2030 ($)
Table 69 Middle East & Africa Small Drones Market, Revenue & Volume,By Material, 2023-2030 ($)
Table 70 Middle East & Africa Small Drones Market, Revenue & Volume,By Actuating Mechanism, 2023-2030 ($)
Table 71 Middle East & Africa Small Drones Market, Revenue & Volume,By Altitude, 2023-2030 ($)
Table 72 Middle East & Africa Small Drones Market, Revenue & Volume,By Industry, 2023-2030 ($)
Table 73 Russia Small Drones Market, Revenue & Volume,By Frame, 2023-2030 ($)
Table 74 Russia Small Drones Market, Revenue & Volume,By Material, 2023-2030 ($)
Table 75 Russia Small Drones Market, Revenue & Volume,By Actuating Mechanism, 2023-2030 ($)
Table 76 Russia Small Drones Market, Revenue & Volume,By Altitude, 2023-2030 ($)
Table 77 Russia Small Drones Market, Revenue & Volume,By Industry, 2023-2030 ($)
Table 78 Israel Small Drones Market, Revenue & Volume,By Frame, 2023-2030 ($)
Table 79 Israel Small Drones Market, Revenue & Volume,By Material, 2023-2030 ($)
Table 80 Israel Small Drones Market, Revenue & Volume,By Actuating Mechanism, 2023-2030 ($)
Table 81 Israel Small Drones Market, Revenue & Volume,By Altitude, 2023-2030 ($)
Table 82 Israel Small Drones Market, Revenue & Volume,By Industry, 2023-2030 ($)
Table 83 Top Companies 2023 (US$)Small Drones Market, Revenue & Volume,,
Table 84 Product Launch 2023-2030Small Drones Market, Revenue & Volume,,
Table 85 Mergers & Acquistions 2023-2030Small Drones Market, Revenue & Volume,,
List of Figures
Figure 1 Overview of Small Drones Market 2023-2030
Figure 2 Market Share Analysis for Small Drones Market 2023 (US$)
Figure 3 Product Comparison in Small Drones Market 2023-2030 (US$)
Figure 4 End User Profile for Small Drones Market 2023-2030 (US$)
Figure 5 Patent Application and Grant in Small Drones Market 2013-2023* (US$)
Figure 6 Top 5 Companies Financial Analysis in Small Drones Market 2023-2030 (US$)
Figure 7 Market Entry Strategy in Small Drones Market 2023-2030
Figure 8 Ecosystem Analysis in Small Drones Market2023
Figure 9 Average Selling Price in Small Drones Market 2023-2030
Figure 10 Top Opportunites in Small Drones Market 2023-2030
Figure 11 Market Life Cycle Analysis in Small Drones Market
Figure 12 GlobalBy FrameSmall Drones Market Revenue, 2023-2030 ($)
Figure 13 GlobalBy MaterialSmall Drones Market Revenue, 2023-2030 ($)
Figure 14 GlobalBy Actuating MechanismSmall Drones Market Revenue, 2023-2030 ($)
Figure 15 GlobalBy AltitudeSmall Drones Market Revenue, 2023-2030 ($)
Figure 16 GlobalBy IndustrySmall Drones Market Revenue, 2023-2030 ($)
Figure 17 Global Small Drones Market - By Geography
Figure 18 Global Small Drones Market Value & Volume, By Geography, 2023-2030 ($)
Figure 19 Global Small Drones Market CAGR, By Geography, 2023-2030 (%)
Figure 20 North America Small Drones Market Value & Volume, 2023-2030 ($)
Figure 21 US Small Drones Market Value & Volume, 2023-2030 ($)
Figure 22 US GDP and Population, 2023-2030 ($)
Figure 23 US GDP – Composition of 2023, By Sector of Origin
Figure 24 US Export and Import Value & Volume, 2023-2030 ($)
Figure 25 Canada Small Drones Market Value & Volume, 2023-2030 ($)
Figure 26 Canada GDP and Population, 2023-2030 ($)
Figure 27 Canada GDP – Composition of 2023, By Sector of Origin
Figure 28 Canada Export and Import Value & Volume, 2023-2030 ($)
Figure 29 Mexico Small Drones Market Value & Volume, 2023-2030 ($)
Figure 30 Mexico GDP and Population, 2023-2030 ($)
Figure 31 Mexico GDP – Composition of 2023, By Sector of Origin
Figure 32 Mexico Export and Import Value & Volume, 2023-2030 ($)
Figure 33 South America Small Drones MarketSouth America 3D Printing Market Value & Volume, 2023-2030 ($)
Figure 34 Brazil Small Drones Market Value & Volume, 2023-2030 ($)
Figure 35 Brazil GDP and Population, 2023-2030 ($)
Figure 36 Brazil GDP – Composition of 2023, By Sector of Origin
Figure 37 Brazil Export and Import Value & Volume, 2023-2030 ($)
Figure 38 Venezuela Small Drones Market Value & Volume, 2023-2030 ($)
Figure 39 Venezuela GDP and Population, 2023-2030 ($)
Figure 40 Venezuela GDP – Composition of 2023, By Sector of Origin
Figure 41 Venezuela Export and Import Value & Volume, 2023-2030 ($)
Figure 42 Argentina Small Drones Market Value & Volume, 2023-2030 ($)
Figure 43 Argentina GDP and Population, 2023-2030 ($)
Figure 44 Argentina GDP – Composition of 2023, By Sector of Origin
Figure 45 Argentina Export and Import Value & Volume, 2023-2030 ($)
Figure 46 Ecuador Small Drones Market Value & Volume, 2023-2030 ($)
Figure 47 Ecuador GDP and Population, 2023-2030 ($)
Figure 48 Ecuador GDP – Composition of 2023, By Sector of Origin
Figure 49 Ecuador Export and Import Value & Volume, 2023-2030 ($)
Figure 50 Peru Small Drones Market Value & Volume, 2023-2030 ($)
Figure 51 Peru GDP and Population, 2023-2030 ($)
Figure 52 Peru GDP – Composition of 2023, By Sector of Origin
Figure 53 Peru Export and Import Value & Volume, 2023-2030 ($)
Figure 54 Colombia Small Drones Market Value & Volume, 2023-2030 ($)
Figure 55 Colombia GDP and Population, 2023-2030 ($)
Figure 56 Colombia GDP – Composition of 2023, By Sector of Origin
Figure 57 Colombia Export and Import Value & Volume, 2023-2030 ($)
Figure 58 Costa Rica Small Drones MarketCosta Rica 3D Printing Market Value & Volume, 2023-2030 ($)
Figure 59 Costa Rica GDP and Population, 2023-2030 ($)
Figure 60 Costa Rica GDP – Composition of 2023, By Sector of Origin
Figure 61 Costa Rica Export and Import Value & Volume, 2023-2030 ($)
Figure 62 Europe Small Drones Market Value & Volume, 2023-2030 ($)
Figure 63 U.K Small Drones Market Value & Volume, 2023-2030 ($)
Figure 64 U.K GDP and Population, 2023-2030 ($)
Figure 65 U.K GDP – Composition of 2023, By Sector of Origin
Figure 66 U.K Export and Import Value & Volume, 2023-2030 ($)
Figure 67 Germany Small Drones Market Value & Volume, 2023-2030 ($)
Figure 68 Germany GDP and Population, 2023-2030 ($)
Figure 69 Germany GDP – Composition of 2023, By Sector of Origin
Figure 70 Germany Export and Import Value & Volume, 2023-2030 ($)
Figure 71 Italy Small Drones Market Value & Volume, 2023-2030 ($)
Figure 72 Italy GDP and Population, 2023-2030 ($)
Figure 73 Italy GDP – Composition of 2023, By Sector of Origin
Figure 74 Italy Export and Import Value & Volume, 2023-2030 ($)
Figure 75 France Small Drones Market Value & Volume, 2023-2030 ($)
Figure 76 France GDP and Population, 2023-2030 ($)
Figure 77 France GDP – Composition of 2023, By Sector of Origin
Figure 78 France Export and Import Value & Volume, 2023-2030 ($)
Figure 79 Netherlands Small Drones Market Value & Volume, 2023-2030 ($)
Figure 80 Netherlands GDP and Population, 2023-2030 ($)
Figure 81 Netherlands GDP – Composition of 2023, By Sector of Origin
Figure 82 Netherlands Export and Import Value & Volume, 2023-2030 ($)
Figure 83 Belgium Small Drones Market Value & Volume, 2023-2030 ($)
Figure 84 Belgium GDP and Population, 2023-2030 ($)
Figure 85 Belgium GDP – Composition of 2023, By Sector of Origin
Figure 86 Belgium Export and Import Value & Volume, 2023-2030 ($)
Figure 87 Spain Small Drones Market Value & Volume, 2023-2030 ($)
Figure 88 Spain GDP and Population, 2023-2030 ($)
Figure 89 Spain GDP – Composition of 2023, By Sector of Origin
Figure 90 Spain Export and Import Value & Volume, 2023-2030 ($)
Figure 91 Denmark Small Drones Market Value & Volume, 2023-2030 ($)
Figure 92 Denmark GDP and Population, 2023-2030 ($)
Figure 93 Denmark GDP – Composition of 2023, By Sector of Origin
Figure 94 Denmark Export and Import Value & Volume, 2023-2030 ($)
Figure 95 APAC Small Drones Market Value & Volume, 2023-2030 ($)
Figure 96 China Small Drones MarketValue & Volume, 2023-2030
Figure 97 China GDP and Population, 2023-2030 ($)
Figure 98 China GDP – Composition of 2023, By Sector of Origin
Figure 99 China Export and Import Value & Volume, 2023-2030 ($)Small Drones MarketChina Export and Import Value & Volume, 2023-2030 ($)
Figure 100 Australia Small Drones Market Value & Volume, 2023-2030 ($)
Figure 101 Australia GDP and Population, 2023-2030 ($)
Figure 102 Australia GDP – Composition of 2023, By Sector of Origin
Figure 103 Australia Export and Import Value & Volume, 2023-2030 ($)
Figure 104 South Korea Small Drones Market Value & Volume, 2023-2030 ($)
Figure 105 South Korea GDP and Population, 2023-2030 ($)
Figure 106 South Korea GDP – Composition of 2023, By Sector of Origin
Figure 107 South Korea Export and Import Value & Volume, 2023-2030 ($)
Figure 108 India Small Drones Market Value & Volume, 2023-2030 ($)
Figure 109 India GDP and Population, 2023-2030 ($)
Figure 110 India GDP – Composition of 2023, By Sector of Origin
Figure 111 India Export and Import Value & Volume, 2023-2030 ($)
Figure 112 Taiwan Small Drones MarketTaiwan 3D Printing Market Value & Volume, 2023-2030 ($)
Figure 113 Taiwan GDP and Population, 2023-2030 ($)
Figure 114 Taiwan GDP – Composition of 2023, By Sector of Origin
Figure 115 Taiwan Export and Import Value & Volume, 2023-2030 ($)
Figure 116 Malaysia Small Drones MarketMalaysia 3D Printing Market Value & Volume, 2023-2030 ($)
Figure 117 Malaysia GDP and Population, 2023-2030 ($)
Figure 118 Malaysia GDP – Composition of 2023, By Sector of Origin
Figure 119 Malaysia Export and Import Value & Volume, 2023-2030 ($)
Figure 120 Hong Kong Small Drones MarketHong Kong 3D Printing Market Value & Volume, 2023-2030 ($)
Figure 121 Hong Kong GDP and Population, 2023-2030 ($)
Figure 122 Hong Kong GDP – Composition of 2023, By Sector of Origin
Figure 123 Hong Kong Export and Import Value & Volume, 2023-2030 ($)
Figure 124 Middle East & Africa Small Drones MarketMiddle East & Africa 3D Printing Market Value & Volume, 2023-2030 ($)
Figure 125 Russia Small Drones MarketRussia 3D Printing Market Value & Volume, 2023-2030 ($)
Figure 126 Russia GDP and Population, 2023-2030 ($)
Figure 127 Russia GDP – Composition of 2023, By Sector of Origin
Figure 128 Russia Export and Import Value & Volume, 2023-2030 ($)
Figure 129 Israel Small Drones Market Value & Volume, 2023-2030 ($)
Figure 130 Israel GDP and Population, 2023-2030 ($)
Figure 131 Israel GDP – Composition of 2023, By Sector of Origin
Figure 132 Israel Export and Import Value & Volume, 2023-2030 ($)
Figure 133 Entropy Share, By Strategies, 2023-2030* (%)Small Drones Market
Figure 134 Developments, 2023-2030*Small Drones Market
Figure 135 Company 1 Small Drones Market Net Revenue, By Years, 2023-2030* ($)
Figure 136 Company 1 Small Drones Market Net Revenue Share, By Business segments, 2023 (%)
Figure 137 Company 1 Small Drones Market Net Sales Share, By Geography, 2023 (%)
Figure 138 Company 2 Small Drones Market Net Revenue, By Years, 2023-2030* ($)
Figure 139 Company 2 Small Drones Market Net Revenue Share, By Business segments, 2023 (%)
Figure 140 Company 2 Small Drones Market Net Sales Share, By Geography, 2023 (%)
Figure 141 Company 3Small Drones Market Net Revenue, By Years, 2023-2030* ($)
Figure 142 Company 3Small Drones Market Net Revenue Share, By Business segments, 2023 (%)
Figure 143 Company 3Small Drones Market Net Sales Share, By Geography, 2023 (%)
Figure 144 Company 4 Small Drones Market Net Revenue, By Years, 2023-2030* ($)
Figure 145 Company 4 Small Drones Market Net Revenue Share, By Business segments, 2023 (%)
Figure 146 Company 4 Small Drones Market Net Sales Share, By Geography, 2023 (%)
Figure 147 Company 5 Small Drones Market Net Revenue, By Years, 2023-2030* ($)
Figure 148 Company 5 Small Drones Market Net Revenue Share, By Business segments, 2023 (%)
Figure 149 Company 5 Small Drones Market Net Sales Share, By Geography, 2023 (%)
Figure 150 Company 6 Small Drones Market Net Revenue, By Years, 2023-2030* ($)
Figure 151 Company 6 Small Drones Market Net Revenue Share, By Business segments, 2023 (%)
Figure 152 Company 6 Small Drones Market Net Sales Share, By Geography, 2023 (%)
Figure 153 Company 7 Small Drones Market Net Revenue, By Years, 2023-2030* ($)
Figure 154 Company 7 Small Drones Market Net Revenue Share, By Business segments, 2023 (%)
Figure 155 Company 7 Small Drones Market Net Sales Share, By Geography, 2023 (%)
Figure 156 Company 8 Small Drones Market Net Revenue, By Years, 2023-2030* ($)
Figure 157 Company 8 Small Drones Market Net Revenue Share, By Business segments, 2023 (%)
Figure 158 Company 8 Small Drones Market Net Sales Share, By Geography, 2023 (%)
Figure 159 Company 9 Small Drones Market Net Revenue, By Years, 2023-2030* ($)
Figure 160 Company 9 Small Drones Market Net Revenue Share, By Business segments, 2023 (%)
Figure 161 Company 9 Small Drones Market Net Sales Share, By Geography, 2023 (%)
Figure 162 Company 10 Small Drones Market Net Revenue, By Years, 2023-2030* ($)
Figure 163 Company 10 Small Drones Market Net Revenue Share, By Business segments, 2023 (%)
Figure 164 Company 10 Small Drones Market Net Sales Share, By Geography, 2023 (%)
Figure 165 Company 11 Small Drones Market Net Revenue, By Years, 2023-2030* ($)
Figure 166 Company 11 Small Drones Market Net Revenue Share, By Business segments, 2023 (%)
Figure 167 Company 11 Small Drones Market Net Sales Share, By Geography, 2023 (%)
Figure 168 Company 12 Small Drones Market Net Revenue, By Years, 2023-2030* ($)
Figure 169 Company 12 Small Drones Market Net Revenue Share, By Business segments, 2023 (%)
Figure 170 Company 12 Small Drones Market Net Sales Share, By Geography, 2023 (%)
Figure 171 Company 13Small Drones Market Net Revenue, By Years, 2023-2030* ($)
Figure 172 Company 13Small Drones Market Net Revenue Share, By Business segments, 2023 (%)
Figure 173 Company 13Small Drones Market Net Sales Share, By Geography, 2023 (%)
Figure 174 Company 14 Small Drones Market Net Revenue, By Years, 2023-2030* ($)
Figure 175 Company 14 Small Drones Market Net Revenue Share, By Business segments, 2023 (%)
Figure 176 Company 14 Small Drones Market Net Sales Share, By Geography, 2023 (%)
Figure 177 Company 15 Small Drones Market Net Revenue, By Years, 2023-2030* ($)
Figure 178 Company 15 Small Drones Market Net Revenue Share, By Business segments, 2023 (%)
Figure 179 Company 15 Small Drones Market Net Sales Share, By Geography, 2023 (%)