 Email
Email Print
Print


Fragrance Ingredients Market - Forecast(2025 - 2031)
Fragrance is an amalgamation of chemicals that gives cologne as its distinct aroma. These ingredients may be derived from petroleum or natural raw materials. The Fragrance ingredients market is segmented on the basis of raw-materials, applications and geography. Based on raw-material types these fragments are divided into categories such as essential oils, aroma chemicals, herbal distillates and others. Fragrances are gaining significance in the market with the increase in demand for personal care and other consumer products. Increasing health concerns has also concerning the growth of the fragrance market. Consumers are becoming conscious of the potential health risks such as skin problems, allergies and hence, the consumption of fragrances with natural ingredients is increasing.
The demand for fragrance ingredients is growing at a faster pace due to its benefits in end use applications such as personal care and consumer care. Consumer Care is one of the largest applications for fragrance ingredients market. APAC is considered as the major consumer of fragrance ingredients. A detailed qualitative analysis of the factors responsible for driving and restraining growth of the fragrance ingredients market and future opportunities are provided in the report.
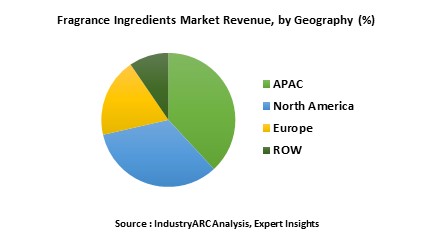
The global market for fragrance ingredients was estimated to be $XX billion in 2015. The global market for fragrance ingredients market is estimated to grow at a CAGR of XX% and is forecast to reach $XX billion by 2021. Fragrance ingredients are forecast to have the highest growth of XX% during the forecast period 2016-2021. North America and APAC alone are estimated to occupy a share of more than XX% during 2016. Brazil, China, India, Mexico are some of the major producers of fragrance ingredients.
A detailed qualitative analysis of the factors responsible for driving and restraining growth of the fragrance ingredients market and future opportunities are provided in the report.
The demand for fragrance ingredients is growing at a faster pace due to its benefits in end use applications such as personal care and consumer care. Consumer Care is one of the largest applications for fragrance ingredients market. APAC is considered as the major consumer of fragrance ingredients. A detailed qualitative analysis of the factors responsible for driving and restraining growth of the fragrance ingredients market and future opportunities are provided in the report.
The global market for fragrance ingredients was estimated to be $XX billion in 2015. The global market for fragrance ingredients market is estimated to grow at a CAGR of XX% and is forecast to reach $XX billion by 2021. Fragrance ingredients are forecast to have the highest growth of XX% during the forecast period 2016-2021. North America and APAC alone are estimated to occupy a share of more than XX% during 2016. Brazil, China, India, Mexico are some of the major producers of fragrance ingredients.
A detailed qualitative analysis of the factors responsible for driving and restraining growth of the fragrance ingredients market and future opportunities are provided in the report.
1. Market Overview
2. Executive Summary
3. Fragrance Ingredients Landscape
3.1. Introduction
3.2. Market Share Analysis
3.3. Competitive Analysis
3.3.1. Product Benchmarking
3.3.2. End User Profiling
3.3.3. Top 5 Financials Analysis
4. Fragrance Ingredients Market Forces
4.1. Market Drivers
4.2. Market Constraints & Challenges
4.3. Attractiveness Of The Fragrance Ingredients Market
4.3.1. Power Of Suppliers
4.3.2. Threats From New Entrants
4.3.3. Power Of Buyer
4.3.4. Threat From Substitute Product
4.3.5. Degree Of Competition
5. Fragrance Ingredients Market-Strategic Analysis
5.1. Value Chain Analysis
5.2. Pricing Analysis
5.3. Opportunity Analysis
5.4. Product Life Cycle
5.5. Suppliers And Distributors
6. Fragrance Ingredients-By Raw-Materials Types
6.1. Introduction
6.1.1. Essential Oils
6.1.2. Aroma Chemicals
6.1.3. Herbal distillates
6.1.4. Others
7. Fragrance Ingredients -By Applications
7.1. Introduction
7.2. Personal Care
7.3. Consumer Care
7.4. Others
8. Fragrance Ingredients - By Geography
8.1. North America
8.1.1. U.S.
8.1.2. Canada
8.1.3. Mexico
8.1.4. Brazil
8.2. Europe
8.2.1. U.K.
8.2.2. Germany
8.2.3. Italy
8.2.4. Spain
8.2.5. France
8.2.6. Poland
8.3. APAC
8.3.1. China
8.3.2. Japan
8.3.3. India
8.4. Rest of The World (ROW)
9. Fragrance Ingredients Market Entropy
9.1. New Product Developments
9.2. Mergers and Acquisitions
10. Company profiles
10.1. A & E Connock Ltd
10.2. A. Fakhry & Company
10.3. Bare Organics Inc.
10.4. BASF SE
10.5. Bell Flavors & Fragrances
10.6. Albert Vieille SA
10.7. Alchemilla
10.8. Alexami Cosmetics
10.9. Alfa Chem
10.10. Graham Chemical Corporation
10.11. Innospec Inc
10.12. Kao Corporation
10.13. Organica Aromatics Pvt Ltd
10.14. Rhodia Organics
*More than 10 Companies are profiled in this Research Report*
"*Financials would be provided on a best efforts basis for private companies"
"*Financials would be provided on a best efforts basis for private companies"
11. Appendix
11.1. Abbreviations
11.2. Sources
11.3. Research Methodology
11.4. Bibliography
11.5. Compilation of Expert Insights
11.6. Disclaimer
11.1. Abbreviations
11.2. Sources
11.3. Research Methodology
11.4. Bibliography
11.5. Compilation of Expert Insights
11.6. Disclaimer
List of Tables:
Table 1: Fragrance Ingredients Market Overview 2023-2030
Table 2: Fragrance Ingredients Market Leader Analysis 2023-2030 (US$)
Table 3: Fragrance Ingredients Market Product Analysis 2023-2030 (US$)
Table 4: Fragrance Ingredients Market End User Analysis 2023-2030 (US$)
Table 5: Fragrance Ingredients Market Patent Analysis 2013-2023* (US$)
Table 6: Fragrance Ingredients Market Financial Analysis 2023-2030 (US$)
Table 7: Fragrance Ingredients Market Driver Analysis 2023-2030 (US$)
Table 8: Fragrance Ingredients Market Challenges Analysis 2023-2030 (US$)
Table 9: Fragrance Ingredients Market Constraint Analysis 2023-2030 (US$)
Table 10: Fragrance Ingredients Market Supplier Bargaining Power Analysis 2023-2030 (US$)
Table 11: Fragrance Ingredients Market Buyer Bargaining Power Analysis 2023-2030 (US$)
Table 12: Fragrance Ingredients Market Threat of Substitutes Analysis 2023-2030 (US$)
Table 13: Fragrance Ingredients Market Threat of New Entrants Analysis 2023-2030 (US$)
Table 14: Fragrance Ingredients Market Degree of Competition Analysis 2023-2030 (US$)
Table 15: Fragrance Ingredients Market Value Chain Analysis 2023-2030 (US$)
Table 16: Fragrance Ingredients Market Pricing Analysis 2023-2030 (US$)
Table 17: Fragrance Ingredients Market Opportunities Analysis 2023-2030 (US$)
Table 18: Fragrance Ingredients Market Product Life Cycle Analysis 2023-2030 (US$)
Table 19: Fragrance Ingredients Market Supplier Analysis 2023-2030 (US$)
Table 20: Fragrance Ingredients Market Distributor Analysis 2023-2030 (US$)
Table 21: Fragrance Ingredients Market Trend Analysis 2023-2030 (US$)
Table 22: Fragrance Ingredients Market Size 2023 (US$)
Table 23: Fragrance Ingredients Market Forecast Analysis 2023-2030 (US$)
Table 24: Fragrance Ingredients Market Sales Forecast Analysis 2023-2030 (Units)
Table 25: Fragrance Ingredients Market, Revenue & Volume, By Application, 2023-2030 ($)
Table 26: Fragrance Ingredients Market By Application, Revenue & Volume, By Personal Care, 2023-2030 ($)
Table 27: Fragrance Ingredients Market By Application, Revenue & Volume, By Consumer Care, 2023-2030 ($)
Table 28: North America Fragrance Ingredients Market, Revenue & Volume, By Application, 2023-2030 ($)
Table 29: South america Fragrance Ingredients Market, Revenue & Volume, By Application, 2023-2030 ($)
Table 30: Europe Fragrance Ingredients Market, Revenue & Volume, By Application, 2023-2030 ($)
Table 31: APAC Fragrance Ingredients Market, Revenue & Volume, By Application, 2023-2030 ($)
Table 32: Middle East & Africa Fragrance Ingredients Market, Revenue & Volume, By Application, 2023-2030 ($)
Table 33: Russia Fragrance Ingredients Market, Revenue & Volume, By Application, 2023-2030 ($)
Table 34: Israel Fragrance Ingredients Market, Revenue & Volume, By Application, 2023-2030 ($)
Table 35: Top Companies 2023 (US$) Fragrance Ingredients Market, Revenue & Volume
Table 36: Product Launch 2023-2030 Fragrance Ingredients Market, Revenue & Volume
Table 37: Mergers & Acquistions 2023-2030 Fragrance Ingredients Market, Revenue & Volume
List of Figures:
Figure 1: Overview of Fragrance Ingredients Market 2023-2030
Figure 2: Market Share Analysis for Fragrance Ingredients Market 2023 (US$)
Figure 3: Product Comparison in Fragrance Ingredients Market 2023-2030 (US$)
Figure 4: End User Profile for Fragrance Ingredients Market 2023-2030 (US$)
Figure 5: Patent Application and Grant in Fragrance Ingredients Market 2013-2023* (US$)
Figure 6: Top 5 Companies Financial Analysis in Fragrance Ingredients Market 2023-2030 (US$)
Figure 7: Market Entry Strategy in Fragrance Ingredients Market 2023-2030
Figure 8: Ecosystem Analysis in Fragrance Ingredients Market 2023
Figure 9: Average Selling Price in Fragrance Ingredients Market 2023-2030
Figure 10: Top Opportunites in Fragrance Ingredients Market 2023-2030
Figure 11: Market Life Cycle Analysis in Fragrance Ingredients Market
Figure 12: GlobalBy Application Fragrance Ingredients Market Revenue, 2023-2030 ($)
Figure 13: Global Fragrance Ingredients Market - By Geography
Figure 14: Global Fragrance Ingredients Market Value & Volume, By Geography, 2023-2030 ($)
Figure 15: Global Fragrance Ingredients Market CAGR, By Geography, 2023-2030 (%)
Figure 16: North America Fragrance Ingredients Market Value & Volume, 2023-2030 ($)
Figure 17: US Fragrance Ingredients Market Value & Volume, 2023-2030 ($)
Figure 18: US GDP and Population, 2023-2030 ($)
Figure 19: US GDP – Composition of 2023, By Sector of Origin
Figure 20: US Export and Import Value & Volume, 2023-2030 ($)
Figure 21: Canada Fragrance Ingredients Market Value & Volume, 2023-2030 ($)
Figure 22: Canada GDP and Population, 2023-2030 ($)
Figure 23: Canada GDP – Composition of 2023, By Sector of Origin
Figure 24: Canada Export and Import Value & Volume, 2023-2030 ($)
Figure 25: Mexico Fragrance Ingredients Market Value & Volume, 2023-2030 ($)
Figure 26: Mexico GDP and Population, 2023-2030 ($)
Figure 27: Mexico GDP – Composition of 2023, By Sector of Origin
Figure 28: Mexico Export and Import Value & Volume, 2023-2030 ($)
Figure 29: South America Fragrance Ingredients Market Value & Volume, 2023-2030 ($)
Figure 30: Brazil Fragrance Ingredients Market Value & Volume, 2023-2030 ($)
Figure 31: Brazil GDP and Population, 2023-2030 ($)
Figure 32: Brazil GDP – Composition of 2023, By Sector of Origin
Figure 33: Brazil Export and Import Value & Volume, 2023-2030 ($)
Figure 34: Venezuela Fragrance Ingredients Market Value & Volume, 2023-2030 ($)
Figure 35: Venezuela GDP and Population, 2023-2030 ($)
Figure 36: Venezuela GDP – Composition of 2023, By Sector of Origin
Figure 37: Venezuela Export and Import Value & Volume, 2023-2030 ($)
Figure 38: Argentina Fragrance Ingredients Market Value & Volume, 2023-2030 ($)
Figure 39: Argentina GDP and Population, 2023-2030 ($)
Figure 40: Argentina GDP – Composition of 2023, By Sector of Origin
Figure 41: Argentina Export and Import Value & Volume, 2023-2030 ($)
Figure 42: Ecuador Fragrance Ingredients Market Value & Volume, 2023-2030 ($)
Figure 43: Ecuador GDP and Population, 2023-2030 ($)
Figure 44: Ecuador GDP – Composition of 2023, By Sector of Origin
Figure 45: Ecuador Export and Import Value & Volume, 2023-2030 ($)
Figure 46: Peru Fragrance Ingredients Market Value & Volume, 2023-2030 ($)
Figure 47: Peru GDP and Population, 2023-2030 ($)
Figure 48: Peru GDP – Composition of 2023, By Sector of Origin
Figure 49: Peru Export and Import Value & Volume, 2023-2030 ($)
Figure 50: Colombia Fragrance Ingredients Market Value & Volume, 2023-2030 ($)
Figure 51: Colombia GDP and Population, 2023-2030 ($)
Figure 52: Colombia GDP – Composition of 2023, By Sector of Origin
Figure 53: Colombia Export and Import Value & Volume, 2023-2030 ($)
Figure 54: Costa Rica Fragrance Ingredients Market Value & Volume, 2023-2030 ($)
Figure 55: Costa Rica GDP and Population, 2023-2030 ($)
Figure 56: Costa Rica GDP – Composition of 2023, By Sector of Origin
Figure 57: Costa Rica Export and Import Value & Volume, 2023-2030 ($)
Figure 58: Europe Fragrance Ingredients Market Value & Volume, 2023-2030 ($)
Figure 59: U.K Fragrance Ingredients Market Value & Volume, 2023-2030 ($)
Figure 60: U.K GDP and Population, 2023-2030 ($)
Figure 61: U.K GDP – Composition of 2023, By Sector of Origin
Figure 62: U.K Export and Import Value & Volume, 2023-2030 ($)
Figure 63: Germany Fragrance Ingredients Market Value & Volume, 2023-2030 ($)
Figure 64: Germany GDP and Population, 2023-2030 ($)
Figure 65: Germany GDP – Composition of 2023, By Sector of Origin
Figure 66: Germany Export and Import Value & Volume, 2023-2030 ($)
Figure 67: Italy Fragrance Ingredients Market Value & Volume, 2023-2030 ($)
Figure 68: Italy GDP and Population, 2023-2030 ($)
Figure 69: Italy GDP – Composition of 2023, By Sector of Origin
Figure 70: Italy Export and Import Value & Volume, 2023-2030 ($)
Figure 71: France Fragrance Ingredients Market Value & Volume, 2023-2030 ($)
Figure 72: France GDP and Population, 2023-2030 ($)
Figure 73: France GDP – Composition of 2023, By Sector of Origin
Figure 74: France Export and Import Value & Volume, 2023-2030 ($)
Figure 75: Netherlands Fragrance Ingredients Market Value & Volume, 2023-2030 ($)
Figure 76: Netherlands GDP and Population, 2023-2030 ($)
Figure 77: Netherlands GDP – Composition of 2023, By Sector of Origin
Figure 78: Netherlands Export and Import Value & Volume, 2023-2030 ($)
Figure 79: Belgium Fragrance Ingredients Market Value & Volume, 2023-2030 ($)
Figure 80: Belgium GDP and Population, 2023-2030 ($)
Figure 81: Belgium GDP – Composition of 2023, By Sector of Origin
Figure 82: Belgium Export and Import Value & Volume, 2023-2030 ($)
Figure 83: Spain Fragrance Ingredients Market Value & Volume, 2023-2030 ($)
Figure 84: Spain GDP and Population, 2023-2030 ($)
Figure 85: Spain GDP – Composition of 2023, By Sector of Origin
Figure 86: Spain Export and Import Value & Volume, 2023-2030 ($)
Figure 87: Denmark Fragrance Ingredients Market Value & Volume, 2023-2030 ($)
Figure 88: Denmark GDP and Population, 2023-2030 ($)
Figure 89: Denmark GDP – Composition of 2023, By Sector of Origin
Figure 90: Denmark Export and Import Value & Volume, 2023-2030 ($)
Figure 91: APAC Fragrance Ingredients Market Value & Volume, 2023-2030 ($)
Figure 92: China Fragrance Ingredients Market Value & Volume, 2023-2030
Figure 93: China GDP and Population, 2023-2030 ($)
Figure 94: China GDP – Composition of 2023, By Sector of Origin
Figure 95: China Export and Import Value & Volume, 2023-2030 ($) Fragrance Ingredients Market China Export and Import Value & Volume, 2023-2030 ($)
Figure 96: Australia Fragrance Ingredients Market Value & Volume, 2023-2030 ($)
Figure 97: Australia GDP and Population, 2023-2030 ($)
Figure 98: Australia GDP – Composition of 2023, By Sector of Origin
Figure 99: Australia Export and Import Value & Volume, 2023-2030 ($)
Figure 100: South Korea Fragrance Ingredients Market Value & Volume, 2023-2030 ($)
Figure 101: South Korea GDP and Population, 2023-2030 ($)
Figure 102: South Korea GDP – Composition of 2023, By Sector of Origin
Figure 103: South Korea Export and Import Value & Volume, 2023-2030 ($)
Figure 104: India Fragrance Ingredients Market Value & Volume, 2023-2030 ($)
Figure 105: India GDP and Population, 2023-2030 ($)
Figure 106: India GDP – Composition of 2023, By Sector of Origin
Figure 107: India Export and Import Value & Volume, 2023-2030 ($)
Figure 108: Taiwan Fragrance Ingredients Market Value & Volume, 2023-2030 ($)
Figure 109: Taiwan GDP and Population, 2023-2030 ($)
Figure 110: Taiwan GDP – Composition of 2023, By Sector of Origin
Figure 111: Taiwan Export and Import Value & Volume, 2023-2030 ($)
Figure 112: Malaysia Fragrance Ingredients Market Value & Volume, 2023-2030 ($)
Figure 113: Malaysia GDP and Population, 2023-2030 ($)
Figure 114: Malaysia GDP – Composition of 2023, By Sector of Origin
Figure 115: Malaysia Export and Import Value & Volume, 2023-2030 ($)
Figure 116: Hong Kong Fragrance Ingredients Market Value & Volume, 2023-2030 ($)
Figure 117: Hong Kong GDP and Population, 2023-2030 ($)
Figure 118: Hong Kong GDP – Composition of 2023, By Sector of Origin
Figure 119: Hong Kong Export and Import Value & Volume, 2023-2030 ($)
Figure 120: Middle East & Africa Fragrance Ingredients Market Middle East & Africa 3D Printing Market Value & Volume, 2023-2030 ($)
Figure 121: Russia Fragrance Ingredients Market Value & Volume, 2023-2030 ($)
Figure 122: Russia GDP and Population, 2023-2030 ($)
Figure 123: Russia GDP – Composition of 2023, By Sector of Origin
Figure 124: Russia Export and Import Value & Volume, 2023-2030 ($)
Figure 125: Israel Fragrance Ingredients Market Value & Volume, 2023-2030 ($)
Figure 126: Israel GDP and Population, 2023-2030 ($)
Figure 127: Israel GDP – Composition of 2023, By Sector of Origin
Figure 128: Israel Export and Import Value & Volume, 2023-2030 ($)
Figure 129: Entropy Share, By Strategies, 2023-2030* (%) Fragrance Ingredients Market
Figure 130: Developments, 2023-2030* Fragrance Ingredients Market
Figure 131: Company 1 Fragrance Ingredients Market Net Revenue, By Years, 2023-2030* ($)
Figure 132: Company 1 Fragrance Ingredients Market Net Revenue Share, By Business segments, 2023 (%)
Figure 133: Company 1 Fragrance Ingredients Market Net Sales Share, By Geography, 2023 (%)
Figure 134: Company 2 Fragrance Ingredients Market Net Revenue, By Years, 2023-2030* ($)
Figure 135: Company 2 Fragrance Ingredients Market Net Revenue Share, By Business segments, 2023 (%)
Figure 136: Company 2 Fragrance Ingredients Market Net Sales Share, By Geography, 2023 (%)
Figure 137: Company 3 Fragrance Ingredients Market Net Revenue, By Years, 2023-2030* ($)
Figure 138: Company 3 Fragrance Ingredients Market Net Revenue Share, By Business segments, 2023 (%)
Figure 139: Company 3 Fragrance Ingredients Market Net Sales Share, By Geography, 2023 (%)
Figure 140: Company 4 Fragrance Ingredients Market Net Revenue, By Years, 2023-2030* ($)
Figure 141: Company 4 Fragrance Ingredients Market Net Revenue Share, By Business segments, 2023 (%)
Figure 142: Company 4 Fragrance Ingredients Market Net Sales Share, By Geography, 2023 (%)
Figure 143: Company 5 Fragrance Ingredients Market Net Revenue, By Years, 2023-2030* ($)
Figure 144: Company 5 Fragrance Ingredients Market Net Revenue Share, By Business segments, 2023 (%)
Figure 145: Company 5 Fragrance Ingredients Market Net Sales Share, By Geography, 2023 (%)
Figure 146: Company 6 Fragrance Ingredients Market Net Revenue, By Years, 2023-2030* ($)
Figure 147: Company 6 Fragrance Ingredients Market Net Revenue Share, By Business segments, 2023 (%)
Figure 148: Company 6 Fragrance Ingredients Market Net Sales Share, By Geography, 2023 (%)
Figure 149: Company 7 Fragrance Ingredients Market Net Revenue, By Years, 2023-2030* ($)
Figure 150: Company 7 Fragrance Ingredients Market Net Revenue Share, By Business segments, 2023 (%)
Figure 151: Company 7 Fragrance Ingredients Market Net Sales Share, By Geography, 2023 (%)
Figure 152: Company 8 Fragrance Ingredients Market Net Revenue, By Years, 2023-2030* ($)
Figure 153: Company 8 Fragrance Ingredients Market Net Revenue Share, By Business segments, 2023 (%)
Figure 154: Company 8 Fragrance Ingredients Market Net Sales Share, By Geography, 2023 (%)
Figure 155: Company 9 Fragrance Ingredients Market Net Revenue, By Years, 2023-2030* ($)
Figure 156: Company 9 Fragrance Ingredients Market Net Revenue Share, By Business segments, 2023 (%)
Figure 157: Company 9 Fragrance Ingredients Market Net Sales Share, By Geography, 2023 (%)
Figure 158: Company 10 Fragrance Ingredients Market Net Revenue, By Years, 2023-2030* ($)
Figure 159: Company 10 Fragrance Ingredients Market Net Revenue Share, By Business segments, 2023 (%)
Figure 160: Company 10 Fragrance Ingredients Market Net Sales Share, By Geography, 2023 (%)
Figure 161: Company 11 Fragrance Ingredients Market Net Revenue, By Years, 2023-2030* ($)
Figure 162: Company 11 Fragrance Ingredients Market Net Revenue Share, By Business segments, 2023 (%)
Figure 163: Company 11 Fragrance Ingredients Market Net Sales Share, By Geography, 2023 (%)
Figure 164: Company 12 Fragrance Ingredients Market Net Revenue, By Years, 2023-2030* ($)
Figure 165: Company 12 Fragrance Ingredients Market Net Revenue Share, By Business segments, 2023 (%)
Figure 166: Company 12 Fragrance Ingredients Market Net Sales Share, By Geography, 2023 (%)
Figure 167: Company 13 Fragrance Ingredients Market Net Revenue, By Years, 2023-2030* ($)
Figure 168: Company 13 Fragrance Ingredients Market Net Revenue Share, By Business segments, 2023 (%)
Figure 169: Company 13 Fragrance Ingredients Market Net Sales Share, By Geography, 2023 (%)
Figure 170: Company 14 Fragrance Ingredients Market Net Revenue, By Years, 2023-2030* ($)
Figure 171: Company 14 Fragrance Ingredients Market Net Revenue Share, By Business segments, 2023 (%)
Figure 172: Company 14 Fragrance Ingredients Market Net Sales Share, By Geography, 2023 (%)
Figure 173: Company 15 Fragrance Ingredients Market Net Revenue, By Years, 2023-2030* ($)
Figure 174: Company 15 Fragrance Ingredients Market Net Revenue Share, By Business segments, 2023 (%)
Figure 175: Company 15 Fragrance Ingredients Market Net Sales Share, By Geography, 2023 (%)