 Email
Email Print
Print


Construction Adhesive Market - Forecast(2025 - 2031)
Construction Adhesive Market Size is forecast to reach $14887 Million by 2030, at a CAGR of 5% during forecast period 2024-2030.Adhesives are a chemical formulation which is used to adhere the materials which range from basic household materials to construction materials. These are the substances used to embrace two surfaces together strongly for long duration. It is cautiously formulated blend of synthetic rubber and resins, inorganic fillers, coloring and preservative compounds borne in a specially selected blend of organic solvents designed to be compatible with and bond strongly to most common building materials. Construction adhesive is used in various applications such as bonding plywood, particle board, hardboard, decorative laminates, metals, concrete and others. The construction adhesives are broadly divided into resin types such as acrylic, epoxies, polyurethanes, silicones, phenolics, polyvinyl acetate and others. Polyurethane based adhesives can set solid and relatively fixed, or can remain rubbery and bendable.
Owing to benefits such as it can be used on wood, metals, rubbers, cured epoxy, leather, tile and glass, many plastics, concrete and brick, the list goes on. It does not work on polypropylene, polyethylene or on such substances as Teflon or silicone. Nor does it like waxy or oily surfaces.
The global market for construction adhesives was estimated to be $XX billion in 2015 and is estimated to grow at a CAGR of XX% and is forecast to reach $XX billion by 2021. The construction adhesives are forecast to have the highest growth of X% during the forecast period 2024-2030. Construction and chemical industries are the major end-users for construction adhesives.
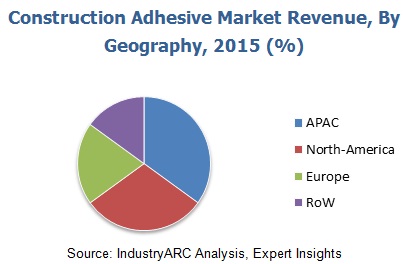
Asia-Pacific (APAC) is the leading market for construction adhesives and is forecast to have highest growth in the next few years due to growing adoption of construction adhesives in industrial applications. North America construction adhesive market accounts to XX% of the global market for construction adhesives and is the fastest growing market followed by Europe.
- Acoustical Surfaces, Inc.
- Dow Corning Corp.
- Polymeric Systems, Inc.
- Green Glue Co
- Kenneth Crosby
Key Market Players:
The Top 5 companies in the Construction Adhesive Market are:
- Acoustical Surfaces, Inc.
- Dow Corning Corp.
- Green Glue Co
- 3M
- HB Fuller
List of Tables
Table1 Construction Adhesive Market Overview 2023-2030
Table2 Construction Adhesive Market Leader Analysis 2023-2030 (US$)
Table3 Construction Adhesive MarketProduct Analysis 2023-2030 (US$)
Table4 Construction Adhesive MarketEnd User Analysis 2023-2030 (US$)
Table5 Construction Adhesive MarketPatent Analysis 2013-2023* (US$)
Table6 Construction Adhesive MarketFinancial Analysis 2023-2030 (US$)
Table7 Construction Adhesive Market Driver Analysis 2023-2030 (US$)
Table8 Construction Adhesive MarketChallenges Analysis 2023-2030 (US$)
Table9 Construction Adhesive MarketConstraint Analysis 2023-2030 (US$)
Table10 Construction Adhesive Market Supplier Bargaining Power Analysis 2023-2030 (US$)
Table11 Construction Adhesive Market Buyer Bargaining Power Analysis 2023-2030 (US$)
Table12 Construction Adhesive Market Threat of Substitutes Analysis 2023-2030 (US$)
Table13 Construction Adhesive Market Threat of New Entrants Analysis 2023-2030 (US$)
Table14 Construction Adhesive Market Degree of Competition Analysis 2023-2030 (US$)
Table15 Construction Adhesive MarketValue Chain Analysis 2023-2030 (US$)
Table16 Construction Adhesive MarketPricing Analysis 2023-2030 (US$)
Table17 Construction Adhesive MarketOpportunities Analysis 2023-2030 (US$)
Table18 Construction Adhesive MarketProduct Life Cycle Analysis 2023-2030 (US$)
Table19 Construction Adhesive MarketSupplier Analysis 2023-2030 (US$)
Table20 Construction Adhesive MarketDistributor Analysis 2023-2030 (US$)
Table21 Construction Adhesive Market Trend Analysis 2023-2030 (US$)
Table22 Construction Adhesive Market Size 2023 (US$)
Table23 Construction Adhesive Market Forecast Analysis 2023-2030 (US$)
Table24 Construction Adhesive Market Sales Forecast Analysis 2023-2030 (Units)
Table25 Construction Adhesive Market, Revenue & Volume,By Type, 2023-2030 ($)
Table26 Construction Adhesive MarketBy Type, Revenue & Volume,Acrylic, 2023-2030 ($)
Table27 Construction Adhesive MarketBy Type, Revenue & Volume,Epoxies, 2023-2030 ($)
Table28 Construction Adhesive MarketBy Type, Revenue & Volume,Polyurethanes, 2023-2030 ($)
Table29 Construction Adhesive MarketBy Type, Revenue & Volume,Silicones, 2023-2030 ($)
Table30 Construction Adhesive MarketBy Type, Revenue & Volume,Phenolics, 2023-2030 ($)
Table31 Construction Adhesive Market, Revenue & Volume,By Application, 2023-2030 ($)
Table32 Construction Adhesive MarketBy Application, Revenue & Volume,Introduction, 2023-2030 ($)
Table33 Construction Adhesive MarketBy Application, Revenue & Volume,Residential and Commercial Building , 2023-2030 ($)
Table34 Construction Adhesive MarketBy Application, Revenue & Volume,Civil Engineering, 2023-2030 ($)
Table35 Construction Adhesive MarketBy Application, Revenue & Volume,Glazing Systems, 2023-2030 ($)
Table36 North America Construction Adhesive Market, Revenue & Volume,By Type, 2023-2030 ($)
Table37 North America Construction Adhesive Market, Revenue & Volume,By Application, 2023-2030 ($)
Table38 South america Construction Adhesive Market, Revenue & Volume,By Type, 2023-2030 ($)
Table39 South america Construction Adhesive Market, Revenue & Volume,By Application, 2023-2030 ($)
Table40 Europe Construction Adhesive Market, Revenue & Volume,By Type, 2023-2030 ($)
Table41 Europe Construction Adhesive Market, Revenue & Volume,By Application, 2023-2030 ($)
Table42 APAC Construction Adhesive Market, Revenue & Volume,By Type, 2023-2030 ($)
Table43 APAC Construction Adhesive Market, Revenue & Volume,By Application, 2023-2030 ($)
Table44 Middle East & Africa Construction Adhesive Market, Revenue & Volume,By Type, 2023-2030 ($)
Table45 Middle East & Africa Construction Adhesive Market, Revenue & Volume,By Application, 2023-2030 ($)
Table46 Russia Construction Adhesive Market, Revenue & Volume,By Type, 2023-2030 ($)
Table47 Russia Construction Adhesive Market, Revenue & Volume,By Application, 2023-2030 ($)
Table48 Israel Construction Adhesive Market, Revenue & Volume,By Type, 2023-2030 ($)
Table49 Israel Construction Adhesive Market, Revenue & Volume,By Application, 2023-2030 ($)
Table50 Top Companies 2023 (US$)Construction Adhesive Market, Revenue & Volume,,
Table51 Product Launch 2023-2030Construction Adhesive Market, Revenue & Volume,,
Table52 Mergers & Acquistions 2023-2030Construction Adhesive Market, Revenue & Volume,,
List of Figures
Figure 1 Overview of Construction Adhesive Market 2023-2030
Figure 2 Market Share Analysis for Construction Adhesive Market 2023 (US$)
Figure 3 Product Comparison in Construction Adhesive Market 2023-2030 (US$)
Figure 4 End User Profile for Construction Adhesive Market 2023-2030 (US$)
Figure 5 Patent Application and Grant in Construction Adhesive Market 2013-2023* (US$)
Figure 6 Top 5 Companies Financial Analysis in Construction Adhesive Market 2023-2030 (US$)
Figure 7 Market Entry Strategy in Construction Adhesive Market 2023-2030
Figure 8 Ecosystem Analysis in Construction Adhesive Market2023
Figure 9 Average Selling Price in Construction Adhesive Market 2023-2030
Figure 10 Top Opportunites in Construction Adhesive Market 2023-2030
Figure 11 Market Life Cycle Analysis in Construction Adhesive Market
Figure 12 GlobalBy TypeConstruction Adhesive Market Revenue, 2023-2030 ($)
Figure 13 GlobalBy ApplicationConstruction Adhesive Market Revenue, 2023-2030 ($)
Figure 14 Global Construction Adhesive Market - By Geography
Figure 15 Global Construction Adhesive Market Value & Volume, By Geography, 2023-2030 ($)
Figure 16 Global Construction Adhesive Market CAGR, By Geography, 2023-2030 (%)
Figure 17 North America Construction Adhesive Market Value & Volume, 2023-2030 ($)
Figure 18 US Construction Adhesive Market Value & Volume, 2023-2030 ($)
Figure 19 US GDP and Population, 2023-2030 ($)
Figure 20 US GDP – Composition of 2023, By Sector of Origin
Figure 21 US Export and Import Value & Volume, 2023-2030 ($)
Figure 22 Canada Construction Adhesive Market Value & Volume, 2023-2030 ($)
Figure 23 Canada GDP and Population, 2023-2030 ($)
Figure 24 Canada GDP – Composition of 2023, By Sector of Origin
Figure 25 Canada Export and Import Value & Volume, 2023-2030 ($)
Figure 26 Mexico Construction Adhesive Market Value & Volume, 2023-2030 ($)
Figure 27 Mexico GDP and Population, 2023-2030 ($)
Figure 28 Mexico GDP – Composition of 2023, By Sector of Origin
Figure 29 Mexico Export and Import Value & Volume, 2023-2030 ($)
Figure 30 South America Construction Adhesive MarketSouth America 3D Printing Market Value & Volume, 2023-2030 ($)
Figure 31 Brazil Construction Adhesive Market Value & Volume, 2023-2030 ($)
Figure 32 Brazil GDP and Population, 2023-2030 ($)
Figure 33 Brazil GDP – Composition of 2023, By Sector of Origin
Figure 34 Brazil Export and Import Value & Volume, 2023-2030 ($)
Figure 35 Venezuela Construction Adhesive Market Value & Volume, 2023-2030 ($)
Figure 36 Venezuela GDP and Population, 2023-2030 ($)
Figure 37 Venezuela GDP – Composition of 2023, By Sector of Origin
Figure 38 Venezuela Export and Import Value & Volume, 2023-2030 ($)
Figure 39 Argentina Construction Adhesive Market Value & Volume, 2023-2030 ($)
Figure 40 Argentina GDP and Population, 2023-2030 ($)
Figure 41 Argentina GDP – Composition of 2023, By Sector of Origin
Figure 42 Argentina Export and Import Value & Volume, 2023-2030 ($)
Figure 43 Ecuador Construction Adhesive Market Value & Volume, 2023-2030 ($)
Figure 44 Ecuador GDP and Population, 2023-2030 ($)
Figure 45 Ecuador GDP – Composition of 2023, By Sector of Origin
Figure 46 Ecuador Export and Import Value & Volume, 2023-2030 ($)
Figure 47 Peru Construction Adhesive Market Value & Volume, 2023-2030 ($)
Figure 48 Peru GDP and Population, 2023-2030 ($)
Figure 49 Peru GDP – Composition of 2023, By Sector of Origin
Figure 50 Peru Export and Import Value & Volume, 2023-2030 ($)
Figure 51 Colombia Construction Adhesive Market Value & Volume, 2023-2030 ($)
Figure 52 Colombia GDP and Population, 2023-2030 ($)
Figure 53 Colombia GDP – Composition of 2023, By Sector of Origin
Figure 54 Colombia Export and Import Value & Volume, 2023-2030 ($)
Figure 55 Costa Rica Construction Adhesive MarketCosta Rica 3D Printing Market Value & Volume, 2023-2030 ($)
Figure 56 Costa Rica GDP and Population, 2023-2030 ($)
Figure 57 Costa Rica GDP – Composition of 2023, By Sector of Origin
Figure 58 Costa Rica Export and Import Value & Volume, 2023-2030 ($)
Figure 59 Europe Construction Adhesive Market Value & Volume, 2023-2030 ($)
Figure 60 U.K Construction Adhesive Market Value & Volume, 2023-2030 ($)
Figure 61 U.K GDP and Population, 2023-2030 ($)
Figure 62 U.K GDP – Composition of 2023, By Sector of Origin
Figure 63 U.K Export and Import Value & Volume, 2023-2030 ($)
Figure 64 Germany Construction Adhesive Market Value & Volume, 2023-2030 ($)
Figure 65 Germany GDP and Population, 2023-2030 ($)
Figure 66 Germany GDP – Composition of 2023, By Sector of Origin
Figure 67 Germany Export and Import Value & Volume, 2023-2030 ($)
Figure 68 Italy Construction Adhesive Market Value & Volume, 2023-2030 ($)
Figure 69 Italy GDP and Population, 2023-2030 ($)
Figure 70 Italy GDP – Composition of 2023, By Sector of Origin
Figure 71 Italy Export and Import Value & Volume, 2023-2030 ($)
Figure 72 France Construction Adhesive Market Value & Volume, 2023-2030 ($)
Figure 73 France GDP and Population, 2023-2030 ($)
Figure 74 France GDP – Composition of 2023, By Sector of Origin
Figure 75 France Export and Import Value & Volume, 2023-2030 ($)
Figure 76 Netherlands Construction Adhesive Market Value & Volume, 2023-2030 ($)
Figure 77 Netherlands GDP and Population, 2023-2030 ($)
Figure 78 Netherlands GDP – Composition of 2023, By Sector of Origin
Figure 79 Netherlands Export and Import Value & Volume, 2023-2030 ($)
Figure 80 Belgium Construction Adhesive Market Value & Volume, 2023-2030 ($)
Figure 81 Belgium GDP and Population, 2023-2030 ($)
Figure 82 Belgium GDP – Composition of 2023, By Sector of Origin
Figure 83 Belgium Export and Import Value & Volume, 2023-2030 ($)
Figure 84 Spain Construction Adhesive Market Value & Volume, 2023-2030 ($)
Figure 85 Spain GDP and Population, 2023-2030 ($)
Figure 86 Spain GDP – Composition of 2023, By Sector of Origin
Figure 87 Spain Export and Import Value & Volume, 2023-2030 ($)
Figure 88 Denmark Construction Adhesive Market Value & Volume, 2023-2030 ($)
Figure 89 Denmark GDP and Population, 2023-2030 ($)
Figure 90 Denmark GDP – Composition of 2023, By Sector of Origin
Figure 91 Denmark Export and Import Value & Volume, 2023-2030 ($)
Figure 92 APAC Construction Adhesive Market Value & Volume, 2023-2030 ($)
Figure 93 China Construction Adhesive MarketValue & Volume, 2023-2030
Figure 94 China GDP and Population, 2023-2030 ($)
Figure 95 China GDP – Composition of 2023, By Sector of Origin
Figure 96 China Export and Import Value & Volume, 2023-2030 ($)Construction Adhesive MarketChina Export and Import Value & Volume, 2023-2030 ($)
Figure 97 Australia Construction Adhesive Market Value & Volume, 2023-2030 ($)
Figure 98 Australia GDP and Population, 2023-2030 ($)
Figure 99 Australia GDP – Composition of 2023, By Sector of Origin
Figure 100 Australia Export and Import Value & Volume, 2023-2030 ($)
Figure 101 South Korea Construction Adhesive Market Value & Volume, 2023-2030 ($)
Figure 102 South Korea GDP and Population, 2023-2030 ($)
Figure 103 South Korea GDP – Composition of 2023, By Sector of Origin
Figure 104 South Korea Export and Import Value & Volume, 2023-2030 ($)
Figure 105 India Construction Adhesive Market Value & Volume, 2023-2030 ($)
Figure 106 India GDP and Population, 2023-2030 ($)
Figure 107 India GDP – Composition of 2023, By Sector of Origin
Figure 108 India Export and Import Value & Volume, 2023-2030 ($)
Figure 109 Taiwan Construction Adhesive MarketTaiwan 3D Printing Market Value & Volume, 2023-2030 ($)
Figure 110 Taiwan GDP and Population, 2023-2030 ($)
Figure 111 Taiwan GDP – Composition of 2023, By Sector of Origin
Figure 112 Taiwan Export and Import Value & Volume, 2023-2030 ($)
Figure 113 Malaysia Construction Adhesive MarketMalaysia 3D Printing Market Value & Volume, 2023-2030 ($)
Figure 114 Malaysia GDP and Population, 2023-2030 ($)
Figure 115 Malaysia GDP – Composition of 2023, By Sector of Origin
Figure 116 Malaysia Export and Import Value & Volume, 2023-2030 ($)
Figure 117 Hong Kong Construction Adhesive MarketHong Kong 3D Printing Market Value & Volume, 2023-2030 ($)
Figure 118 Hong Kong GDP and Population, 2023-2030 ($)
Figure 119 Hong Kong GDP – Composition of 2023, By Sector of Origin
Figure 120 Hong Kong Export and Import Value & Volume, 2023-2030 ($)
Figure 121 Middle East & Africa Construction Adhesive MarketMiddle East & Africa 3D Printing Market Value & Volume, 2023-2030 ($)
Figure 122 Russia Construction Adhesive MarketRussia 3D Printing Market Value & Volume, 2023-2030 ($)
Figure 123 Russia GDP and Population, 2023-2030 ($)
Figure 124 Russia GDP – Composition of 2023, By Sector of Origin
Figure 125 Russia Export and Import Value & Volume, 2023-2030 ($)
Figure 126 Israel Construction Adhesive Market Value & Volume, 2023-2030 ($)
Figure 127 Israel GDP and Population, 2023-2030 ($)
Figure 128 Israel GDP – Composition of 2023, By Sector of Origin
Figure 129 Israel Export and Import Value & Volume, 2023-2030 ($)
Figure 130 Entropy Share, By Strategies, 2023-2030* (%)Construction Adhesive Market
Figure 131 Developments, 2023-2030*Construction Adhesive Market
Figure 132 Company 1 Construction Adhesive Market Net Revenue, By Years, 2023-2030* ($)
Figure 133 Company 1 Construction Adhesive Market Net Revenue Share, By Business segments, 2023 (%)
Figure 134 Company 1 Construction Adhesive Market Net Sales Share, By Geography, 2023 (%)
Figure 135 Company 2 Construction Adhesive Market Net Revenue, By Years, 2023-2030* ($)
Figure 136 Company 2 Construction Adhesive Market Net Revenue Share, By Business segments, 2023 (%)
Figure 137 Company 2 Construction Adhesive Market Net Sales Share, By Geography, 2023 (%)
Figure 138 Company 3Construction Adhesive Market Net Revenue, By Years, 2023-2030* ($)
Figure 139 Company 3Construction Adhesive Market Net Revenue Share, By Business segments, 2023 (%)
Figure 140 Company 3Construction Adhesive Market Net Sales Share, By Geography, 2023 (%)
Figure 141 Company 4 Construction Adhesive Market Net Revenue, By Years, 2023-2030* ($)
Figure 142 Company 4 Construction Adhesive Market Net Revenue Share, By Business segments, 2023 (%)
Figure 143 Company 4 Construction Adhesive Market Net Sales Share, By Geography, 2023 (%)
Figure 144 Company 5 Construction Adhesive Market Net Revenue, By Years, 2023-2030* ($)
Figure 145 Company 5 Construction Adhesive Market Net Revenue Share, By Business segments, 2023 (%)
Figure 146 Company 5 Construction Adhesive Market Net Sales Share, By Geography, 2023 (%)
Figure 147 Company 6 Construction Adhesive Market Net Revenue, By Years, 2023-2030* ($)
Figure 148 Company 6 Construction Adhesive Market Net Revenue Share, By Business segments, 2023 (%)
Figure 149 Company 6 Construction Adhesive Market Net Sales Share, By Geography, 2023 (%)
Figure 150 Company 7 Construction Adhesive Market Net Revenue, By Years, 2023-2030* ($)
Figure 151 Company 7 Construction Adhesive Market Net Revenue Share, By Business segments, 2023 (%)
Figure 152 Company 7 Construction Adhesive Market Net Sales Share, By Geography, 2023 (%)
Figure 153 Company 8 Construction Adhesive Market Net Revenue, By Years, 2023-2030* ($)
Figure 154 Company 8 Construction Adhesive Market Net Revenue Share, By Business segments, 2023 (%)
Figure 155 Company 8 Construction Adhesive Market Net Sales Share, By Geography, 2023 (%)
Figure 156 Company 9 Construction Adhesive Market Net Revenue, By Years, 2023-2030* ($)
Figure 157 Company 9 Construction Adhesive Market Net Revenue Share, By Business segments, 2023 (%)
Figure 158 Company 9 Construction Adhesive Market Net Sales Share, By Geography, 2023 (%)
Figure 159 Company 10 Construction Adhesive Market Net Revenue, By Years, 2023-2030* ($)
Figure 160 Company 10 Construction Adhesive Market Net Revenue Share, By Business segments, 2023 (%)
Figure 161 Company 10 Construction Adhesive Market Net Sales Share, By Geography, 2023 (%)
Figure 162 Company 11 Construction Adhesive Market Net Revenue, By Years, 2023-2030* ($)
Figure 163 Company 11 Construction Adhesive Market Net Revenue Share, By Business segments, 2023 (%)
Figure 164 Company 11 Construction Adhesive Market Net Sales Share, By Geography, 2023 (%)
Figure 165 Company 12 Construction Adhesive Market Net Revenue, By Years, 2023-2030* ($)
Figure 166 Company 12 Construction Adhesive Market Net Revenue Share, By Business segments, 2023 (%)
Figure 167 Company 12 Construction Adhesive Market Net Sales Share, By Geography, 2023 (%)
Figure 168 Company 13Construction Adhesive Market Net Revenue, By Years, 2023-2030* ($)
Figure 169 Company 13Construction Adhesive Market Net Revenue Share, By Business segments, 2023 (%)
Figure 170 Company 13Construction Adhesive Market Net Sales Share, By Geography, 2023 (%)
Figure 171 Company 14 Construction Adhesive Market Net Revenue, By Years, 2023-2030* ($)
Figure 172 Company 14 Construction Adhesive Market Net Revenue Share, By Business segments, 2023 (%)
Figure 173 Company 14 Construction Adhesive Market Net Sales Share, By Geography, 2023 (%)
Figure 174 Company 15 Construction Adhesive Market Net Revenue, By Years, 2023-2030* ($)
Figure 175 Company 15 Construction Adhesive Market Net Revenue Share, By Business segments, 2023 (%)
Figure 176 Company 15 Construction Adhesive Market Net Sales Share, By Geography, 2023 (%)