 Email
Email Print
Print


Industrial Waste Management Market - Forecast(2025 - 2031)
Companies are themselves accountable for their industrial waste management and particularly their hazardous waste. Local government authorities also offer counseling, consulting and commendations to administration on their management plan for further eco-friendly production process.
Waste management presented waste lessening schemes, administering waste transport, monitoring and assigning budget, developing promotional material, dealing with the grievances from public and conducting investigations to their concern, monitoring quality and performance of waste collection facilities.
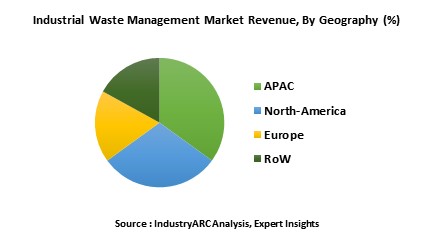
The global market for industrial waste management was estimated to be $XX billion in 2015 and is estimated to grow at a CAGR of XX% and is forecast to reach $XX billion by 2021. The industrial waste management is forecast to have the highest growth of X% during the forecast period 2016-2021. Automobile and electronic industries are the major end-users for industrial waste management.
Asia-Pacific is the leading market for industrial waste management in 2015 and is forecast to have highest growth in the next few years due to growing adoption of waste management in industrial applications. North-America industrial waste management accounts to XX% of the global market for industrial waste management and is one among the fastest growing market followed by Europe. North America and APAC are estimated to occupy a share of more than XX% during 2024-2030.
- AERATION INDUSTRIES
- DEMON GmbH
- Summit Equipment, Inc.
- Waste Processing Equipment, Inc.
- WT ENERGY S.p.A.
- 10+.
Key Market Players:
The Top 5 companies in the Industrial Waste Management Market are:
- Veolia
- SUEZ
- WM Intellectual Property Holdings, L.L.C.
- Stericycle, Inc.
- Clean Harbors, Inc.
1. Industrial Waste Management Market Overview
2. Executive Summary
3. Industrial Waste Management Market Landscape
3.1. Market Share Analysis
3.2. Comparative Analysis
3.2.1. Product Benchmarking
3.2.2. End User Profiling
3.2.3. Top 5 Financials Analysis
4. Industrial Waste Management Market Forces
4.1. Market Drivers
4.2. Market Constraints & Challenges
4.3. Attractiveness Of The Industrial Waste Management Industry
4.3.1. Power Of Suppliers
4.3.2. Threats From New Entrants
4.3.3. Power Of Buyer
4.3.4. Threat From Substitute Product
4.3.5. Degree Of Competition
5. Industrial Waste Management Market-Strategic Analysis
5.1. Industrial Waste Management Market - Value Chain Analysis
5.2. Pricing Analysis
5.3. Opportunity Analysis
5.4. Product Life Cycle
5.5. Suppliers And Distributors
6. Industrial Waste Management Market-By Approaches
6.1. Introduction
6.2. Incineration
6.3. Landfill
6.4. Recycling
6.5. Composting
6.6. Others
7. Industrial Waste Management Market-By End-User Industry
7.1. Aerospace and Defence
7.2. Automobile
7.3. Oil & Gas
7.4. Agriculture
7.5. Pulp and Paper
7.6. Food & Beverage
7.7. Electronics
7.8. Biotechnology
7.9. Pharmaceutical
7.10. Others
8. Industrial Waste Management Market -By Geography
8.1. Americas
8.1.1. U.S.
8.1.2. Canada
8.1.3. Mexico
8.1.4. Others
8.2. Europe
8.2.1. U.K.
8.2.2. Germany
8.2.3. Italy
8.2.4. France
8.2.5. Others
8.3. Asia-Pacific(APAC)
8.3.1. China
8.3.2. South Korea
8.3.3. Japan
8.3.4. India
8.3.5. Others
8.4. Rest of The World (ROW)
9. Industrial Waste Management Market Entropy
9.1. New Product Developments
9.2. Mergers and Acquisitions
10. Company Profiles
10.1. Superior Water Screen Company, Inc
10.2. AERATION INDUSTRIES
10.3. AVERMANN Maschinenfabrik GmbH & Co. KG
10.4. BELLMER KUFFERATH Machinery GmbH
10.5. Calgon Carbon Corporation
10.6. Copex S.A.
10.7. DEMON GmbH
10.8. Eco Waste Solutions
10.9. Ecolo Odor Control Technologies
10.10. Summit Equipment, Inc.
10.11. Terberg Environmental
10.12. UNTHA shredding technology GmbH
10.13. Vac-Tron Equipment LLC
10.14. W. L. Gore & Associates, Inc.
10.15. Waste Processing Equipment, Inc.
10.16. WeatherSolve Structures Inc.
10.17. WT ENERGY S.p.A.
*More than 10 Companies are profiled in this Research Report*
"*Financials would be provided on a best efforts basis for private companies"
11. Appendix
11.1. Abbreviations
11.2. Sources
11.3. Research Methodology
11.4. Bibliography
11.5. Compilation of Expert Insights
11.6. Disclaimer
List of Tables
Table 1: Industrial Waste Management Market Overview 2023-2030
Table 2: Industrial Waste Management Market Leader Analysis 2023-2030 (US$)
Table 3: Industrial Waste Management MarketProduct Analysis 2023-2030 (US$)
Table 4: Industrial Waste Management MarketEnd User Analysis 2023-2030 (US$)
Table 5: Industrial Waste Management MarketPatent Analysis 2013-2023* (US$)
Table 6: Industrial Waste Management MarketFinancial Analysis 2023-2030 (US$)
Table 7: Industrial Waste Management Market Driver Analysis 2023-2030 (US$)
Table 8: Industrial Waste Management MarketChallenges Analysis 2023-2030 (US$)
Table 9: Industrial Waste Management MarketConstraint Analysis 2023-2030 (US$)
Table 10: Industrial Waste Management Market Supplier Bargaining Power Analysis 2023-2030 (US$)
Table 11: Industrial Waste Management Market Buyer Bargaining Power Analysis 2023-2030 (US$)
Table 12: Industrial Waste Management Market Threat of Substitutes Analysis 2023-2030 (US$)
Table 13: Industrial Waste Management Market Threat of New Entrants Analysis 2023-2030 (US$)
Table 14: Industrial Waste Management Market Degree of Competition Analysis 2023-2030 (US$)
Table 15: Industrial Waste Management MarketValue Chain Analysis 2023-2030 (US$)
Table 16: Industrial Waste Management MarketPricing Analysis 2023-2030 (US$)
Table 17: Industrial Waste Management MarketOpportunities Analysis 2023-2030 (US$)
Table 18: Industrial Waste Management MarketProduct Life Cycle Analysis 2023-2030 (US$)
Table 19: Industrial Waste Management MarketSupplier Analysis 2023-2030 (US$)
Table 20: Industrial Waste Management MarketDistributor Analysis 2023-2030 (US$)
Table 21: Industrial Waste Management Market Trend Analysis 2023-2030 (US$)
Table 22: Industrial Waste Management Market Size 2023 (US$)
Table 23: Industrial Waste Management Market Forecast Analysis 2023-2030 (US$)
Table 24: Industrial Waste Management Market Sales Forecast Analysis 2023-2030 (Units)
Table 25: Industrial Waste Management Market, Revenue & Volume,By Approaches, 2023-2030 ($)
Table 26: Industrial Waste Management MarketBy Approaches, Revenue & Volume,By Incineration, 2023-2030 ($)
Table 27: Industrial Waste Management MarketBy Approaches, Revenue & Volume,By Landfill, 2023-2030 ($)
Table 28: Industrial Waste Management MarketBy Approaches, Revenue & Volume,By Recycling, 2023-2030 ($)
Table 29: Industrial Waste Management MarketBy Approaches, Revenue & Volume,By Composting, 2023-2030 ($)
Table 30: Industrial Waste Management Market, Revenue & Volume,By End-User Industry, 2023-2030 ($)
Table 31: Industrial Waste Management MarketBy End-User Industry, Revenue & Volume,By Aerospace and Defence , 2023-2030 ($)
Table 32: Industrial Waste Management MarketBy End-User Industry, Revenue & Volume,By Automobile , 2023-2030 ($)
Table 33: Industrial Waste Management MarketBy End-User Industry, Revenue & Volume,By Oil & Gas , 2023-2030 ($)
Table 34: Industrial Waste Management MarketBy End-User Industry, Revenue & Volume,By Agriculture, 2023-2030 ($)
Table 35: Industrial Waste Management MarketBy End-User Industry, Revenue & Volume,By Pulp and Paper , 2023-2030 ($)
Table 36: North America Industrial Waste Management Market, Revenue & Volume,By Approaches, 2023-2030 ($)
Table 37: North America Industrial Waste Management Market, Revenue & Volume,By End-User Industry, 2023-2030 ($)
Table 38: South america Industrial Waste Management Market, Revenue & Volume,By Approaches, 2023-2030 ($)
Table 39: South america Industrial Waste Management Market, Revenue & Volume,By End-User Industry, 2023-2030 ($)
Table 40: Europe Industrial Waste Management Market, Revenue & Volume,By Approaches, 2023-2030 ($)
Table 41: Europe Industrial Waste Management Market, Revenue & Volume,By End-User Industry, 2023-2030 ($)
Table 42: APAC Industrial Waste Management Market, Revenue & Volume,By Approaches, 2023-2030 ($)
Table 43: APAC Industrial Waste Management Market, Revenue & Volume,By End-User Industry, 2023-2030 ($)
Table 44: Middle East & Africa Industrial Waste Management Market, Revenue & Volume,By Approaches, 2023-2030 ($)
Table 45: Middle East & Africa Industrial Waste Management Market, Revenue & Volume,By End-User Industry, 2023-2030 ($)
Table 46: Russia Industrial Waste Management Market, Revenue & Volume,By Approaches, 2023-2030 ($)
Table 47: Russia Industrial Waste Management Market, Revenue & Volume,By End-User Industry, 2023-2030 ($)
Table 48: Israel Industrial Waste Management Market, Revenue & Volume,By Approaches, 2023-2030 ($)
Table 49: Israel Industrial Waste Management Market, Revenue & Volume,By End-User Industry, 2023-2030 ($)
Table 50: Top Companies 2023 (US$)Industrial Waste Management Market, Revenue & Volume,,
Table 51: Product Launch 2023-2030Industrial Waste Management Market, Revenue & Volume,,
Table 52: Mergers & Acquistions 2023-2030Industrial Waste Management Market, Revenue & Volume,,
List of Figures
Figure 1: Overview of Industrial Waste Management Market 2023-2030
Figure 2: Market Share Analysis for Industrial Waste Management Market 2023 (US$)
Figure 3: Product Comparison in Industrial Waste Management Market 2023-2030 (US$)
Figure 4: End User Profile for Industrial Waste Management Market 2023-2030 (US$)
Figure 5: Patent Application and Grant in Industrial Waste Management Market 2013-2023* (US$)
Figure 6: Top 5 Companies Financial Analysis in Industrial Waste Management Market 2023-2030 (US$)
Figure 7: Market Entry Strategy in Industrial Waste Management Market 2023-2030
Figure 8: Ecosystem Analysis in Industrial Waste Management Market2023
Figure 9: Average Selling Price in Industrial Waste Management Market 2023-2030
Figure 10: Top Opportunites in Industrial Waste Management Market 2023-2030
Figure 11: Market Life Cycle Analysis in Industrial Waste Management Market
Figure 12: GlobalBy ApproachesIndustrial Waste Management Market Revenue, 2023-2030 ($)
Figure 13: GlobalBy End-User IndustryIndustrial Waste Management Market Revenue, 2023-2030 ($)
Figure 14: Global Industrial Waste Management Market - By Geography
Figure 15: Global Industrial Waste Management Market Value & Volume, By Geography, 2023-2030 ($)
Figure 16: Global Industrial Waste Management Market CAGR, By Geography, 2023-2030 (%)
Figure 17: North America Industrial Waste Management Market Value & Volume, 2023-2030 ($)
Figure 18: US Industrial Waste Management Market Value & Volume, 2023-2030 ($)
Figure 19: US GDP and Population, 2023-2030 ($)
Figure 20: US GDP – Composition of 2023, By Sector of Origin
Figure 21: US Export and Import Value & Volume, 2023-2030 ($)
Figure 22: Canada Industrial Waste Management Market Value & Volume, 2023-2030 ($)
Figure 23: Canada GDP and Population, 2023-2030 ($)
Figure 24: Canada GDP – Composition of 2023, By Sector of Origin
Figure 25: Canada Export and Import Value & Volume, 2023-2030 ($)
Figure 26: Mexico Industrial Waste Management Market Value & Volume, 2023-2030 ($)
Figure 27: Mexico GDP and Population, 2023-2030 ($)
Figure 28: Mexico GDP – Composition of 2023, By Sector of Origin
Figure 29: Mexico Export and Import Value & Volume, 2023-2030 ($)
Figure 30: South America Industrial Waste Management MarketSouth America 3D Printing Market Value & Volume, 2023-2030 ($)
Figure 31: Brazil Industrial Waste Management Market Value & Volume, 2023-2030 ($)
Figure 32: Brazil GDP and Population, 2023-2030 ($)
Figure 33: Brazil GDP – Composition of 2023, By Sector of Origin
Figure 34: Brazil Export and Import Value & Volume, 2023-2030 ($)
Figure 35: Venezuela Industrial Waste Management Market Value & Volume, 2023-2030 ($)
Figure 36: Venezuela GDP and Population, 2023-2030 ($)
Figure 37: Venezuela GDP – Composition of 2023, By Sector of Origin
Figure 38: Venezuela Export and Import Value & Volume, 2023-2030 ($)
Figure 39: Argentina Industrial Waste Management Market Value & Volume, 2023-2030 ($)
Figure 40: Argentina GDP and Population, 2023-2030 ($)
Figure 41: Argentina GDP – Composition of 2023, By Sector of Origin
Figure 42: Argentina Export and Import Value & Volume, 2023-2030 ($)
Figure 43: Ecuador Industrial Waste Management Market Value & Volume, 2023-2030 ($)
Figure 44: Ecuador GDP and Population, 2023-2030 ($)
Figure 45: Ecuador GDP – Composition of 2023, By Sector of Origin
Figure 46: Ecuador Export and Import Value & Volume, 2023-2030 ($)
Figure 47: Peru Industrial Waste Management Market Value & Volume, 2023-2030 ($)
Figure 48: Peru GDP and Population, 2023-2030 ($)
Figure 49: Peru GDP – Composition of 2023, By Sector of Origin
Figure 50: Peru Export and Import Value & Volume, 2023-2030 ($)
Figure 51: Colombia Industrial Waste Management Market Value & Volume, 2023-2030 ($)
Figure 52: Colombia GDP and Population, 2023-2030 ($)
Figure 53: Colombia GDP – Composition of 2023, By Sector of Origin
Figure 54: Colombia Export and Import Value & Volume, 2023-2030 ($)
Figure 55: Costa Rica Industrial Waste Management MarketCosta Rica 3D Printing Market Value & Volume, 2023-2030 ($)
Figure 56: Costa Rica GDP and Population, 2023-2030 ($)
Figure 57: Costa Rica GDP – Composition of 2023, By Sector of Origin
Figure 58: Costa Rica Export and Import Value & Volume, 2023-2030 ($)
Figure 59: Europe Industrial Waste Management Market Value & Volume, 2023-2030 ($)
Figure 60: U.K Industrial Waste Management Market Value & Volume, 2023-2030 ($)
Figure 61: U.K GDP and Population, 2023-2030 ($)
Figure 62: U.K GDP – Composition of 2023, By Sector of Origin
Figure 63: U.K Export and Import Value & Volume, 2023-2030 ($)
Figure 64: Germany Industrial Waste Management Market Value & Volume, 2023-2030 ($)
Figure 65: Germany GDP and Population, 2023-2030 ($)
Figure 66: Germany GDP – Composition of 2023, By Sector of Origin
Figure 67: Germany Export and Import Value & Volume, 2023-2030 ($)
Figure 68: Italy Industrial Waste Management Market Value & Volume, 2023-2030 ($)
Figure 69: Italy GDP and Population, 2023-2030 ($)
Figure 70: Italy GDP – Composition of 2023, By Sector of Origin
Figure 71: Italy Export and Import Value & Volume, 2023-2030 ($)
Figure 72: France Industrial Waste Management Market Value & Volume, 2023-2030 ($)
Figure 73: France GDP and Population, 2023-2030 ($)
Figure 74: France GDP – Composition of 2023, By Sector of Origin
Figure 75: France Export and Import Value & Volume, 2023-2030 ($)
Figure 76: Netherlands Industrial Waste Management Market Value & Volume, 2023-2030 ($)
Figure 77: Netherlands GDP and Population, 2023-2030 ($)
Figure 78: Netherlands GDP – Composition of 2023, By Sector of Origin
Figure 79: Netherlands Export and Import Value & Volume, 2023-2030 ($)
Figure 80: Belgium Industrial Waste Management Market Value & Volume, 2023-2030 ($)
Figure 81: Belgium GDP and Population, 2023-2030 ($)
Figure 82: Belgium GDP – Composition of 2023, By Sector of Origin
Figure 83: Belgium Export and Import Value & Volume, 2023-2030 ($)
Figure 84: Spain Industrial Waste Management Market Value & Volume, 2023-2030 ($)
Figure 85: Spain GDP and Population, 2023-2030 ($)
Figure 86: Spain GDP – Composition of 2023, By Sector of Origin
Figure 87: Spain Export and Import Value & Volume, 2023-2030 ($)
Figure 88: Denmark Industrial Waste Management Market Value & Volume, 2023-2030 ($)
Figure 89: Denmark GDP and Population, 2023-2030 ($)
Figure 90: Denmark GDP – Composition of 2023, By Sector of Origin
Figure 91: Denmark Export and Import Value & Volume, 2023-2030 ($)
Figure 92: APAC Industrial Waste Management Market Value & Volume, 2023-2030 ($)
Figure 93: China Industrial Waste Management MarketValue & Volume, 2023-2030
Figure 94: China GDP and Population, 2023-2030 ($)
Figure 95: China GDP – Composition of 2023, By Sector of Origin
Figure 96: China Export and Import Value & Volume, 2023-2030 ($)Industrial Waste Management MarketChina Export and Import Value & Volume, 2023-2030 ($)
Figure 97: Australia Industrial Waste Management Market Value & Volume, 2023-2030 ($)
Figure 98: Australia GDP and Population, 2023-2030 ($)
Figure 99: Australia GDP – Composition of 2023, By Sector of Origin
Figure 100: Australia Export and Import Value & Volume, 2023-2030 ($)
Figure 101: South Korea Industrial Waste Management Market Value & Volume, 2023-2030 ($)
Figure 102: South Korea GDP and Population, 2023-2030 ($)
Figure 103: South Korea GDP – Composition of 2023, By Sector of Origin
Figure 104: South Korea Export and Import Value & Volume, 2023-2030 ($)
Figure 105: India Industrial Waste Management Market Value & Volume, 2023-2030 ($)
Figure 106: India GDP and Population, 2023-2030 ($)
Figure 107: India GDP – Composition of 2023, By Sector of Origin
Figure 108: India Export and Import Value & Volume, 2023-2030 ($)
Figure 109: Taiwan Industrial Waste Management MarketTaiwan 3D Printing Market Value & Volume, 2023-2030 ($)
Figure 110: Taiwan GDP and Population, 2023-2030 ($)
Figure 111: Taiwan GDP – Composition of 2023, By Sector of Origin
Figure 112: Taiwan Export and Import Value & Volume, 2023-2030 ($)
Figure 113: Malaysia Industrial Waste Management MarketMalaysia 3D Printing Market Value & Volume, 2023-2030 ($)
Figure 114: Malaysia GDP and Population, 2023-2030 ($)
Figure 115: Malaysia GDP – Composition of 2023, By Sector of Origin
Figure 116: Malaysia Export and Import Value & Volume, 2023-2030 ($)
Figure 117: Hong Kong Industrial Waste Management MarketHong Kong 3D Printing Market Value & Volume, 2023-2030 ($)
Figure 118: Hong Kong GDP and Population, 2023-2030 ($)
Figure 119: Hong Kong GDP – Composition of 2023, By Sector of Origin
Figure 120: Hong Kong Export and Import Value & Volume, 2023-2030 ($)
Figure 121: Middle East & Africa Industrial Waste Management MarketMiddle East & Africa 3D Printing Market Value & Volume, 2023-2030 ($)
Figure 122: Russia Industrial Waste Management MarketRussia 3D Printing Market Value & Volume, 2023-2030 ($)
Figure 123: Russia GDP and Population, 2023-2030 ($)
Figure 124: Russia GDP – Composition of 2023, By Sector of Origin
Figure 125: Russia Export and Import Value & Volume, 2023-2030 ($)
Figure 126: Israel Industrial Waste Management Market Value & Volume, 2023-2030 ($)
Figure 127: Israel GDP and Population, 2023-2030 ($)
Figure 128: Israel GDP – Composition of 2023, By Sector of Origin
Figure 129: Israel Export and Import Value & Volume, 2023-2030 ($)
Figure 130: Entropy Share, By Strategies, 2023-2030* (%)Industrial Waste Management Market
Figure 131: Developments, 2023-2030*Industrial Waste Management Market
Figure 132: Company 1 Industrial Waste Management Market Net Revenue, By Years, 2023-2030* ($)
Figure 133: Company 1 Industrial Waste Management Market Net Revenue Share, By Business segments, 2023 (%)
Figure 134: Company 1 Industrial Waste Management Market Net Sales Share, By Geography, 2023 (%)
Figure 135: Company 2 Industrial Waste Management Market Net Revenue, By Years, 2023-2030* ($)
Figure 136: Company 2 Industrial Waste Management Market Net Revenue Share, By Business segments, 2023 (%)
Figure 137: Company 2 Industrial Waste Management Market Net Sales Share, By Geography, 2023 (%)
Figure 138: Company 3Industrial Waste Management Market Net Revenue, By Years, 2023-2030* ($)
Figure 139: Company 3Industrial Waste Management Market Net Revenue Share, By Business segments, 2023 (%)
Figure 140: Company 3Industrial Waste Management Market Net Sales Share, By Geography, 2023 (%)
Figure 141: Company 4 Industrial Waste Management Market Net Revenue, By Years, 2023-2030* ($)
Figure 142: Company 4 Industrial Waste Management Market Net Revenue Share, By Business segments, 2023 (%)
Figure 143: Company 4 Industrial Waste Management Market Net Sales Share, By Geography, 2023 (%)
Figure 144: Company 5 Industrial Waste Management Market Net Revenue, By Years, 2023-2030* ($)
Figure 145: Company 5 Industrial Waste Management Market Net Revenue Share, By Business segments, 2023 (%)
Figure 146: Company 5 Industrial Waste Management Market Net Sales Share, By Geography, 2023 (%)
Figure 147: Company 6 Industrial Waste Management Market Net Revenue, By Years, 2023-2030* ($)
Figure 148: Company 6 Industrial Waste Management Market Net Revenue Share, By Business segments, 2023 (%)
Figure 149: Company 6 Industrial Waste Management Market Net Sales Share, By Geography, 2023 (%)
Figure 150: Company 7 Industrial Waste Management Market Net Revenue, By Years, 2023-2030* ($)
Figure 151: Company 7 Industrial Waste Management Market Net Revenue Share, By Business segments, 2023 (%)
Figure 152: Company 7 Industrial Waste Management Market Net Sales Share, By Geography, 2023 (%)
Figure 153: Company 8 Industrial Waste Management Market Net Revenue, By Years, 2023-2030* ($)
Figure 154: Company 8 Industrial Waste Management Market Net Revenue Share, By Business segments, 2023 (%)
Figure 155: Company 8 Industrial Waste Management Market Net Sales Share, By Geography, 2023 (%)
Figure 156: Company 9 Industrial Waste Management Market Net Revenue, By Years, 2023-2030* ($)
Figure 157: Company 9 Industrial Waste Management Market Net Revenue Share, By Business segments, 2023 (%)
Figure 158: Company 9 Industrial Waste Management Market Net Sales Share, By Geography, 2023 (%)
Figure 159: Company 10 Industrial Waste Management Market Net Revenue, By Years, 2023-2030* ($)
Figure 160: Company 10 Industrial Waste Management Market Net Revenue Share, By Business segments, 2023 (%)
Figure 161: Company 10 Industrial Waste Management Market Net Sales Share, By Geography, 2023 (%)
Figure 162: Company 11 Industrial Waste Management Market Net Revenue, By Years, 2023-2030* ($)
Figure 163: Company 11 Industrial Waste Management Market Net Revenue Share, By Business segments, 2023 (%)
Figure 164: Company 11 Industrial Waste Management Market Net Sales Share, By Geography, 2023 (%)
Figure 165: Company 12 Industrial Waste Management Market Net Revenue, By Years, 2023-2030* ($)
Figure 166: Company 12 Industrial Waste Management Market Net Revenue Share, By Business segments, 2023 (%)
Figure 167: Company 12 Industrial Waste Management Market Net Sales Share, By Geography, 2023 (%)
Figure 168: Company 13Industrial Waste Management Market Net Revenue, By Years, 2023-2030* ($)
Figure 169: Company 13Industrial Waste Management Market Net Revenue Share, By Business segments, 2023 (%)
Figure 170: Company 13Industrial Waste Management Market Net Sales Share, By Geography, 2023 (%)
Figure 171: Company 14 Industrial Waste Management Market Net Revenue, By Years, 2023-2030* ($)
Figure 172: Company 14 Industrial Waste Management Market Net Revenue Share, By Business segments, 2023 (%)
Figure 173: Company 14 Industrial Waste Management Market Net Sales Share, By Geography, 2023 (%)
Figure 174: Company 15 Industrial Waste Management Market Net Revenue, By Years, 2023-2030* ($)
Figure 175: Company 15 Industrial Waste Management Market Net Revenue Share, By Business segments, 2023 (%)
Figure 176: Company 15 Industrial Waste Management Market Net Sales Share, By Geography, 2023 (%)