 Email
Email Print
Print


Eco Fibres Market - By Type , By Form , By Application , By Geography - Forecast(2024-2030)
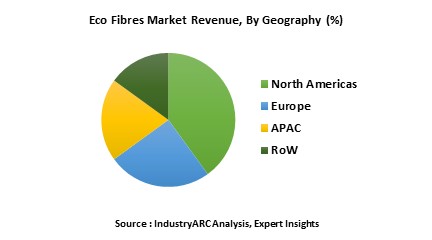
The global Eco Fibres Market Size is forecast to reach $ 90,500 Million by 2030, at a CAGR of 8.30% during forecast period 2024-2030. Rapid expansion of textile industry especially in emerging nations (like India and China) has been one of the major factor for the growth of this market. With the increase of bamboo cultivation the eco fiber market will see a significant growth. However, most of the consumers still prefer synthetic fibers over the organic ones because of its availability.
What are Eco Fibers?
Eco fibers are fibers which do not require any pesticides or chemicals to grow. They are naturally resistant to mold and mildew. These fibers are obtained from animal skin (protein fiber) and plants(Cellulose) . The regenerated fibers are also called as manmade fibers. They are made artificially by using the building blocks provided by the nature. The different types of eco fibers include Bamboo, Hemp, Soy and Recycled and upcycled materials.
What are the applications of Eco Fiber?
The textile industry is considered to be the wide user of eco fiber. They mainly use these fibers for making clothes, accessories and bags. Eco fibers are widely used for making household and furnishing materials. In medical industry Eco fibers are used for making surgical clothes, napkins, baby and adult diapers and also bandages. Eco fibers are also used by manufacturing and automobile industry.
Market Research and Market Trends of Eco Fibers:
- EcoPlanet Bamboo Working with Canopy to Offer sustainable alternative to fiber textiles. Canadian forest conservation- Canpoy announced that Ecoplanet Bamboo, the largest provider of certified bamboo plantation on degraded lands has committed a policy which is designed to offer a more sustainable option for clothing brands who are seeking alternatives to ancient and endangered forest fibers
- Sugar coated solutions are used for nylon textile microfibers. Italian researchers claim to have developed a new textile finish based on sugars derived from agricultural waste products, such as sunflower oil and fruit juice, that reduces the release of nylon microfibers
- Banana fiber may start a new fashion trend. A fabric made from banana could be the next green apparel of the future. It is said to be cheaper than cotton and linen if produced on a mass scale. Researchers of clothing and textile have designed woven and non-woven fabrics of the fiber obtained from the pseudo stem of the banana plant.
Who are the Major Players in Eco Fibers Market?
The companies referred in the market research report are Aditya Birla & Group, US Fibers, Eco Fibers, J.Korin and 10 other companies.
What is our report scope?
The report incorporates in-depth assessment of the competitive landscape, product market sizing, product benchmarking, market trends, product developments, financial analysis, strategic analysis and so on to gauge the impact forces and potential opportunities of the market. Apart from this the report also includes a study of major developments in the market such as product launches, agreements, acquisitions, collaborations, mergers and so on to comprehend the prevailing market dynamics at present and its impact during the forecast period 2024-2030.
All our reports are customizable to your company needs to a certain extent, we do provide 20 free consulting hours along with purchase of each report, and this will allow you to request any additional data to customize the report to your needs.
Key Takeaways from this Report
- Evaluate market potential through analyzing growth rates (CAGR %), data given at country level – for product types, end use applications and by different industry verticals.
- Understand the different dynamics influencing the market – key driving factors, challenges and hidden opportunities.
- Get in-depth insights on your competitor performance – market shares, strategies, financial benchmarking, product benchmarking, SWOT and more.
- Analyze the sales and distribution channels across key geographies to improve top-line revenues.
- Understand the industry supply chain with a deep-dive on the value augmentation at each step, in order to optimize value and bring efficiencies in your processes.
- Get a quick outlook on the market entropy – M&A’s, deals, partnerships, product launches of all key players for the past 4 years.
- Evaluate the supply-demand gaps, import-export statistics and regulatory landscape for more than top 20 countries globally for the market.
Key Market Players:
The Top 5 companies in the Eco Fibres Market are:
- Sateri Group
- Lenzing Ecovero AG
- US Fiber
- Tangshan Sanyou Group Xingda Chemical Fibre Co. Ltd
- Grasim Industries Limited
For more Agriculture Market reports, please click here
1. Eco Fibres Market - Overview
1.1. Definitions and Scope
2. Eco Fibres Market - Executive summary
2.1. Market Revenue, Market Size and Key Trends by Company
2.2. Key Trends by type of Application
2.3. Key Trends segmented by Geography
3. Eco Fibres Market
3.1. Comparative analysis
3.1.1. Product Benchmarking - Top 10 companies
3.1.2. Top 5 Financials Analysis
3.1.3. Market Value split by Top 10 companies
3.1.4. Patent Analysis - Top 10 companies
3.1.5. Pricing Analysis
4. Eco Fibres Market – Startup companies Scenario Premium
4.1. Top 10 startup company Analysis by
4.1.1. Investment
4.1.2. Revenue
4.1.3. Market Shares
4.1.4. Market Size and Application Analysis
4.1.5. Venture Capital and Funding Scenario
5. Eco Fibres Market – Industry Market Entry Scenario Premium
5.1. Regulatory Framework Overview
5.2. New Business and Ease of Doing business index
5.3. Case studies of successful ventures
5.4. Customer Analysis – Top 10 companies
6. Eco Fibres Market Forces
6.1. Drivers
6.2. Constraints
6.3. Challenges
6.4. Porters five force model
6.4.1. Bargaining power of suppliers
6.4.2. Bargaining powers of customers
6.4.3. Threat of new entrants
6.4.4. Rivalry among existing players
6.4.5. Threat of substitutes
7. Eco Fibres Market -Strategic analysis
7.1. Value chain analysis
7.2. Opportunities analysis
7.3. Product life cycle
7.4. Suppliers and distributors Market Share
8. Eco Fibres Market – By Source (Market Size -$Million / $Billion)
8.1. Market Size and Market Share Analysis
8.2. Application Revenue and Trend Research
8.3. Product Segment Analysis
8.3.1. Animal Skin
8.3.1.1. Cashmere
8.3.1.2. Alpaca
8.3.1.3. Angora
8.3.1.4. Camel
8.3.1.5. Mohair
8.3.1.6. Silk
8.3.1.7. Wool
8.3.2. Plant Cellulose
8.3.2.1. Cotton
8.3.2.2. Coir
8.3.2.3. Kapok
8.3.3. Others
9. Eco Fibres Market – By Type (Market Size -$Million / $Billion)
9.1. Natural Fibers
9.1.1. Protein Fibers
9.1.2. Cellulose Fibers
9.2. Regenerated Fibers
9.2.1. Proteins
9.2.2. Cellulose
9.3. Recyclable Fibers
10. Eco Fibres – By End Use Industry (Market Size -$Million / $Billion)
10.1. Segment type Size and Market Share Analysis
10.2. Application Revenue and Trends by type of Application
10.3. Application Segment Analysis by Type
10.3.1. Textiles
10.3.1.1. Sweaters
10.3.1.2. Bags
10.3.1.3. Footwear
10.3.2. Household & Furnishing
10.3.2.1. Doormats
10.3.2.2. Toilet tissues
10.3.2.3. Cotton napkins
10.3.3. Manufacturing Industry
10.3.3.1. Loop and eye fastening
10.3.3.2. Driver belts & Conveyor belts
10.3.4. Medical
10.3.4.1. Surgical clothes
10.3.4.2. Sanitary napkins
10.3.4.3. Baby & Adult Diapers
10.3.4.4. Bandages
10.3.5. Automobiles
10.3.5.1. Car decors
10.3.6. Others
11. Eco Fibres - By Geography (Market Size -$Million / $Billion)
11.1. Eco Fibres Market - North America Segment Research
11.2. North America Market Research (Million / $Billion)
11.2.1. Segment type Size and Market Size Analysis
11.2.2. Revenue and Trends
11.2.3. Application Revenue and Trends by type of Application
11.2.4. Company Revenue and Product Analysis
11.2.5. North America Product type and Application Market Size
11.2.5.1. U.S.
11.2.5.2. Canada
11.2.5.3. Mexico
11.2.5.4. Rest of North America
11.3. Eco Fibres - South America Segment Research
11.4. South America Market Research (Market Size -$Million / $Billion)
11.4.1. Segment type Size and Market Size Analysis
11.4.2. Revenue and Trends
11.4.3. Application Revenue and Trends by type of Application
11.4.4. Company Revenue and Product Analysis
11.4.5. South America Product type and Application Market Size
11.4.5.1. Brazil
11.4.5.2. Venezuela
11.4.5.3. Argentina
11.4.5.4. Ecuador
11.4.5.5. Peru
11.4.5.6. Colombia
11.4.5.7. Costa Rica
11.4.5.8. Rest of South America
11.5. Eco Fibres - Europe Segment Research
11.6. Europe Market Research (Market Size -$Million / $Billion)
11.6.1. Segment type Size and Market Size Analysis
11.6.2. Revenue and Trends
11.6.3. Application Revenue and Trends by type of Application
11.6.4. Company Revenue and Product Analysis
11.6.5. Europe Segment Product type and Application Market Size
11.6.5.1. U.K
11.6.5.2. Germany
11.6.5.3. Italy
11.6.5.4. France
11.6.5.5. Netherlands
11.6.5.6. Belgium
11.6.5.7. Spain
11.6.5.8. Denmark
11.6.5.9. Rest of Europe
11.7. Eco Fibres – APAC Segment Research
11.8. APAC Market Research (Market Size -$Million / $Billion)
11.8.1. Segment type Size and Market Size Analysis
11.8.2. Revenue and Trends
11.8.3. Application Revenue and Trends by type of Application
11.8.4. Company Revenue and Product Analysis
11.8.5. APAC Segment – Product type and Application Market Size
11.8.5.1. China
11.8.5.2. Australia
11.8.5.3. Japan
11.8.5.4. South Korea
11.8.5.5. India
11.8.5.6. Taiwan
11.8.5.7. Malaysia
12. Eco Fibres Market - Entropy
12.1. New product launches
12.2. M&A's, collaborations, JVs and partnerships
13. Eco Fibres Market – Industry / Segment Competition landscape Premium
13.1. Market Share Analysis
13.1.1. Market Share by Country- Top companies
13.1.2. Market Share by Region- Top 10 companies
13.1.3. Market Share by type of Application – Top 10 companies
13.1.4. Market Share by type of Product / Product category- Top 10 companies
13.1.5. Market Share at global level- Top 10 companies
13.1.6. Best Practises for companies
14. Eco Fibres Market – Key Company List by Country Premium
15. Eco Fibres Market Company Analysis
15.1. Market Share, Company Revenue, Products, M&A, Developments
15.2. Aditya Birla & Group
15.3. Eco Fibers
15.4. J.Korin
15.5. Sateri Group
15.6. Lenzing Ecovero AG
15.7. US Fiber
15.8. Tangshan Sanyou Group Xingda Chemical Fibre Co. Ltd
"*Financials would be provided on a best efforts basis for private companies"
16. Eco Fibres Market -Appendix
16.1. Abbreviations
16.2. Sources
17. Eco Fibres Market -Methodology Premium
17.1. Research Methodology
17.1.1. Company Expert Interviews
17.1.2. Industry Databases
17.1.3. Associations
17.1.4. Company News
17.1.5. Company Annual Reports
17.1.6. Application Trends
17.1.7. New Products and Product database
17.1.8. Company Transcripts
17.1.9. R&D Trends
17.1.10. Key Opinion Leaders Interviews
17.1.11. Supply and Demand Trends
List of Tables
Table 1: Eco Fibres Market Overview 2023-2030
Table 2: Eco Fibres Market Leader Analysis 2023-2030 (US$)
Table 3: Eco Fibres Market Product Analysis 2023-2030 (US$)
Table 4: Eco Fibres Market End User Analysis 2023-2030 (US$)
Table 5: Eco Fibres Market Patent Analysis 2013-2023* (US$)
Table 6: Eco Fibres Market Financial Analysis 2023-2030 (US$)
Table 7: Eco Fibres Market Driver Analysis 2023-2030 (US$)
Table 8: Eco Fibres Market Challenges Analysis 2023-2030 (US$)
Table 9: Eco Fibres Market Constraint Analysis 2023-2030 (US$)
Table 10: Eco Fibres Market Supplier Bargaining Power Analysis 2023-2030 (US$)
Table 11: Eco Fibres Market Buyer Bargaining Power Analysis 2023-2030 (US$)
Table 12: Eco Fibres Market Threat of Substitutes Analysis 2023-2030 (US$)
Table 13: Eco Fibres Market Threat of New Entrants Analysis 2023-2030 (US$)
Table 14: Eco Fibres Market Degree of Competition Analysis 2023-2030 (US$)
Table 15: Eco Fibres Market Value Chain Analysis 2023-2030 (US$)
Table 16: Eco Fibres Market Pricing Analysis 2023-2030 (US$)
Table 17: Eco Fibres Market Opportunities Analysis 2023-2030 (US$)
Table 18: Eco Fibres Market Product Life Cycle Analysis 2023-2030 (US$)
Table 19: Eco Fibres Market Supplier Analysis 2023-2030 (US$)
Table 20: Eco Fibres Market Distributor Analysis 2023-2030 (US$)
Table 21: Eco Fibres Market Trend Analysis 2023-2030 (US$)
Table 22: Eco Fibres Market Size 2023 (US$)
Table 23: Eco Fibres Market Forecast Analysis 2023-2030 (US$)
Table 24: Eco Fibres Market Sales Forecast Analysis 2023-2030 (Units)
Table 25: Eco Fibres Market, Revenue & Volume,By Type, 2023-2030 ($)
Table 26: Eco Fibres Market By Type, Revenue & Volume,By Natural Fibres, 2023-2030 ($)
Table 27: Eco Fibres Market By Type, Revenue & Volume,By Protein Fibres, 2023-2030 ($)
Table 28: Eco Fibres Market By Type, Revenue & Volume,By Cellulose Fibers, 2023-2030 ($)
Table 29: Eco Fibres Market By Type, Revenue & Volume,By Others, 2023-2030 ($)
Table 30: Eco Fibres Market By Type, Revenue & Volume,By Regenerated Fibers, 2023-2030 ($)
Table 31: Eco Fibres Market, Revenue & Volume,By Application, 2023-2030 ($)
Table 32: Eco Fibres Market By Application, Revenue & Volume,By Textiles, 2023-2030 ($)
Table 33: Eco Fibres Market By Application, Revenue & Volume,By Household & Furnishings, 2023-2030 ($)
Table 34: Eco Fibres Market By Application, Revenue & Volume,By Industrial, 2023-2030 ($)
Table 35: Eco Fibres Market By Application, Revenue & Volume,By Medical, 2023-2030 ($)
Table 36: Eco Fibres Market By Application, Revenue & Volume,By Others, 2023-2030 ($)
Table 37: North America Eco Fibres Market, Revenue & Volume,By Type, 2023-2030 ($)
Table 38: North America Eco Fibres Market, Revenue & Volume,By Application, 2023-2030 ($)
Table 39: South america Eco Fibres Market, Revenue & Volume,By Type, 2023-2030 ($)
Table 40: South america Eco Fibres Market, Revenue & Volume,By Application, 2023-2030 ($)
Table 41: Europe Eco Fibres Market, Revenue & Volume,By Type, 2023-2030 ($)
Table 42: Europe Eco Fibres Market, Revenue & Volume,By Application, 2023-2030 ($)
Table 43: APAC Eco Fibres Market, Revenue & Volume,By Type, 2023-2030 ($)
Table 44: APAC Eco Fibres Market, Revenue & Volume,By Application, 2023-2030 ($)
Table 45: Middle East & Africa Eco Fibres Market, Revenue & Volume,By Type, 2023-2030 ($)
Table 46: Middle East & Africa Eco Fibres Market, Revenue & Volume,By Application, 2023-2030 ($)
Table 47: Russia Eco Fibres Market, Revenue & Volume,By Type, 2023-2030 ($)
Table 48: Russia Eco Fibres Market, Revenue & Volume,By Application, 2023-2030 ($)
Table 49: Israel Eco Fibres Market, Revenue & Volume,By Type, 2023-2030 ($)
Table 50: Israel Eco Fibres Market, Revenue & Volume,By Application, 2023-2030 ($)
Table 51: Top Companies 2023 (US$)Eco Fibres Market, Revenue & Volume
Table 52: Product Launch 2023-2030Eco Fibres Market, Revenue & Volume
Table 53: Mergers & Acquistions 2023-2030Eco Fibres Market, Revenue & Volume
List of Figures
Figure 1: Overview of Eco Fibres Market 2023-2030
Figure 2: Market Share Analysis for Eco Fibres Market 2023 (US$)
Figure 3: Product Comparison in Eco Fibres Market 2023-2030 (US$)
Figure 4: End User Profile for Eco Fibres Market 2023-2030 (US$)
Figure 5: Patent Application and Grant in Eco Fibres Market 2013-2023* (US$)
Figure 6: Top 5 Companies Financial Analysis in Eco Fibres Market 2023-2030 (US$)
Figure 7: Market Entry Strategy in Eco Fibres Market 2023-2030
Figure 8: Ecosystem Analysis in Eco Fibres Market 2023
Figure 9: Average Selling Price in Eco Fibres Market 2023-2030
Figure 10: Top Opportunites in Eco Fibres Market 2023-2030
Figure 11: Market Life Cycle Analysis in Eco Fibres Market
Figure 12: GlobalBy TypeEco Fibres Market Revenue, 2023-2030 ($)
Figure 13: GlobalBy ApplicationEco Fibres Market Revenue, 2023-2030 ($)
Figure 14: Global Eco Fibres Market - By Geography
Figure 15: Global Eco Fibres Market Value & Volume, By Geography, 2023-2030 ($)
Figure 16: Global Eco Fibres Market CAGR, By Geography, 2023-2030 (%)
Figure 17: North America Eco Fibres Market Value & Volume, 2023-2030 ($)
Figure 18: US Eco Fibres Market Value & Volume, 2023-2030 ($)
Figure 19: US GDP and Population, 2023-2030 ($)
Figure 20: US GDP – Composition of 2023, By Sector of Origin
Figure 21: US Export and Import Value & Volume, 2023-2030 ($)
Figure 22: Canada Eco Fibres Market Value & Volume, 2023-2030 ($)
Figure 23: Canada GDP and Population, 2023-2030 ($)
Figure 24: Canada GDP – Composition of 2023, By Sector of Origin
Figure 25: Canada Export and Import Value & Volume, 2023-2030 ($)
Figure 26: Mexico Eco Fibres Market Value & Volume, 2023-2030 ($)
Figure 27: Mexico GDP and Population, 2023-2030 ($)
Figure 28: Mexico GDP – Composition of 2023, By Sector of Origin
Figure 29: Mexico Export and Import Value & Volume, 2023-2030 ($)
Figure 30: South America Eco Fibres Market Value & Volume, 2023-2030 ($)
Figure 31: Brazil Eco Fibres Market Value & Volume, 2023-2030 ($)
Figure 32: Brazil GDP and Population, 2023-2030 ($)
Figure 33: Brazil GDP – Composition of 2023, By Sector of Origin
Figure 34: Brazil Export and Import Value & Volume, 2023-2030 ($)
Figure 35: Venezuela Eco Fibres Market Value & Volume, 2023-2030 ($)
Figure 36: Venezuela GDP and Population, 2023-2030 ($)
Figure 37: Venezuela GDP – Composition of 2023, By Sector of Origin
Figure 38: Venezuela Export and Import Value & Volume, 2023-2030 ($)
Figure 39: Argentina Eco Fibres Market Value & Volume, 2023-2030 ($)
Figure 40: Argentina GDP and Population, 2023-2030 ($)
Figure 41: Argentina GDP – Composition of 2023, By Sector of Origin
Figure 42: Argentina Export and Import Value & Volume, 2023-2030 ($)
Figure 43: Ecuador Eco Fibres Market Value & Volume, 2023-2030 ($)
Figure 44: Ecuador GDP and Population, 2023-2030 ($)
Figure 45: Ecuador GDP – Composition of 2023, By Sector of Origin
Figure 46: Ecuador Export and Import Value & Volume, 2023-2030 ($)
Figure 47: Peru Eco Fibres Market Value & Volume, 2023-2030 ($)
Figure 48: Peru GDP and Population, 2023-2030 ($)
Figure 49: Peru GDP – Composition of 2023, By Sector of Origin
Figure 50: Peru Export and Import Value & Volume, 2023-2030 ($)
Figure 51: Colombia Eco Fibres Market Value & Volume, 2023-2030 ($)
Figure 52: Colombia GDP and Population, 2023-2030 ($)
Figure 53: Colombia GDP – Composition of 2023, By Sector of Origin
Figure 54: Colombia Export and Import Value & Volume, 2023-2030 ($)
Figure 55: Costa Rica Eco Fibres Market Value & Volume, 2023-2030 ($)
Figure 56: Costa Rica GDP and Population, 2023-2030 ($)
Figure 57: Costa Rica GDP – Composition of 2023, By Sector of Origin
Figure 58: Costa Rica Export and Import Value & Volume, 2023-2030 ($)
Figure 59: Europe Eco Fibres Market Value & Volume, 2023-2030 ($)
Figure 60: U.K Eco Fibres Market Value & Volume, 2023-2030 ($)
Figure 61: U.K GDP and Population, 2023-2030 ($)
Figure 62: U.K GDP – Composition of 2023, By Sector of Origin
Figure 63: U.K Export and Import Value & Volume, 2023-2030 ($)
Figure 64: Germany Eco Fibres Market Value & Volume, 2023-2030 ($)
Figure 65: Germany GDP and Population, 2023-2030 ($)
Figure 66: Germany GDP – Composition of 2023, By Sector of Origin
Figure 67: Germany Export and Import Value & Volume, 2023-2030 ($)
Figure 68: Italy Eco Fibres Market Value & Volume, 2023-2030 ($)
Figure 69: Italy GDP and Population, 2023-2030 ($)
Figure 70: Italy GDP – Composition of 2023, By Sector of Origin
Figure 71: Italy Export and Import Value & Volume, 2023-2030 ($)
Figure 72: France Eco Fibres Market Value & Volume, 2023-2030 ($)
Figure 73: France GDP and Population, 2023-2030 ($)
Figure 74: France GDP – Composition of 2023, By Sector of Origin
Figure 75: France Export and Import Value & Volume, 2023-2030 ($)
Figure 76: Netherlands Eco Fibres Market Value & Volume, 2023-2030 ($)
Figure 77: Netherlands GDP and Population, 2023-2030 ($)
Figure 78: Netherlands GDP – Composition of 2023, By Sector of Origin
Figure 79: Netherlands Export and Import Value & Volume, 2023-2030 ($)
Figure 80: Belgium Eco Fibres Market Value & Volume, 2023-2030 ($)
Figure 81: Belgium GDP and Population, 2023-2030 ($)
Figure 82: Belgium GDP – Composition of 2023, By Sector of Origin
Figure 83: Belgium Export and Import Value & Volume, 2023-2030 ($)
Figure 84: Spain Eco Fibres Market Value & Volume, 2023-2030 ($)
Figure 85: Spain GDP and Population, 2023-2030 ($)
Figure 86: Spain GDP – Composition of 2023, By Sector of Origin
Figure 87: Spain Export and Import Value & Volume, 2023-2030 ($)
Figure 88: Denmark Eco Fibres Market Value & Volume, 2023-2030 ($)
Figure 89: Denmark GDP and Population, 2023-2030 ($)
Figure 90: Denmark GDP – Composition of 2023, By Sector of Origin
Figure 91: Denmark Export and Import Value & Volume, 2023-2030 ($)
Figure 92: APAC Eco Fibres Market Value & Volume, 2023-2030 ($)
Figure 93: China Eco Fibres Market Value & Volume, 2023-2030
Figure 94: China GDP and Population, 2023-2030 ($)
Figure 95: China GDP – Composition of 2023, By Sector of Origin
Figure 96: China Export and Import Value & Volume, 2023-2030 ($)Eco Fibres Market China Export and Import Value & Volume, 2023-2030 ($)
Figure 97: Australia Eco Fibres Market Value & Volume, 2023-2030 ($)
Figure 98: Australia GDP and Population, 2023-2030 ($)
Figure 99: Australia GDP – Composition of 2023, By Sector of Origin
Figure 100: Australia Export and Import Value & Volume, 2023-2030 ($)
Figure 101: South Korea Eco Fibres Market Value & Volume, 2023-2030 ($)
Figure 102: South Korea GDP and Population, 2023-2030 ($)
Figure 103: South Korea GDP – Composition of 2023, By Sector of Origin
Figure 104: South Korea Export and Import Value & Volume, 2023-2030 ($)
Figure 105: India Eco Fibres Market Value & Volume, 2023-2030 ($)
Figure 106: India GDP and Population, 2023-2030 ($)
Figure 107: India GDP – Composition of 2023, By Sector of Origin
Figure 108: India Export and Import Value & Volume, 2023-2030 ($)
Figure 109: Taiwan Eco Fibres Market Value & Volume, 2023-2030 ($)
Figure 110: Taiwan GDP and Population, 2023-2030 ($)
Figure 111: Taiwan GDP – Composition of 2023, By Sector of Origin
Figure 112: Taiwan Export and Import Value & Volume, 2023-2030 ($)
Figure 113: Malaysia Eco Fibres Market Value & Volume, 2023-2030 ($)
Figure 114: Malaysia GDP and Population, 2023-2030 ($)
Figure 115: Malaysia GDP – Composition of 2023, By Sector of Origin
Figure 116: Malaysia Export and Import Value & Volume, 2023-2030 ($)
Figure 117: Hong Kong Eco Fibres Market Value & Volume, 2023-2030 ($)
Figure 118: Hong Kong GDP and Population, 2023-2030 ($)
Figure 119: Hong Kong GDP – Composition of 2023, By Sector of Origin
Figure 120: Hong Kong Export and Import Value & Volume, 2023-2030 ($)
Figure 121: Middle East & Africa Eco Fibres Market Middle East & Africa 3D Printing Market Value & Volume, 2023-2030 ($)
Figure 122: Russia Eco Fibres Market Value & Volume, 2023-2030 ($)
Figure 123: Russia GDP and Population, 2023-2030 ($)
Figure 124: Russia GDP – Composition of 2023, By Sector of Origin
Figure 125: Russia Export and Import Value & Volume, 2023-2030 ($)
Figure 126: Israel Eco Fibres Market Value & Volume, 2023-2030 ($)
Figure 127: Israel GDP and Population, 2023-2030 ($)
Figure 128: Israel GDP – Composition of 2023, By Sector of Origin
Figure 129: Israel Export and Import Value & Volume, 2023-2030 ($)
Figure 130: Entropy Share, By Strategies, 2023-2030* (%)Eco Fibres Market
Figure 131: Developments, 2023-2030*Eco Fibres Market
Figure 132: Company 1 Eco Fibres Market Net Revenue, By Years, 2023-2030* ($)
Figure 133: Company 1 Eco Fibres Market Net Revenue Share, By Business segments, 2023 (%)
Figure 134: Company 1 Eco Fibres Market Net Sales Share, By Geography, 2023 (%)
Figure 135: Company 2 Eco Fibres Market Net Revenue, By Years, 2023-2030* ($)
Figure 136: Company 2 Eco Fibres Market Net Revenue Share, By Business segments, 2023 (%)
Figure 137: Company 2 Eco Fibres Market Net Sales Share, By Geography, 2023 (%)
Figure 138: Company 3Eco Fibres Market Net Revenue, By Years, 2023-2030* ($)
Figure 139: Company 3Eco Fibres Market Net Revenue Share, By Business segments, 2023 (%)
Figure 140: Company 3Eco Fibres Market Net Sales Share, By Geography, 2023 (%)
Figure 141: Company 4 Eco Fibres Market Net Revenue, By Years, 2023-2030* ($)
Figure 142: Company 4 Eco Fibres Market Net Revenue Share, By Business segments, 2023 (%)
Figure 143: Company 4 Eco Fibres Market Net Sales Share, By Geography, 2023 (%)
Figure 144: Company 5 Eco Fibres Market Net Revenue, By Years, 2023-2030* ($)
Figure 145: Company 5 Eco Fibres Market Net Revenue Share, By Business segments, 2023 (%)
Figure 146: Company 5 Eco Fibres Market Net Sales Share, By Geography, 2023 (%)
Figure 147: Company 6 Eco Fibres Market Net Revenue, By Years, 2023-2030* ($)
Figure 148: Company 6 Eco Fibres Market Net Revenue Share, By Business segments, 2023 (%)
Figure 149: Company 6 Eco Fibres Market Net Sales Share, By Geography, 2023 (%)
Figure 150: Company 7 Eco Fibres Market Net Revenue, By Years, 2023-2030* ($)
Figure 151: Company 7 Eco Fibres Market Net Revenue Share, By Business segments, 2023 (%)
Figure 152: Company 7 Eco Fibres Market Net Sales Share, By Geography, 2023 (%)
Figure 153: Company 8 Eco Fibres Market Net Revenue, By Years, 2023-2030* ($)
Figure 154: Company 8 Eco Fibres Market Net Revenue Share, By Business segments, 2023 (%)
Figure 155: Company 8 Eco Fibres Market Net Sales Share, By Geography, 2023 (%)
Figure 156: Company 9 Eco Fibres Market Net Revenue, By Years, 2023-2030* ($)
Figure 157: Company 9 Eco Fibres Market Net Revenue Share, By Business segments, 2023 (%)
Figure 158: Company 9 Eco Fibres Market Net Sales Share, By Geography, 2023 (%)
Figure 159: Company 10 Eco Fibres Market Net Revenue, By Years, 2023-2030* ($)
Figure 160: Company 10 Eco Fibres Market Net Revenue Share, By Business segments, 2023 (%)
Figure 161: Company 10 Eco Fibres Market Net Sales Share, By Geography, 2023 (%)
Figure 162: Company 11 Eco Fibres Market Net Revenue, By Years, 2023-2030* ($)
Figure 163: Company 11 Eco Fibres Market Net Revenue Share, By Business segments, 2023 (%)
Figure 164: Company 11 Eco Fibres Market Net Sales Share, By Geography, 2023 (%)
Figure 165: Company 12 Eco Fibres Market Net Revenue, By Years, 2023-2030* ($)
Figure 166: Company 12 Eco Fibres Market Net Revenue Share, By Business segments, 2023 (%)
Figure 167: Company 12 Eco Fibres Market Net Sales Share, By Geography, 2023 (%)
Figure 168: Company 13Eco Fibres Market Net Revenue, By Years, 2023-2030* ($)
Figure 169: Company 13Eco Fibres Market Net Revenue Share, By Business segments, 2023 (%)
Figure 170: Company 13Eco Fibres Market Net Sales Share, By Geography, 2023 (%)
Figure 171: Company 14 Eco Fibres Market Net Revenue, By Years, 2023-2030* ($)
Figure 172: Company 14 Eco Fibres Market Net Revenue Share, By Business segments, 2023 (%)
Figure 173: Company 14 Eco Fibres Market Net Sales Share, By Geography, 2023 (%)
Figure 174: Company 15 Eco Fibres Market Net Revenue, By Years, 2023-2030* ($)
Figure 175: Company 15 Eco Fibres Market Net Revenue Share, By Business segments, 2023 (%)
Figure 176: Company 15 Eco Fibres Market Net Sales Share, By Geography, 2023 (%)