 Email
Email Print
Print


Surfactants Market- By Type ; By Application ; & By Geography - Forecast2024-2030
Surfactants Market Overview
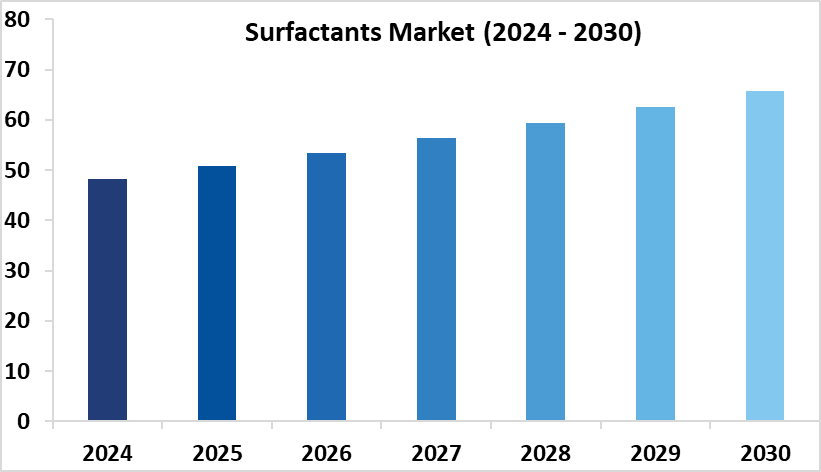
The Surfactants Market size is forecast to reach USD 65.8 billion by 2030, after growing at a CAGR of 5.3% during the forecast period 2024-2030. Surfactant manufacturers are increasingly prioritizing sustainable formulations. As environmental concerns mount, there's a noticeable shift towards developing eco-friendly surfactants derived from renewable sources such as plant-based oils or biomass. This trend aligns with consumer demands for products that minimize environmental impact and promote sustainability. The rise of bio-based surfactants is a significant trend driven by both environmental and regulatory factors. Companies are investing in research and development to create surfactants derived from natural feedstocks, reducing dependence on petrochemicals and enhancing biodegradability. This trend reflects a broader industry commitment to greener alternatives and underscores the importance of innovation in meeting sustainability goals. Surfactant manufacturers are constantly innovating to improve the performance of their products. With advancements in chemistry and technology, there's a focus on enhancing surfactant efficiency, stability, and compatibility across various applications. This trend is driven by the need to meet evolving customer requirements while maintaining competitive advantages in the market. Another notable trend is the customization and diversification of surfactant offerings. Companies are tailoring surfactant solutions to meet specific customer needs and address niche markets. By offering a diverse range of products with varying properties and functionalities, manufacturers can cater to a broader spectrum of industries and applications, fostering long-term partnerships and driving business growth.
Market Snapshot :

Report Coverage
The report “Surfactants Market – Forecast (2024-2030)”, by IndustryARC, covers an in-depth analysis of the following segments of the Surfactants Market.
By Type: Anionic Surfactants, Non-Ionic Surfactants, Cationic Surfactants, Amphoteric Surfactants and Others
By Application: Home Care, Personal Care, Industrial & Institutional Cleaners, Food & Beverages, Elastomers & Plastic Industry, Oilfield Chemicals, Agriculture, Textile, Paints & Coatings and Others
By Geography: North America (U.S, Canada, Mexico), Europe (Germany, UK, France, Italy, Spain, Russia, Netherlands and Others), APAC (China, Japan India, South Korea, Australia & New Zealand, Indonesia, Malaysia, Taiwan and Others), South America (Brazil, Argentina, Chile, Colombia and others), and RoW (Middle East and Africa).
Key Takeaways
- Asia Pacific held the largest market share with 37% in 2023. With growing environmental concerns, there's a noticeable shift towards bio-based surfactants in the Asia Pacific region. This trend aligns with global sustainability goals and addresses consumer demands for safer and more environmentally friendly products.
- Changing consumer preferences towards eco-friendly, natural, and gentle products influence the demand for surfactants in personal care, cosmetics, and household cleaning sectors. Brands respond to consumer demands by introducing products formulated with mild and sustainable surfactants, catering to the growing market for green alternatives.
- Rapid industrialization and urbanization in emerging markets fuel the demand for surfactants in construction, automotive, and agriculture sectors. As emerging economies witness infrastructural development and rising disposable incomes, there is a corresponding rise in the consumption of surfactants for various applications.
By Type - Segment Analysis
Anionic Surfactants dominated the Surfactants Market in 2023. Anionic surfactants exhibit versatile properties that make them indispensable across various industries such as personal care, household detergents, textiles, and industrial cleaners. Their ability to effectively reduce surface tension and enhance wetting properties makes them sought after in formulations for soaps, shampoos, and other cleaning agents. In comparison to other types of surfactants, anionic surfactants often offer cost-effective solutions for manufacturers. Their relatively lower production costs make them economically attractive, especially for mass-produced consumer goods where cost optimization is crucial for market competitiveness. Anionic surfactants are known for their excellent foaming and cleaning capabilities, which are highly desirable in a wide array of cleaning and personal care products. The ability to produce stable foam and efficiently remove dirt and oils from surfaces contributes significantly to their popularity among consumers and manufacturers alike. Another driving factor for the prominence of anionic surfactants is their compatibility with hard water, which is common in many regions. Unlike some other types of surfactants that may precipitate in hard water, anionic surfactants maintain their effectiveness, ensuring consistent performance in various environmental conditions.
By Application - Segment Analysis
Home Care dominated the Surfactants Market in 2023. The burgeoning demand for eco-friendly and sustainable cleaning solutions has propelled innovation and research in surfactant formulations tailored for home care applications. Manufacturers are driven by consumer preferences shifting towards greener alternatives, prompting the development of biodegradable surfactants derived from natural sources such as plant oils and renewable feedstocks. Furthermore, heightened awareness of health and hygiene amidst global pandemics has accentuated the need for effective yet safe cleaning agents, fostering a surge in demand for mild and non-toxic surfactants suitable for household use. Moreover, technological advancements have facilitated the production of surfactants with enhanced performance attributes, including superior cleaning efficacy and compatibility with various surfaces and water conditions. The rise of smart home technologies has also spurred the integration of surfactants into innovative cleaning systems, offering consumers convenience and efficiency in home maintenance. In addition, strategic collaborations between surfactant manufacturers and home care product developers have catalyzed the introduction of multifunctional formulations catering to diverse cleaning needs. As consumer preferences continue to evolve towards sustainable and efficient home care solutions, the surfactants market remains driven by innovation, environmental consciousness, and the pursuit of superior performance.
By Geography - Segment Analysis
Asia Pacific dominated the Surfactants Market in 2023. The Asia Pacific Surfactants Market is projected to experience significant growth during the forecast period. rapid urbanization and industrialization across countries like China, India, and Southeast Asian nations have propelled the demand for surfactants in various applications, including personal care products, detergents, and industrial cleaning agents. Moreover, increasing disposable incomes and changing consumer lifestyles in emerging economies have led to a surge in the consumption of surfactant-based products, further boosting market demand.
Additionally, the focus on sustainable practices and environmentally friendly products has spurred innovation in surfactant technology across the Asia Pacific. Manufacturers are increasingly investing in research and development to create eco-friendly surfactants that meet stringent regulatory standards while maintaining high performance. This emphasis on sustainability aligns with the region's commitment to environmental conservation and drives the adoption of green surfactants in diverse industries.
For more details on this report - Request for Sample
Drivers – Surfactants Market
-
The Growth of Food & Beverages Industry
The growing population and changing lifestyle have created a need to suffice the food necessities of the people, and the food and beverages industry is responding with innovative products. Now, surfactants are used as emulsifiers which are essential for the creation and stabilization of the structure in food. Moreover, with the growing awareness about healthy food, people are preferring organic food which is leading to a demand for bio-surfactants which have high biodegradability, lower toxicity, and activity at extreme temperatures. These reasons are collective aiding to an increase in the demand for surfactants in the food & beverages industry, and thus, there is an upsurge in the surfactants market size.
-
The Application of Surfactants in the Personal Care Sector
According to the United Nations, the number of people in the world who are 60 years of age or older is predicted to double (to 2.1 billion) by 2050. It is projected that between 2020 and 2050, the number of people 80 years of age or older will triple, reaching 426 million. These aged people suffer from normal geriatric conditions like hair-fall for which largely supports the hair care market and skin deterioration which leads to the sales of skin care products. This is coupled with the growing disposable income of the people in developed and developing countries which is again leading to demand growth in the personal care sector. Now, these personal care products make use of surfactants because they are good surface-active agents which is creating a huge surfactants marketplace.
Challenges – Surfactants Market
The Growing Demands of the Customers in terms of Scale and Complexity Amidst the Economic Pressure and Regulations that Limit the Production.
The increasing expectations for scale and complexity from consumers place substantial pressure on manufacturers to innovate and expand production capabilities. Customers seek diverse formulations and environmentally friendly options, necessitating research and development investments. However, economic pressures, including fluctuating raw material costs and operational expenses, impede seamless scalability. Moreover, stringent regulations, particularly regarding environmental sustainability and safety standards, further constrict production capacities. These limitations are projected to limit market revenue growth.
Market Landscape
Technology launches, acquisitions, and R&D activities are key strategies adopted by players in the Surfactants Market. in 2023, The major players in the Surfactants Market are Clariant AG, Basf SE, Kao Corporation, Evonik Industries AG, Indorama Ventures Public Company Limited, Eoc Group, Ashland Global Holdings Inc., Croda International Plc, Stepan Company, Dow Chemical Company and Others.
Developments:
- In September 2022, Stepan Company has completed the acquisition of PerformanX Specialty Chemicals, LLC's surfactant business, encompassing intellectual property, commercial ties, and inventory, with undisclosed financial details.
For more Chemicals and Materials Market reports, please click here
List of Tables
Table 1: Surfactants Market Overview 2023-2030
Table 2: Surfactants Market Leader Analysis 2023-2030 (US$)
Table 3: Surfactants MarketProduct Analysis 2023-2030 (US$)
Table 4: Surfactants MarketEnd User Analysis 2023-2030 (US$)
Table 5: Surfactants MarketPatent Analysis 2013-2023* (US$)
Table 6: Surfactants MarketFinancial Analysis 2023-2030 (US$)
Table 7: Surfactants Market Driver Analysis 2023-2030 (US$)
Table 8: Surfactants MarketChallenges Analysis 2023-2030 (US$)
Table 9: Surfactants MarketConstraint Analysis 2023-2030 (US$)
Table 10: Surfactants Market Supplier Bargaining Power Analysis 2023-2030 (US$)
Table 11: Surfactants Market Buyer Bargaining Power Analysis 2023-2030 (US$)
Table 12: Surfactants Market Threat of Substitutes Analysis 2023-2030 (US$)
Table 13: Surfactants Market Threat of New Entrants Analysis 2023-2030 (US$)
Table 14: Surfactants Market Degree of Competition Analysis 2023-2030 (US$)
Table 15: Surfactants MarketValue Chain Analysis 2023-2030 (US$)
Table 16: Surfactants MarketPricing Analysis 2023-2030 (US$)
Table 17: Surfactants MarketOpportunities Analysis 2023-2030 (US$)
Table 18: Surfactants MarketProduct Life Cycle Analysis 2023-2030 (US$)
Table 19: Surfactants MarketSupplier Analysis 2023-2030 (US$)
Table 20: Surfactants MarketDistributor Analysis 2023-2030 (US$)
Table 21: Surfactants Market Trend Analysis 2023-2030 (US$)
Table 22: Surfactants Market Size 2023 (US$)
Table 23: Surfactants Market Forecast Analysis 2023-2030 (US$)
Table 24: Surfactants Market Sales Forecast Analysis 2023-2030 (Units)
Table 25: Surfactants Market, Revenue & Volume,By Type, 2023-2030 ($)
Table 26: Surfactants MarketBy Type, Revenue & Volume,By Anionic Surfactants, 2023-2030 ($)
Table 27: Surfactants MarketBy Type, Revenue & Volume,By Alkyl Benzene Sulfonate, 2023-2030 ($)
Table 28: Surfactants MarketBy Type, Revenue & Volume,By Non-Ionic Surfactants, 2023-2030 ($)
Table 29: Surfactants MarketBy Type, Revenue & Volume,By Cationic Surfactants, 2023-2030 ($)
Table 30: Surfactants MarketBy Type, Revenue & Volume,By Amphoteric Surfactants, 2023-2030 ($)
Table 31: Surfactants Market, Revenue & Volume,By Application, 2023-2030 ($)
Table 32: Surfactants MarketBy Application, Revenue & Volume,By Personal Care, 2023-2030 ($)
Table 33: Surfactants MarketBy Application, Revenue & Volume,By Industrial & Institutional Cleaners, 2023-2030 ($)
Table 34: Surfactants MarketBy Application, Revenue & Volume,By Food & Beverages, 2023-2030 ($)
Table 35: Surfactants MarketBy Application, Revenue & Volume,By Elastomers & Plastic Industry, 2023-2030 ($)
Table 36: Surfactants MarketBy Application, Revenue & Volume,By Oilfield Chemicals, 2023-2030 ($)
Table 37: North America Surfactants Market, Revenue & Volume,By Type, 2023-2030 ($)
Table 38: North America Surfactants Market, Revenue & Volume,By Application, 2023-2030 ($)
Table 39: South america Surfactants Market, Revenue & Volume,By Type, 2023-2030 ($)
Table 40: South america Surfactants Market, Revenue & Volume,By Application, 2023-2030 ($)
Table 41: Europe Surfactants Market, Revenue & Volume,By Type, 2023-2030 ($)
Table 42: Europe Surfactants Market, Revenue & Volume,By Application, 2023-2030 ($)
Table 43: APAC Surfactants Market, Revenue & Volume,By Type, 2023-2030 ($)
Table 44: APAC Surfactants Market, Revenue & Volume,By Application, 2023-2030 ($)
Table 45: Middle East & Africa Surfactants Market, Revenue & Volume,By Type, 2023-2030 ($)
Table 46: Middle East & Africa Surfactants Market, Revenue & Volume,By Application, 2023-2030 ($)
Table 47: Russia Surfactants Market, Revenue & Volume,By Type, 2023-2030 ($)
Table 48: Russia Surfactants Market, Revenue & Volume,By Application, 2023-2030 ($)
Table 49: Israel Surfactants Market, Revenue & Volume,By Type, 2023-2030 ($)
Table 50: Israel Surfactants Market, Revenue & Volume,By Application, 2023-2030 ($)
Table 51: Top Companies 2023 (US$)Surfactants Market, Revenue & Volume,,
Table 52: Product Launch 2023-2030Surfactants Market, Revenue & Volume,,
Table 53: Mergers & Acquistions 2023-2030Surfactants Market, Revenue & Volume,,
List of Figures
Figure 1: Overview of Surfactants Market 2023-2030
Figure 2: Market Share Analysis for Surfactants Market 2023 (US$)
Figure 3: Product Comparison in Surfactants Market 2023-2030 (US$)
Figure 4: End User Profile for Surfactants Market 2023-2030 (US$)
Figure 5: Patent Application and Grant in Surfactants Market 2013-2023* (US$)
Figure 6: Top 5 Companies Financial Analysis in Surfactants Market 2023-2030 (US$)
Figure 7: Market Entry Strategy in Surfactants Market 2023-2030
Figure 8: Ecosystem Analysis in Surfactants Market2023
Figure 9: Average Selling Price in Surfactants Market 2023-2030
Figure 10: Top Opportunites in Surfactants Market 2023-2030
Figure 11: Market Life Cycle Analysis in Surfactants Market
Figure 12: GlobalBy TypeSurfactants Market Revenue, 2023-2030 ($)
Figure 13: GlobalBy ApplicationSurfactants Market Revenue, 2023-2030 ($)
Figure 14: Global Surfactants Market - By Geography
Figure 15: Global Surfactants Market Value & Volume, By Geography, 2023-2030 ($)
Figure 16: Global Surfactants Market CAGR, By Geography, 2023-2030 (%)
Figure 17: North America Surfactants Market Value & Volume, 2023-2030 ($)
Figure 18: US Surfactants Market Value & Volume, 2023-2030 ($)
Figure 19: US GDP and Population, 2023-2030 ($)
Figure 20: US GDP – Composition of 2023, By Sector of Origin
Figure 21: US Export and Import Value & Volume, 2023-2030 ($)
Figure 22: Canada Surfactants Market Value & Volume, 2023-2030 ($)
Figure 23: Canada GDP and Population, 2023-2030 ($)
Figure 24: Canada GDP – Composition of 2023, By Sector of Origin
Figure 25: Canada Export and Import Value & Volume, 2023-2030 ($)
Figure 26: Mexico Surfactants Market Value & Volume, 2023-2030 ($)
Figure 27: Mexico GDP and Population, 2023-2030 ($)
Figure 28: Mexico GDP – Composition of 2023, By Sector of Origin
Figure 29: Mexico Export and Import Value & Volume, 2023-2030 ($)
Figure 30: South America Surfactants MarketSouth America 3D Printing Market Value & Volume, 2023-2030 ($)
Figure 31: Brazil Surfactants Market Value & Volume, 2023-2030 ($)
Figure 32: Brazil GDP and Population, 2023-2030 ($)
Figure 33: Brazil GDP – Composition of 2023, By Sector of Origin
Figure 34: Brazil Export and Import Value & Volume, 2023-2030 ($)
Figure 35: Venezuela Surfactants Market Value & Volume, 2023-2030 ($)
Figure 36: Venezuela GDP and Population, 2023-2030 ($)
Figure 37: Venezuela GDP – Composition of 2023, By Sector of Origin
Figure 38: Venezuela Export and Import Value & Volume, 2023-2030 ($)
Figure 39: Argentina Surfactants Market Value & Volume, 2023-2030 ($)
Figure 40: Argentina GDP and Population, 2023-2030 ($)
Figure 41: Argentina GDP – Composition of 2023, By Sector of Origin
Figure 42: Argentina Export and Import Value & Volume, 2023-2030 ($)
Figure 43: Ecuador Surfactants Market Value & Volume, 2023-2030 ($)
Figure 44: Ecuador GDP and Population, 2023-2030 ($)
Figure 45: Ecuador GDP – Composition of 2023, By Sector of Origin
Figure 46: Ecuador Export and Import Value & Volume, 2023-2030 ($)
Figure 47: Peru Surfactants Market Value & Volume, 2023-2030 ($)
Figure 48: Peru GDP and Population, 2023-2030 ($)
Figure 49: Peru GDP – Composition of 2023, By Sector of Origin
Figure 50: Peru Export and Import Value & Volume, 2023-2030 ($)
Figure 51: Colombia Surfactants Market Value & Volume, 2023-2030 ($)
Figure 52: Colombia GDP and Population, 2023-2030 ($)
Figure 53: Colombia GDP – Composition of 2023, By Sector of Origin
Figure 54: Colombia Export and Import Value & Volume, 2023-2030 ($)
Figure 55: Costa Rica Surfactants MarketCosta Rica 3D Printing Market Value & Volume, 2023-2030 ($)
Figure 56: Costa Rica GDP and Population, 2023-2030 ($)
Figure 57: Costa Rica GDP – Composition of 2023, By Sector of Origin
Figure 58: Costa Rica Export and Import Value & Volume, 2023-2030 ($)
Figure 59: Europe Surfactants Market Value & Volume, 2023-2030 ($)
Figure 60: U.K Surfactants Market Value & Volume, 2023-2030 ($)
Figure 61: U.K GDP and Population, 2023-2030 ($)
Figure 62: U.K GDP – Composition of 2023, By Sector of Origin
Figure 63: U.K Export and Import Value & Volume, 2023-2030 ($)
Figure 64: Germany Surfactants Market Value & Volume, 2023-2030 ($)
Figure 65: Germany GDP and Population, 2023-2030 ($)
Figure 66: Germany GDP – Composition of 2023, By Sector of Origin
Figure 67: Germany Export and Import Value & Volume, 2023-2030 ($)
Figure 68: Italy Surfactants Market Value & Volume, 2023-2030 ($)
Figure 69: Italy GDP and Population, 2023-2030 ($)
Figure 70: Italy GDP – Composition of 2023, By Sector of Origin
Figure 71: Italy Export and Import Value & Volume, 2023-2030 ($)
Figure 72: France Surfactants Market Value & Volume, 2023-2030 ($)
Figure 73: France GDP and Population, 2023-2030 ($)
Figure 74: France GDP – Composition of 2023, By Sector of Origin
Figure 75: France Export and Import Value & Volume, 2023-2030 ($)
Figure 76: Netherlands Surfactants Market Value & Volume, 2023-2030 ($)
Figure 77: Netherlands GDP and Population, 2023-2030 ($)
Figure 78: Netherlands GDP – Composition of 2023, By Sector of Origin
Figure 79: Netherlands Export and Import Value & Volume, 2023-2030 ($)
Figure 80: Belgium Surfactants Market Value & Volume, 2023-2030 ($)
Figure 81: Belgium GDP and Population, 2023-2030 ($)
Figure 82: Belgium GDP – Composition of 2023, By Sector of Origin
Figure 83: Belgium Export and Import Value & Volume, 2023-2030 ($)
Figure 84: Spain Surfactants Market Value & Volume, 2023-2030 ($)
Figure 85: Spain GDP and Population, 2023-2030 ($)
Figure 86: Spain GDP – Composition of 2023, By Sector of Origin
Figure 87: Spain Export and Import Value & Volume, 2023-2030 ($)
Figure 88: Denmark Surfactants Market Value & Volume, 2023-2030 ($)
Figure 89: Denmark GDP and Population, 2023-2030 ($)
Figure 90: Denmark GDP – Composition of 2023, By Sector of Origin
Figure 91: Denmark Export and Import Value & Volume, 2023-2030 ($)
Figure 92: APAC Surfactants Market Value & Volume, 2023-2030 ($)
Figure 93: China Surfactants MarketValue & Volume, 2023-2030
Figure 94: China GDP and Population, 2023-2030 ($)
Figure 95: China GDP – Composition of 2023, By Sector of Origin
Figure 96: China Export and Import Value & Volume, 2023-2030 ($)Surfactants MarketChina Export and Import Value & Volume, 2023-2030 ($)
Figure 97: Australia Surfactants Market Value & Volume, 2023-2030 ($)
Figure 98: Australia GDP and Population, 2023-2030 ($)
Figure 99: Australia GDP – Composition of 2023, By Sector of Origin
Figure 100: Australia Export and Import Value & Volume, 2023-2030 ($)
Figure 101: South Korea Surfactants Market Value & Volume, 2023-2030 ($)
Figure 102: South Korea GDP and Population, 2023-2030 ($)
Figure 103: South Korea GDP – Composition of 2023, By Sector of Origin
Figure 104: South Korea Export and Import Value & Volume, 2023-2030 ($)
Figure 105: India Surfactants Market Value & Volume, 2023-2030 ($)
Figure 106: India GDP and Population, 2023-2030 ($)
Figure 107: India GDP – Composition of 2023, By Sector of Origin
Figure 108: India Export and Import Value & Volume, 2023-2030 ($)
Figure 109: Taiwan Surfactants MarketTaiwan 3D Printing Market Value & Volume, 2023-2030 ($)
Figure 110: Taiwan GDP and Population, 2023-2030 ($)
Figure 111: Taiwan GDP – Composition of 2023, By Sector of Origin
Figure 112: Taiwan Export and Import Value & Volume, 2023-2030 ($)
Figure 113: Malaysia Surfactants MarketMalaysia 3D Printing Market Value & Volume, 2023-2030 ($)
Figure 114: Malaysia GDP and Population, 2023-2030 ($)
Figure 115: Malaysia GDP – Composition of 2023, By Sector of Origin
Figure 116: Malaysia Export and Import Value & Volume, 2023-2030 ($)
Figure 117: Hong Kong Surfactants MarketHong Kong 3D Printing Market Value & Volume, 2023-2030 ($)
Figure 118: Hong Kong GDP and Population, 2023-2030 ($)
Figure 119: Hong Kong GDP – Composition of 2023, By Sector of Origin
Figure 120: Hong Kong Export and Import Value & Volume, 2023-2030 ($)
Figure 121: Middle East & Africa Surfactants MarketMiddle East & Africa 3D Printing Market Value & Volume, 2023-2030 ($)
Figure 122: Russia Surfactants MarketRussia 3D Printing Market Value & Volume, 2023-2030 ($)
Figure 123: Russia GDP and Population, 2023-2030 ($)
Figure 124: Russia GDP – Composition of 2023, By Sector of Origin
Figure 125: Russia Export and Import Value & Volume, 2023-2030 ($)
Figure 126: Israel Surfactants Market Value & Volume, 2023-2030 ($)
Figure 127: Israel GDP and Population, 2023-2030 ($)
Figure 128: Israel GDP – Composition of 2023, By Sector of Origin
Figure 129: Israel Export and Import Value & Volume, 2023-2030 ($)
Figure 130: Entropy Share, By Strategies, 2023-2030* (%)Surfactants Market
Figure 131: Developments, 2023-2030*Surfactants Market
Figure 132: Company 1 Surfactants Market Net Revenue, By Years, 2023-2030* ($)
Figure 133: Company 1 Surfactants Market Net Revenue Share, By Business segments, 2023 (%)
Figure 134: Company 1 Surfactants Market Net Sales Share, By Geography, 2023 (%)
Figure 135: Company 2 Surfactants Market Net Revenue, By Years, 2023-2030* ($)
Figure 136: Company 2 Surfactants Market Net Revenue Share, By Business segments, 2023 (%)
Figure 137: Company 2 Surfactants Market Net Sales Share, By Geography, 2023 (%)
Figure 138: Company 3Surfactants Market Net Revenue, By Years, 2023-2030* ($)
Figure 139: Company 3Surfactants Market Net Revenue Share, By Business segments, 2023 (%)
Figure 140: Company 3Surfactants Market Net Sales Share, By Geography, 2023 (%)
Figure 141: Company 4 Surfactants Market Net Revenue, By Years, 2023-2030* ($)
Figure 142: Company 4 Surfactants Market Net Revenue Share, By Business segments, 2023 (%)
Figure 143: Company 4 Surfactants Market Net Sales Share, By Geography, 2023 (%)
Figure 144: Company 5 Surfactants Market Net Revenue, By Years, 2023-2030* ($)
Figure 145: Company 5 Surfactants Market Net Revenue Share, By Business segments, 2023 (%)
Figure 146: Company 5 Surfactants Market Net Sales Share, By Geography, 2023 (%)
Figure 147: Company 6 Surfactants Market Net Revenue, By Years, 2023-2030* ($)
Figure 148: Company 6 Surfactants Market Net Revenue Share, By Business segments, 2023 (%)
Figure 149: Company 6 Surfactants Market Net Sales Share, By Geography, 2023 (%)
Figure 150: Company 7 Surfactants Market Net Revenue, By Years, 2023-2030* ($)
Figure 151: Company 7 Surfactants Market Net Revenue Share, By Business segments, 2023 (%)
Figure 152: Company 7 Surfactants Market Net Sales Share, By Geography, 2023 (%)
Figure 153: Company 8 Surfactants Market Net Revenue, By Years, 2023-2030* ($)
Figure 154: Company 8 Surfactants Market Net Revenue Share, By Business segments, 2023 (%)
Figure 155: Company 8 Surfactants Market Net Sales Share, By Geography, 2023 (%)
Figure 156: Company 9 Surfactants Market Net Revenue, By Years, 2023-2030* ($)
Figure 157: Company 9 Surfactants Market Net Revenue Share, By Business segments, 2023 (%)
Figure 158: Company 9 Surfactants Market Net Sales Share, By Geography, 2023 (%)
Figure 159: Company 10 Surfactants Market Net Revenue, By Years, 2023-2030* ($)
Figure 160: Company 10 Surfactants Market Net Revenue Share, By Business segments, 2023 (%)
Figure 161: Company 10 Surfactants Market Net Sales Share, By Geography, 2023 (%)
Figure 162: Company 11 Surfactants Market Net Revenue, By Years, 2023-2030* ($)
Figure 163: Company 11 Surfactants Market Net Revenue Share, By Business segments, 2023 (%)
Figure 164: Company 11 Surfactants Market Net Sales Share, By Geography, 2023 (%)
Figure 165: Company 12 Surfactants Market Net Revenue, By Years, 2023-2030* ($)
Figure 166: Company 12 Surfactants Market Net Revenue Share, By Business segments, 2023 (%)
Figure 167: Company 12 Surfactants Market Net Sales Share, By Geography, 2023 (%)
Figure 168: Company 13Surfactants Market Net Revenue, By Years, 2023-2030* ($)
Figure 169: Company 13Surfactants Market Net Revenue Share, By Business segments, 2023 (%)
Figure 170: Company 13Surfactants Market Net Sales Share, By Geography, 2023 (%)
Figure 171: Company 14 Surfactants Market Net Revenue, By Years, 2023-2030* ($)
Figure 172: Company 14 Surfactants Market Net Revenue Share, By Business segments, 2023 (%)
Figure 173: Company 14 Surfactants Market Net Sales Share, By Geography, 2023 (%)
Figure 174: Company 15 Surfactants Market Net Revenue, By Years, 2023-2030* ($)
Figure 175: Company 15 Surfactants Market Net Revenue Share, By Business segments, 2023 (%)
Figure 176: Company 15 Surfactants Market Net Sales Share, By Geography, 2023 (%)