 Email
Email Print
Print


Vitamin B6 (Pyridoxine) Market - By Drug Type, By Grade , By Distribution Channels, By Application , By End-Use Industry , By Geography - Global Opportunity Analysis & Industry Forecast, 2024 - 2030
Vitamin B6 (Pyridoxine) Market Overview
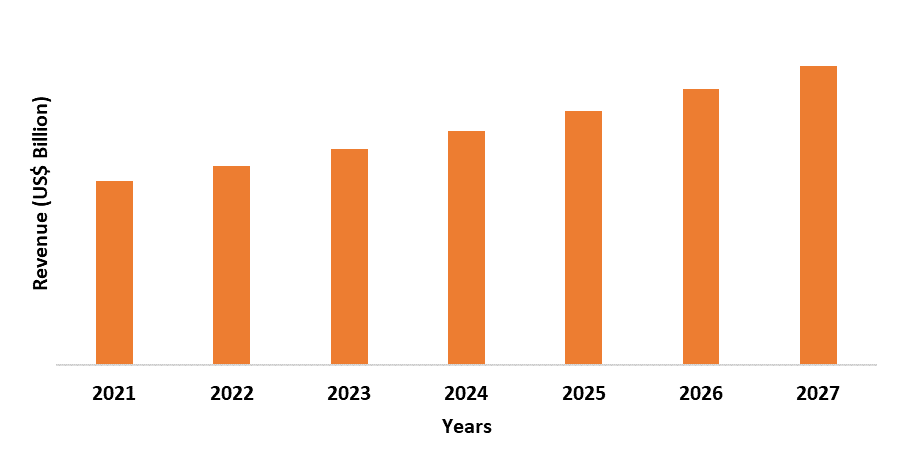
Vitamin B6 (Pyridoxine) Market Size is forecast to reach $ 712.36 Million by 2030, at a CAGR of 5.80%during forecast period 2024-2030. Vitamin B6 is a water-soluble vitamin. It occurs in different forms such as pyridoxine, pyridoxamine, pyridoxal, and their phosphorylated forms. Vitamin B6 is found in a variety of foods such as organ meats, fish, potatoes and other starchy vegetables, nuts, and non-citrus fruits. Vitamin B6 is an important co-enzyme for the metabolism of proteins. Several hormones and neurotransmitters such as serotonin, adrenalin, dopamine, histamine, and GABA are dependent on vitamin B6. It prevents the formation of homocysteine in the blood. Deficiency of vitamin B6 causes dermatitis, anaemia and can lead to a weakened immune system. Fortification of food with vitamins acts as a major driver for the vitamin B6 (pyridoxine) market during the forecast period.

COVID-19 Impact
The COVID-19 pandemic has handicapped the global market extensively resulting in several challenges most notably, supply chain disruptions, but the pandemic caused an upsurge in the sales of the pharma industry. With the increasing number of lifestyle diseases and the inclination of people towards curative nutrition and prescribed vitamin and mineral supplements, there was substantial growth in supplements even before the pandemic. COVID-19 only highlighted the importance of health and well-being. The pandemic accelerated the trend of consumers increasingly adopting proactive, holistic attitudes to health, wellness, and nutrition. According to a survey by Proactive health, 44% of US consumers have increased purchases of dietary supplements during the pandemic. This resulted in significant growth of the vitamin B6 (Pyridoxine) industry.
Report Coverage
The report: “Vitamin B6 (Pyridoxine) Market – Forecast (2024-2030)”, by IndustryARC, covers an in-depth analysis of the following segments of vitamin B6 (pyridoxine) industry.
By Drug Type: Tablets, Capsules, Gummies, Syrups, Powder and Others
By Grade: Food Type, Pharmaceutical Grade, and Others
By Distribution Channels: Pharmacies and Drug Stores, Supermarkets, Online Channels, and Others
By Application: Anaemia, Dermatitis, Fatigue, Insomnia, Muscle Cramps, Menopausal Depression, Premenstrual Syndrome, Morning Sickness, and Others
By End-Use Industry: Pharmaceuticals, Food & Beverage, Cosmetics, and Animal Feed
By Geography: North America (USA, Canada, and Mexico), Europe (UK, Germany, France, Italy, Netherlands, Spain, Russia, Belgium, and Rest of Europe), Asia-Pacific (China, Japan, India, South Korea, Australia and New Zealand, Indonesia, Taiwan, Malaysia, and Rest of APAC), South America (Brazil, Argentina, Colombia, Chile, and Rest of South America), Rest of the World (Middle East, and Africa)
Key Takeaways
- North America dominates the Vitamin B6 (Pyridoxine) Market, on account of widespread awareness regarding vitamins and supplements in the region.
- Vitamin B6 is a water-soluble vitamin. It exists in the following forms pyridoxal, pyridoxine, pyridoxamine, and their phosphorylated forms.
- Vitamin B6 is used for the prevention and treatment of low levels of pyridoxine (pyridoxine deficiency) and anaemia. It is also used for morning sickness, premenstrual syndrome (PMS), insomnia, and many other conditions.
Figure: North America Vitamin B6 (Pyridoxine) Market Revenue, 2024-2030 (US$ Billion)
For More Details on This Report - Request for Sample
Vitamin B6 (Pyridoxine) Market Segment Analysis – By Type
The tablet and capsule segment together held the largest share in the vitamin B6 (Pyridoxine) market with more than 55% in 2021. Humans and other mammals cannot synthesize vitamin B6 and thus must obtain vitamin B6 through diet. Plant-derived foods mainly contain pyridoxine and animal-derived foods contain the phosphorylated forms of pyridoxal and pyridoxamine. Vitamin B6 is available as pyridoxine hydrochloride in multivitamins, vitamin B-complex, and standalone vitamin B6 supplements. A healthy and varied diet will provide vitamin B6. However, in people with kidney diseases, cancer, malabsorption syndrome, and other conditions, vitamin B6 supplements may be necessary. Scientists have hypothesized that certain B vitamins (folic acid, vitamin B12, and vitamin B6) might reduce cardiovascular disease risk by lowering homocysteine levels. The Heart Outcomes Prevention Evaluation 2 (HOPE 2) trial, which included more than 5,500 adults with known cardiovascular disease, found that supplementation for 5 years with vitamin B6 (50 mg/day), vitamin B12 (1 mg/day), and folic acid (2.5 mg/day) reduced homocysteine levels and decreased stroke risk by about 25%. According to the U.S. Food and Drug Administration (FDA), about 28-36% of the normal population uses food supplements that contain vitamin B6 (pyridoxine). Tablets and capsules are easy to administer. Therefore, the tablet and capsule segment together account for a large share of the vitamin B6 (pyridoxine) market.
Vitamin B6 (Pyridoxine) Market Segment Analysis – By End Use Industry
The pharmaceutical segment held the largest share in the vitamin B6 (pyridoxine) market up to 45% in 2021. Vitamin B6 supplements are found to be effective for treating a genetic form of anemia. When used as a supplement vitamin B6 is safe as long as one sticks to the recommended daily amount (RDA). The RDA of vitamin B6 for adults 50 years and younger is 1.3 milligrams. After age 50, the RDA is 1.5 milligrams for women and 1.7 milligrams for men. Therapeutic doses of pyridoxine are commonly used to treat homocystinuria, cystathioninuria, rheumatic diseases, degenerative joint diseases, carpal tunnel syndrome, and premenstrual syndrome. It is also prescribed to pregnant women to lessen morning sickness. According to the American Pregnancy Association, up to 85% of pregnant women experience nausea and vomiting during the first trimester of pregnancy termed morning sickness. The American Congress of Obstetrics and Gynecology recommends 10–25 mg of vitamin B6 3-4 times a day to treat morning sickness. Based on the various conditions it is used to treat, the pharmaceutical segment is set to dominate the vitamin B6 (pyridoxine) market during the forecast period.
Vitamin B6 (Pyridoxine) Market Segment Analysis – By Geography
North America held the largest share in the Vitamin B6 (Pyridoxine) Market in 2021 up to 38%, owing to the rising geriatric population and awareness about healthy eating habits and supplementation. Furthermore, the presence of major players in this region further drives its market growth. According to the Center for Disease Control (CDC) about 659,000 Americans die from cardiovascular disease each year, that is 1 in every 4 deaths. Homocysteine is an amino acid in the blood and elevated levels have been linked to cardiovascular diseases, dementia, stroke, and osteoporosis. The most important nutrients that help lower homocysteine levels are folate, vitamin B12, and vitamin B6. According to an online survey conducted by The Harris Poll on behalf of the American Osteopathic Association of more than 2000 American adults, it was found that more than 86% of Americans take vitamins or supplements. This can be attributed to awareness regarding vitamins and their general effects on health. Hence, this region is expected to dominate the vitamin B6 (pyridoxine) market during the forecast period.
Vitamin B6 (Pyridoxine) Market Drivers
Mandatory Fortification of Food
The World Health Organization (WHO) estimates that 42% of children less than 5 years old and 40% of pregnant women worldwide are anaemic. The leading cause for this is vitamin and mineral deficiencies due to inadequate consumption of nutrient-rich food. The WHO and the United Nations Food and Agriculture Organization (FAO) have adopted four main strategies for improving dietary intake: food fortification, micronutrient supplementation, nutrition education, and disease control measures. Food fortification is the practice of adding vitamins and minerals to foods during processing to increase their nutritional value. Many countries in Europe, Africa, the Middle East, and Asia have made fortification mandatory. According to Global Fortification Data Exchange, as of 2020, 142 countries had mandatory fortification of staple food. Although B vitamins are naturally found in many foods, they are easily destroyed by alcohol and cooking. Food processing also strips foods of their B vitamin content, especially in white flour, white bread, and white rice. So, rice, bread, and flour are generally fortified with B vitamins. Ready-to-eat breakfast cereals are generally fortified with vitamin B6. According to Kellogg’s, a bowl of Kellogg’s breakfast cereal provides at least 25% of the recommended intake of six B vitamins (thiamin (B1), riboflavin (B2), niacin (B3), vitamin B6, vitamin B12, and folic acid). The federal government’s 2024-2030 Dietary Guidelines for Americans states that fortified foods and dietary supplements are useful when it is not possible otherwise to meet needs for one or more nutrients. Therefore, the fortification of food acts as a driver for the vitamin B6 (pyridoxine) market.
Increasing Prevalence of Chronic Diseases
Chronic diseases and conditions are on the rise worldwide due to the increasing geriatric population and sedentary lifestyles. According to the WHO, chronic diseases kill 41 million people each year, equivalent to 71% of all deaths globally. Cardiovascular diseases account for most chronic disease deaths, or 17.9 million people annually, followed by cancers (9.3 million), respiratory diseases (4.1 million), and diabetes (1.5 million). Vitamin B6 has been widely known for its role in the prevention of diseases. Pyridoxine hydrochloride (vitamin B6) has proven to lower homocysteine levels in the bloodstream, which may help prevent heart disease. Studies have also indicated that increasing the intake of pyridoxine hydrochloride (vitamin B6) can help lower the risks for cardiovascular disease, certain cancers, and stroke. It also helps in regulating blood sugar levels. Thus, the increasing prevalence of chronic diseases drives the market for vitamin B6.
Vitamin B6 (Pyridoxine) Market Challenges
Shortage of Vitamins
When the pandemic began, people began stocking up on essentials including vitamins. Several studies attributed vitamins and minerals aiding in recovery. The pandemic led to a spike in demand for immunity boosters. Vitamins and supplements have antioxidant, antimicrobial, and immunomodulatory properties. Vitamin B6 is usually included in multivitamin supplements and is also sold as B complex or an individual supplement. It may be listed as pyridoxal, pyridoxamine, pyridoxine hydrochloride, or pyridoxal-5-phosphate. According to India’s Bengal Chemists and Druggists Association, in 2020 the demand for certain products such as vitamin C, zinc tablets, and B complex capsules suddenly shot up. According to the Pharmaceutical and Healthcare Association of the Philippines, consumers and pharmacies have been hoarding vitamins and the sales of vitamins have surged 10 times in April 2020. According to data provided by SPINS (Chicago) on the US mainstream dietary supplement channel during the 52 weeks ending November 2020, multivitamins saw double-digit sales gains across the board, women’s multivitamins were up 19.6% to $474 million, men’s multivitamins were up 33.7% to $229 million, and children’s multivitamins were up 37.2% to $306 million. In several countries demand exceeded supply and import wasn't a solution because each country prioritized domestic supply and exports were put on hold. This resulted in shortages of vitamins. Such challenges impacted the vitamin B6 (pyridoxine) market and could prove to be a restraint if there are future lockdowns.
Vitamin B6 (Pyridoxine) Industry Outlook
Product launches, acquisitions, and R&D activities are key strategies adopted by players in this market. Vitamin B6 (Pyridoxine) top 10 companies include:
1. Tianxin Pharmaceutical
2. DSM
3. Hegno
4. Sentai
5. Guangji Pharmaceutical
6. Acebright Pharmaceuticals Group
7. BASF SE
8. Huazhong Pharmaceutical
9. HuiSheng Pharma
10. Nanjing Pharmaceutical
Key Market Players:
The Top 5 companies in the Vitamin B6 (Pyridoxine) Market are:
- Hegno
- Jiangxi Tianxin Pharmaceutical Co., Ltd.
- BASF SE
- DSM
- HuiSheng Pharma
For more Lifesciences and Healthcare Market reports, please click here