 Email
Email Print
Print


Solvents Market Overview
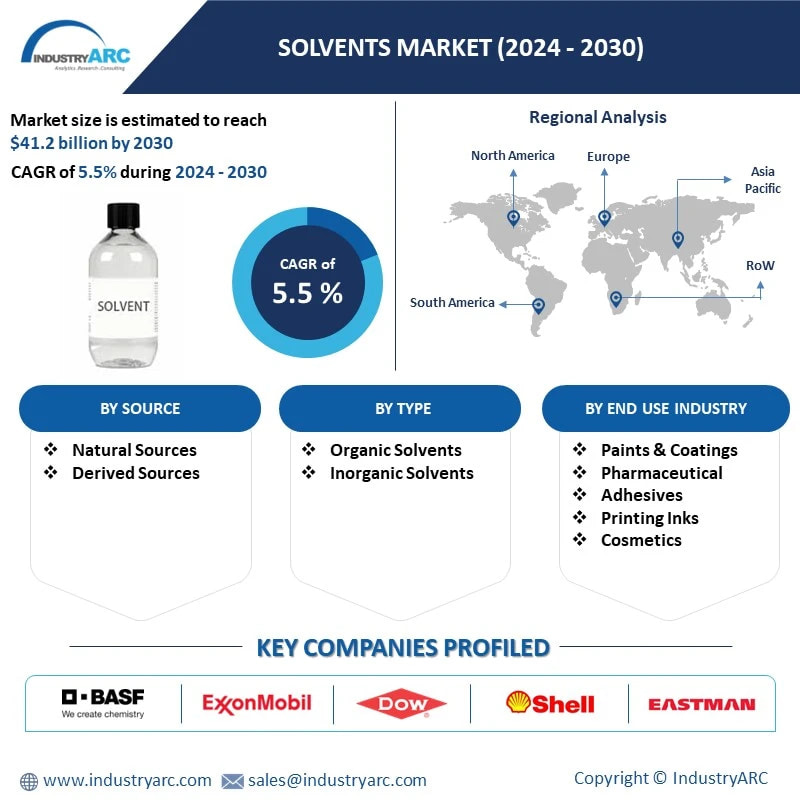
Solvents Market size is forecast to reach $41.2 billion by 2030, after growing at a CAGR of 5.5% during 2024-2030. The solvent market continues to expand driven by diverse applications in domestic, commercial, and research sectors. Solvents, typically in liquid form but also found in solid or gaseous states, facilitate the dissolution of solutes to form solutions. The infrastructure industry's moderate growth contributes to the rising demand for solvents. This solvent is a crucial component of various industries, including pharmaceuticals, chemicals, paints and coatings, and agriculture. Solvents serve as the medium for dissolving, diluting, or suspending other substances to facilitate various processes. As industries evolve and adapt to technological advancements and environmental considerations, the solvent market undergoes significant shifts. The solvent market is witnessing significant shifts driven by evolving environmental regulations and technological advancements. One prominent trend is the growing demand for eco-friendly or green solvents, fueled by increasing environmental consciousness and stringent regulations on volatile organic compound (VOC) emissions. Companies are investing in research and development to formulate solvents with lower toxicity and reduced environmental impact, catering to the rising demand for sustainable solutions across various industries. Another trend reshaping the solvent market is the surge in demand for bio-based solvents derived from renewable sources such as plants, biomass, or waste materials. This trend aligns with efforts to reduce reliance on fossil fuels and minimize carbon footprint. Bio-based solvents offer comparable performance to conventional counterparts while offering environmental benefits, driving their adoption across industries like paints and coatings, pharmaceuticals, and cosmetics. Overall, the solvent market is evolving towards sustainability, with bio-based solvents driving notable trends in the industry.
Market Snapshot:
Report Coverage
The report: “Solvents Market – Forecast (2024-2030)”, by IndustryARC, covers an in-depth analysis of the following segments of the Solvents Market Industry.
By Source: Natural Sources and Derived Sources (Petroleum Sources and Synthetic Sources)
By Type: Organic Solvents and Inorganic Solvents.
By End-Use Industry: Paints & Coatings, Pharmaceutical, Adhesives, Printing Inks, Cosmetics, Food and Beverage, Agricultural, Industrial Cleaning, Oil and Gas, Chemical, and Others
By Geography: North America (U.S., Canada, and Mexico), Europe (Germany, UK, France, Italy, Spain, Russia, and Rest of Europe), Asia-Pacific (China, India, Japan, South Korea, Australia & New Zealand, and Rest of Asia-Pacific), South America (Brazil, Argentina, and Rest of South America) and Rest of World (the Middle East and Africa)
Key Takeaways
● Asia Pacific dominated the solvents market with the share of 54%, driven by factors like industrial growth, urbanization, and expanding manufacturing sector.
● New product developments and increasing investments in research and development of solvents are expected to drive the growth of this market.
● Among applications, the paints & coatings segment is projected to lead the solvents market during the forecast period.

For More Details on This Report - Request for Sample
Solvents Market Segment Analysis - By Source
The derived Sources segment held the largest share of 84% in the solvents market in 2023. Solvents are mostly derived from petroleum and synthetic chemicals. For extending the solvent applications into newer areas these derived sources are formulated accordingly. Hydrocarbon fractions are obtained from petroleum for use in industrial processes and commercial formulations to dissolve, suspend, or transport the other ingredients of the process or formulation. In recent years, the variety of petroleum solvents has increased considerably due to the development of refinery processes designed primarily for the transformation of low-octane feedstocks to high-octane fuels, as well as due to environmental regulations and concerns.
Solvents Market Segment Analysis - By Type
The organic segment dominated the solvents market in 2023 with a revenue share of 87%. Conventional solvents consist of glycol ethers, hydrocarbons, acetate esters, alcohols, chlorinated, and ketones. Organic ones are majorly used in traditional applications, such as dry cleaning, as well as in manufacturing industries. Ketone solvents such as acetone, methyl ethyl ketone, and methyl isobutyl ketone are used across a wide range of applications including paints and coatings, adhesives, chemical processing, cleaning products, and printing inks. Ketones such as MEK are widely used in paints and coatings due to their ability to obtain low-viscosity solutions and high solid content. Ester solvents are largely used in paints as an activator or hardener and they find moderate usage as an industrial cleaner.
Solvents Market Segment Analysis - By Application
The paints & Coatings segment held the largest share in the solvents market in 2023 growing at a CAGR of 3.1% during the forecast period. This is due to the demand for construction chemicals which is expected to lead to their increasing usage in the paints & coatings application. In addition, rapid population growth, accompanied by the growing Automotive industry in the region, is expected to boost the growth of the petrochemical-based solvents segment in the paints & coatings application. Also, the growth of the automotive, OEM, machinery, and appliances markets globally is expected to drive demand for this application segment during the forecast period globally. Bio-based solvents are used in paints and coatings to dissolve binders and colors and provide consistency.
However, the spread of the novel coronavirus has started impacting ongoing construction projects in APAC, especially in India, with workers increasingly not reporting at the sites. More than 30% construction workers are staying away from work sites due to fear over coronavirus infection and many of them may have returned to their villages or are planning to do so.
Solvents Market Segment Analysis - Geography
Asia Pacific dominated the solvents market with a share of more than 54%, followed by Europe and North America. The Asia Pacific region is expected to lead the solvents market during the forecast period, owing to the increasing demand from emerging economies, such as China and India. In addition, rapid industrialization and urbanization accompanied by the rising demand for automobiles are expected to contribute to the growth of the solvents market in the region. Middle East & Africa is estimated to grow at the highest CAGR during the forecast period. The region accounts for half of the world’s oil reserves and 40% of the world’s gas reserves. This is driving the production of petrochemicals, which in turn, is expected to fuel the growth of the solvents market. Additionally, rapid growth in building & construction activities and rising demand for automobiles are expected to drive the demand for solvents in the paints & coatings application. Also, the personal care market is growing in the region, and, in turn, fueling the growth of the solvents market.
Solvents Market Drivers
Increasing demand from end-use industries
The urban population is steadily increasing in most of the developing regions. According to the World Bank, most of the countries in APAC such as India, Myanmar, Nepal, and Afghanistan have less than 35% of their population living in urban areas. These economies are expected to grow at a promising rate in the future. In developing countries, there is an increasing shift of population to Tier 1 and metro locations of the countries, which is creating a demand for residential construction. The growth of the construction industry is driving the demand for paints and coatings, which, in turn, is boosting the solvents market. Moreover, according to the International Monetary Fund (IMF), the rapid growth rate of several developing economies is expected to provide opportunities to the petrochemical-based solvent manufacturers and suppliers, especially those catering to the construction and infrastructure sectors in the emerging economies.
Solvents Market Challenges
Health effects
Exposure to petrochemical-based solvents causes both short-term and long-term effects. Short-term effects include hallucinations, blackouts, sickness, severe headaches, prolonged sniffing, and dizziness among others. Long-term effects include damage to the brain, heart, liver, neurons, and kidneys. Some solvents can cause the lungs to freeze and cause suffocation. The examples of these types of solvents include polyethylene glycols (PEGs), which cause both health and environmental hazards. During the manufacturing process, PEGs can be contaminated with a measurable amount of ethylene oxide and 1, 4- dioxane, which are known to be a human carcinogen and affects central nervous systems. Thus, the harmful effects of petrochemical-based solvents are a challenge for the solvents market.
Market Landscape
Technology launches, acquisitions and R&D activities are key strategies adopted by players in the solvents market. Major players in the solvents market are BASF SE, Exxon Mobil Corporation, Dow Chemicals, Shell Chemicals, Eastman Chemical Company, Archer-Daniels-Midland Company, Honeywell International Inc, Bharat Petroleum Corporation Limited, Huntsman International LLC, Ineos Group Limited, among others.
Product Launch/ Acquisition
● In April 2022, Solvay's Melle site in France commenced production of Rhodiasolv IRIS, a new generation solvent boasting eco-friendly qualities: non-flammable, readily biodegradable, low volatile, and non-CMR. Widely applicable in various industries including phytosanitary formulation, paint stripping, industrial cleaning, and agrochemistry.
● In September 2023, BASF introduced bio-based 2-Octyl Acrylate, boasting a 73% 14C content per ISO 16620. This expansion enhances their monomers portfolio, offering a sustainable alternative for adhesives and coatings, rivaling fossil-based counterparts like 2-ethylhexyl Acrylate and n-butyl Acrylate, with balanced solvency for diverse applications.
● In February 2023, Honeywell was chosen by Ecopetrol to conduct a prefeed engineering study for an Advanced Solvent Carbon Capture (ASCC) modular demo unit. The unit aims to assess CO2 capture from Ecopetrol's Fluid Catalytic Cracking (FCC) units, marking a significant step in sustainable energy initiatives.
For More Chemicals and Materials Market Reports, Please Click Here
1. Solvents Market - Overview
1.1 Definitions and Scope
2. Solvents Market - Executive Summary
2.1 Key Trends by Source
2.2 Key Trends by Type
2.3 Key Trends by End-Use Industry
2.4 Key Trends by Geography
3. Solvents Market - Comparative Analysis
3.1 Company Benchmarking
3.2 Global Financial Analysis
3.3 Market Share Analysis
3.4 Patent Analysis
3.5 Pricing Analysis
4. Solvents Market - Start-up Companies Scenario
4.1 Key Start-up Company Analysis by
4.1.1 Investment
4.1.2 Revenue
4.1.3 Venture Capital and Funding Scenario
5. Solvents Market – Market Entry Scenario Premium
5.1 Regulatory Framework Overview
5.2 New Business and Ease of Doing Business Index
5.3 Case Studies of Successful Ventures
6. Solvents Market - Forces
6.1 Market Drivers
6.2 Market Constraints/Challenges
6.3 Porter’s Five Force Model
6.3.1 Bargaining power of suppliers
6.3.2 Bargaining powers of customers
6.3.3 Threat of new entrants
6.3.4 Rivalry among existing players
6.3.5 Threat of Substitutes
7. Solvents Market – Strategic Analysis
7.1 Value Chain Analysis
7.2 Opportunities Analysis
7.3 Market Life Cycle
8. Solvents Market– By Source (Market Size -$Million/Billion)
8.1 Natural Sources
8.2 Derived Sources
8.2.1 Petroleum Sources
8.2.2 Synthetic Sources
9. Solvents Market– By Type (Market Size -$Million/Billion)
9.1 Organic
9.1.1 Hydrocarbon Solventss
9.1.1.1 Aliphatic
9.1.1.1.1 Heptane
9.1.1.1.2 Hexane
9.1.1.1.3 Others
9.1.1.2 Aromatic
9.1.1.2.1 Benzene
9.1.1.2.2 Toluene
9.1.1.2.3 Xylene
9.1.1.2.4 Paraxylene
9.1.1.2.5 Orthoxylene
9.1.1.2.6 Others
9.1.2 Oxygenated Solventss
9.1.2.1 Alcohols
9.1.2.1.1 Methanol
9.1.2.1.2 Ethanol
9.1.2.1.3 Propanol
9.1.2.1.4 Butanol
9.1.2.1.5 Others
9.1.2.2 Ketones
9.1.2.2.1 Acetone
9.1.2.2.2 Methyl Ethyl Ketone (MEK)
9.1.2.2.3 Methyl Isobutyl Ketone (MIBK)
9.1.2.2.4 Diisobutyl Ketone (DIBK)
9.1.2.2.5 Others
9.1.2.3 Aldehydes
9.1.2.3.1 Formaldehyde
9.1.2.3.2 Acetaldehyde
9.1.2.3.3 Others
9.1.2.4 Glycol Ethers
9.1.2.4.1 P-Series Glycol Ethers
9.1.2.4.2 E-Series Glycol Ethers
9.1.2.4.3 Others
9.1.2.5 Esters
9.1.2.5.1 Methyl Acetate
9.1.2.5.2 Ethyl Acetate
9.1.2.5.3 Butyl Acetate
9.1.2.5.4 Others
9.1.2.6 Others
9.1.3 Halogenated Solventss
9.1.4 Chlorinated
9.1.5 Brominated
9.1.6 Others
9.2 Inorganic
9.2.1 Water
9.2.2 Ammonia
9.2.3 Carbon Tetrachloride
9.2.4 Others
10. Solvents Market – By End-Use Industry (Market Size -$Million/Billion)
10.1 Paints & Coatings
10.2 Pharmaceutical
10.3 Adhesives
10.4 Printing Inks
10.5 Cosmetics
10.6 Food and Beverage
10.7 Agricultural
10.8 Industrial Cleaning
10.9 Oil and Gas
10.10 Chemical
10.11 Others
11. Solvents Market – By Geography (Market Size - $Million/$Billion)
11.1 North America
11.1.1 U.S.
11.1.2 Canada
11.1.3 Mexico
11.2 Europe
11.2.1 UK
11.2.2 Germany
11.2.3 France
11.2.4 Italy
11.2.5 Netherland
11.2.6 Spain
11.2.7 Russia
11.2.8 Belgium
11.2.9 Rest of Europe
11.3 Asia-Pacific
11.3.1 China
11.3.2 Japan
11.3.3 India
11.3.4 South Korea
11.3.5 Australia and New Zeeland
11.3.6 Rest of APAC
11.4 South America
11.4.1 Brazil
11.4.2 Argentina
11.4.3 Colombia
11.4.4 Chile
11.4.5 Rest of South America
11.5 Rest of The World
11.5.1 Middle East
11.5.2 Africa
12. Solvents Market - Entropy
13. Solvents Market – Industry/Segment Competition Landscape
13.1 Market Share Analysis
13.1.1 Global Market Share – Key Companies
13.1.2 Market Share by Region – Key Companies
13.1.3 Market Share by Countries – Key Companies
13.2 Competition Matrix
13.3 Best Practices for Companies
14. Solvents Market – Key Company List by Country Premium
15. Solvents Market- Company Analysis
15.1 BASF SE
15.2 Exxon Mobil Corporation
15.3 Dow Chemicals
15.4 Shell Chemicals
15.5 Eastman Chemical Company
15.6 Archer-Daniels-Midland Company
15.7 Honeywell International Inc
15.8 Bharat Petroleum Corporation Limited
15.9 Huntsman International LLC
15.1 Ineos Group Limited
* "Financials would be provided to private companies on best-efforts basis."
Connect with our experts to get customized reports that best suit your requirements. Our reports include global-level data, niche markets and competitive landscape.
List of Tables
Table 1: Textile Composites Market Overview 2023-2030
Table 2: Textile Composites Market Leader Analysis 2023-2030 (US$)
Table 3: Textile Composites MarketProduct Analysis 2023-2030 (US$)
Table 4: Textile Composites MarketEnd User Analysis 2023-2030 (US$)
Table 5: Textile Composites MarketPatent Analysis 2013-2023* (US$)
Table 6: Textile Composites MarketFinancial Analysis 2023-2030 (US$)
Table 7: Textile Composites Market Driver Analysis 2023-2030 (US$)
Table 8: Textile Composites MarketChallenges Analysis 2023-2030 (US$)
Table 9: Textile Composites MarketConstraint Analysis 2023-2030 (US$)
Table 10: Textile Composites Market Supplier Bargaining Power Analysis 2023-2030 (US$)
Table 11: Textile Composites Market Buyer Bargaining Power Analysis 2023-2030 (US$)
Table 12: Textile Composites Market Threat of Substitutes Analysis 2023-2030 (US$)
Table 13: Textile Composites Market Threat of New Entrants Analysis 2023-2030 (US$)
Table 14: Textile Composites Market Degree of Competition Analysis 2023-2030 (US$)
Table 15: Textile Composites MarketValue Chain Analysis 2023-2030 (US$)
Table 16: Textile Composites MarketPricing Analysis 2023-2030 (US$)
Table 17: Textile Composites MarketOpportunities Analysis 2023-2030 (US$)
Table 18: Textile Composites MarketProduct Life Cycle Analysis 2023-2030 (US$)
Table 19: Textile Composites MarketSupplier Analysis 2023-2030 (US$)
Table 20: Textile Composites MarketDistributor Analysis 2023-2030 (US$)
Table 21: Textile Composites Market Trend Analysis 2023-2030 (US$)
Table 22: Textile Composites Market Size 2023 (US$)
Table 23: Textile Composites Market Forecast Analysis 2023-2030 (US$)
Table 24: Textile Composites Market Sales Forecast Analysis 2023-2030 (Units)
Table 25: Textile Composites Market, Revenue & Volume,By Type, 2023-2030 ($)
Table 26: Textile Composites MarketBy Type, Revenue & Volume,By Organic Solvents, 2023-2030 ($)
Table 27: Textile Composites MarketBy Type, Revenue & Volume,By Hydrocarbon solvents, 2023-2030 ($)
Table 28: Textile Composites MarketBy Type, Revenue & Volume,By Oxygenated solvents, 2023-2030 ($)
Table 29: Textile Composites MarketBy Type, Revenue & Volume,By Halogenated solvents, 2023-2030 ($)
Table 30: Textile Composites MarketBy Type, Revenue & Volume,By Inorganic Solvents, 2023-2030 ($)
Table 31: Textile Composites Market, Revenue & Volume,By Source, 2023-2030 ($)
Table 32: Textile Composites MarketBy Source, Revenue & Volume,By Natural Sources, 2023-2030 ($)
Table 33: Textile Composites MarketBy Source, Revenue & Volume,By Derived Sources, 2023-2030 ($)
Table 34: Textile Composites MarketBy Source, Revenue & Volume,By Petroleum Sources, 2023-2030 ($)
Table 35: Textile Composites MarketBy Source, Revenue & Volume,By Synthetic Sources, 2023-2030 ($)
Table 36: Textile Composites Market, Revenue & Volume,By End User Industry, 2023-2030 ($)
Table 37: Textile Composites MarketBy End User Industry, Revenue & Volume,By Pharmaceuticals, 2023-2030 ($)
Table 38: Textile Composites MarketBy End User Industry, Revenue & Volume,By Food and Beverage, 2023-2030 ($)
Table 39: Textile Composites MarketBy End User Industry, Revenue & Volume,By Agricultural, 2023-2030 ($)
Table 40: Textile Composites MarketBy End User Industry, Revenue & Volume,By Automotive, 2023-2030 ($)
Table 41: Textile Composites MarketBy End User Industry, Revenue & Volume,By Industrial Cleaning, 2023-2030 ($)
Table 42: North America Textile Composites Market, Revenue & Volume,By Type, 2023-2030 ($)
Table 43: North America Textile Composites Market, Revenue & Volume,By Source, 2023-2030 ($)
Table 44: North America Textile Composites Market, Revenue & Volume,By End User Industry, 2023-2030 ($)
Table 45: South america Textile Composites Market, Revenue & Volume,By Type, 2023-2030 ($)
Table 46: South america Textile Composites Market, Revenue & Volume,By Source, 2023-2030 ($)
Table 47: South america Textile Composites Market, Revenue & Volume,By End User Industry, 2023-2030 ($)
Table 48: Europe Textile Composites Market, Revenue & Volume,By Type, 2023-2030 ($)
Table 49: Europe Textile Composites Market, Revenue & Volume,By Source, 2023-2030 ($)
Table 50: Europe Textile Composites Market, Revenue & Volume,By End User Industry, 2023-2030 ($)
Table 51: APAC Textile Composites Market, Revenue & Volume,By Type, 2023-2030 ($)
Table 52: APAC Textile Composites Market, Revenue & Volume,By Source, 2023-2030 ($)
Table 53: APAC Textile Composites Market, Revenue & Volume,By End User Industry, 2023-2030 ($)
Table 54: Middle East & Africa Textile Composites Market, Revenue & Volume,By Type, 2023-2030 ($)
Table 55: Middle East & Africa Textile Composites Market, Revenue & Volume,By Source, 2023-2030 ($)
Table 56: Middle East & Africa Textile Composites Market, Revenue & Volume,By End User Industry, 2023-2030 ($)
Table 57: Russia Textile Composites Market, Revenue & Volume,By Type, 2023-2030 ($)
Table 58: Russia Textile Composites Market, Revenue & Volume,By Source, 2023-2030 ($)
Table 59: Russia Textile Composites Market, Revenue & Volume,By End User Industry, 2023-2030 ($)
Table 60: Israel Textile Composites Market, Revenue & Volume,By Type, 2023-2030 ($)
Table 61: Israel Textile Composites Market, Revenue & Volume,By Source, 2023-2030 ($)
Table 62: Israel Textile Composites Market, Revenue & Volume,By End User Industry, 2023-2030 ($)
Table 63: Top Companies 2023 (US$)Textile Composites Market, Revenue & Volume,,
Table 64: Product Launch 2023-2030Textile Composites Market, Revenue & Volume,,
Table 65: Mergers & Acquistions 2023-2030Textile Composites Market, Revenue & Volume,,
List of Figures
Figure 1: Overview of Textile Composites Market 2023-2030
Figure 2: Market Share Analysis for Textile Composites Market 2023 (US$)
Figure 3: Product Comparison in Textile Composites Market 2023-2030 (US$)
Figure 4: End User Profile for Textile Composites Market 2023-2030 (US$)
Figure 5: Patent Application and Grant in Textile Composites Market 2013-2023* (US$)
Figure 6: Top 5 Companies Financial Analysis in Textile Composites Market 2023-2030 (US$)
Figure 7: Market Entry Strategy in Textile Composites Market 2023-2030
Figure 8: Ecosystem Analysis in Textile Composites Market2023
Figure 9: Average Selling Price in Textile Composites Market 2023-2030
Figure 10: Top Opportunites in Textile Composites Market 2023-2030
Figure 11: Market Life Cycle Analysis in Textile Composites Market
Figure 12: GlobalBy TypeTextile Composites Market Revenue, 2023-2030 ($)
Figure 13: GlobalBy SourceTextile Composites Market Revenue, 2023-2030 ($)
Figure 14: GlobalBy End User IndustryTextile Composites Market Revenue, 2023-2030 ($)
Figure 15: Global Textile Composites Market - By Geography
Figure 16: Global Textile Composites Market Value & Volume, By Geography, 2023-2030 ($)
Figure 17: Global Textile Composites Market CAGR, By Geography, 2023-2030 (%)
Figure 18: North America Textile Composites Market Value & Volume, 2023-2030 ($)
Figure 19: US Textile Composites Market Value & Volume, 2023-2030 ($)
Figure 20: US GDP and Population, 2023-2030 ($)
Figure 21: US GDP – Composition of 2023, By Sector of Origin
Figure 22: US Export and Import Value & Volume, 2023-2030 ($)
Figure 23: Canada Textile Composites Market Value & Volume, 2023-2030 ($)
Figure 24: Canada GDP and Population, 2023-2030 ($)
Figure 25: Canada GDP – Composition of 2023, By Sector of Origin
Figure 26: Canada Export and Import Value & Volume, 2023-2030 ($)
Figure 27: Mexico Textile Composites Market Value & Volume, 2023-2030 ($)
Figure 28: Mexico GDP and Population, 2023-2030 ($)
Figure 29: Mexico GDP – Composition of 2023, By Sector of Origin
Figure 30: Mexico Export and Import Value & Volume, 2023-2030 ($)
Figure 31: South America Textile Composites MarketSouth America 3D Printing Market Value & Volume, 2023-2030 ($)
Figure 32: Brazil Textile Composites Market Value & Volume, 2023-2030 ($)
Figure 33: Brazil GDP and Population, 2023-2030 ($)
Figure 34: Brazil GDP – Composition of 2023, By Sector of Origin
Figure 35: Brazil Export and Import Value & Volume, 2023-2030 ($)
Figure 36: Venezuela Textile Composites Market Value & Volume, 2023-2030 ($)
Figure 37: Venezuela GDP and Population, 2023-2030 ($)
Figure 38: Venezuela GDP – Composition of 2023, By Sector of Origin
Figure 39: Venezuela Export and Import Value & Volume, 2023-2030 ($)
Figure 40: Argentina Textile Composites Market Value & Volume, 2023-2030 ($)
Figure 41: Argentina GDP and Population, 2023-2030 ($)
Figure 42: Argentina GDP – Composition of 2023, By Sector of Origin
Figure 43: Argentina Export and Import Value & Volume, 2023-2030 ($)
Figure 44: Ecuador Textile Composites Market Value & Volume, 2023-2030 ($)
Figure 45: Ecuador GDP and Population, 2023-2030 ($)
Figure 46: Ecuador GDP – Composition of 2023, By Sector of Origin
Figure 47: Ecuador Export and Import Value & Volume, 2023-2030 ($)
Figure 48: Peru Textile Composites Market Value & Volume, 2023-2030 ($)
Figure 49: Peru GDP and Population, 2023-2030 ($)
Figure 50: Peru GDP – Composition of 2023, By Sector of Origin
Figure 51: Peru Export and Import Value & Volume, 2023-2030 ($)
Figure 52: Colombia Textile Composites Market Value & Volume, 2023-2030 ($)
Figure 53: Colombia GDP and Population, 2023-2030 ($)
Figure 54: Colombia GDP – Composition of 2023, By Sector of Origin
Figure 55: Colombia Export and Import Value & Volume, 2023-2030 ($)
Figure 56: Costa Rica Textile Composites MarketCosta Rica 3D Printing Market Value & Volume, 2023-2030 ($)
Figure 57: Costa Rica GDP and Population, 2023-2030 ($)
Figure 58: Costa Rica GDP – Composition of 2023, By Sector of Origin
Figure 59: Costa Rica Export and Import Value & Volume, 2023-2030 ($)
Figure 60: Europe Textile Composites Market Value & Volume, 2023-2030 ($)
Figure 61: U.K Textile Composites Market Value & Volume, 2023-2030 ($)
Figure 62: U.K GDP and Population, 2023-2030 ($)
Figure 63: U.K GDP – Composition of 2023, By Sector of Origin
Figure 64: U.K Export and Import Value & Volume, 2023-2030 ($)
Figure 65: Germany Textile Composites Market Value & Volume, 2023-2030 ($)
Figure 66: Germany GDP and Population, 2023-2030 ($)
Figure 67: Germany GDP – Composition of 2023, By Sector of Origin
Figure 68: Germany Export and Import Value & Volume, 2023-2030 ($)
Figure 69: Italy Textile Composites Market Value & Volume, 2023-2030 ($)
Figure 70: Italy GDP and Population, 2023-2030 ($)
Figure 71: Italy GDP – Composition of 2023, By Sector of Origin
Figure 72: Italy Export and Import Value & Volume, 2023-2030 ($)
Figure 73: France Textile Composites Market Value & Volume, 2023-2030 ($)
Figure 74: France GDP and Population, 2023-2030 ($)
Figure 75: France GDP – Composition of 2023, By Sector of Origin
Figure 76: France Export and Import Value & Volume, 2023-2030 ($)
Figure 77: Netherlands Textile Composites Market Value & Volume, 2023-2030 ($)
Figure 78: Netherlands GDP and Population, 2023-2030 ($)
Figure 79: Netherlands GDP – Composition of 2023, By Sector of Origin
Figure 80: Netherlands Export and Import Value & Volume, 2023-2030 ($)
Figure 81: Belgium Textile Composites Market Value & Volume, 2023-2030 ($)
Figure 82: Belgium GDP and Population, 2023-2030 ($)
Figure 83: Belgium GDP – Composition of 2023, By Sector of Origin
Figure 84: Belgium Export and Import Value & Volume, 2023-2030 ($)
Figure 85: Spain Textile Composites Market Value & Volume, 2023-2030 ($)
Figure 86: Spain GDP and Population, 2023-2030 ($)
Figure 87: Spain GDP – Composition of 2023, By Sector of Origin
Figure 88: Spain Export and Import Value & Volume, 2023-2030 ($)
Figure 89: Denmark Textile Composites Market Value & Volume, 2023-2030 ($)
Figure 90: Denmark GDP and Population, 2023-2030 ($)
Figure 91: Denmark GDP – Composition of 2023, By Sector of Origin
Figure 92: Denmark Export and Import Value & Volume, 2023-2030 ($)
Figure 93: APAC Textile Composites Market Value & Volume, 2023-2030 ($)
Figure 94: China Textile Composites MarketValue & Volume, 2023-2030
Figure 95: China GDP and Population, 2023-2030 ($)
Figure 96: China GDP – Composition of 2023, By Sector of Origin
Figure 97: China Export and Import Value & Volume, 2023-2030 ($)Textile Composites MarketChina Export and Import Value & Volume, 2023-2030 ($)
Figure 98: Australia Textile Composites Market Value & Volume, 2023-2030 ($)
Figure 99: Australia GDP and Population, 2023-2030 ($)
Figure 100: Australia GDP – Composition of 2023, By Sector of Origin
Figure 101: Australia Export and Import Value & Volume, 2023-2030 ($)
Figure 102: South Korea Textile Composites Market Value & Volume, 2023-2030 ($)
Figure 103: South Korea GDP and Population, 2023-2030 ($)
Figure 104: South Korea GDP – Composition of 2023, By Sector of Origin
Figure 105: South Korea Export and Import Value & Volume, 2023-2030 ($)
Figure 106: India Textile Composites Market Value & Volume, 2023-2030 ($)
Figure 107: India GDP and Population, 2023-2030 ($)
Figure 108: India GDP – Composition of 2023, By Sector of Origin
Figure 109: India Export and Import Value & Volume, 2023-2030 ($)
Figure 110: Taiwan Textile Composites MarketTaiwan 3D Printing Market Value & Volume, 2023-2030 ($)
Figure 111: Taiwan GDP and Population, 2023-2030 ($)
Figure 112: Taiwan GDP – Composition of 2023, By Sector of Origin
Figure 113: Taiwan Export and Import Value & Volume, 2023-2030 ($)
Figure 114: Malaysia Textile Composites MarketMalaysia 3D Printing Market Value & Volume, 2023-2030 ($)
Figure 115: Malaysia GDP and Population, 2023-2030 ($)
Figure 116: Malaysia GDP – Composition of 2023, By Sector of Origin
Figure 117: Malaysia Export and Import Value & Volume, 2023-2030 ($)
Figure 118: Hong Kong Textile Composites MarketHong Kong 3D Printing Market Value & Volume, 2023-2030 ($)
Figure 119: Hong Kong GDP and Population, 2023-2030 ($)
Figure 120: Hong Kong GDP – Composition of 2023, By Sector of Origin
Figure 121: Hong Kong Export and Import Value & Volume, 2023-2030 ($)
Figure 122: Middle East & Africa Textile Composites MarketMiddle East & Africa 3D Printing Market Value & Volume, 2023-2030 ($)
Figure 123: Russia Textile Composites MarketRussia 3D Printing Market Value & Volume, 2023-2030 ($)
Figure 124: Russia GDP and Population, 2023-2030 ($)
Figure 125: Russia GDP – Composition of 2023, By Sector of Origin
Figure 126: Russia Export and Import Value & Volume, 2023-2030 ($)
Figure 127: Israel Textile Composites Market Value & Volume, 2023-2030 ($)
Figure 128: Israel GDP and Population, 2023-2030 ($)
Figure 129: Israel GDP – Composition of 2023, By Sector of Origin
Figure 130: Israel Export and Import Value & Volume, 2023-2030 ($)
Figure 131: Entropy Share, By Strategies, 2023-2030* (%)Textile Composites Market
Figure 132: Developments, 2023-2030*Textile Composites Market
Figure 133: Company 1 Textile Composites Market Net Revenue, By Years, 2023-2030* ($)
Figure 134: Company 1 Textile Composites Market Net Revenue Share, By Business segments, 2023 (%)
Figure 135: Company 1 Textile Composites Market Net Sales Share, By Geography, 2023 (%)
Figure 136: Company 2 Textile Composites Market Net Revenue, By Years, 2023-2030* ($)
Figure 137: Company 2 Textile Composites Market Net Revenue Share, By Business segments, 2023 (%)
Figure 138: Company 2 Textile Composites Market Net Sales Share, By Geography, 2023 (%)
Figure 139: Company 3Textile Composites Market Net Revenue, By Years, 2023-2030* ($)
Figure 140: Company 3Textile Composites Market Net Revenue Share, By Business segments, 2023 (%)
Figure 141: Company 3Textile Composites Market Net Sales Share, By Geography, 2023 (%)
Figure 142: Company 4 Textile Composites Market Net Revenue, By Years, 2023-2030* ($)
Figure 143: Company 4 Textile Composites Market Net Revenue Share, By Business segments, 2023 (%)
Figure 144: Company 4 Textile Composites Market Net Sales Share, By Geography, 2023 (%)
Figure 145: Company 5 Textile Composites Market Net Revenue, By Years, 2023-2030* ($)
Figure 146: Company 5 Textile Composites Market Net Revenue Share, By Business segments, 2023 (%)
Figure 147: Company 5 Textile Composites Market Net Sales Share, By Geography, 2023 (%)
Figure 148: Company 6 Textile Composites Market Net Revenue, By Years, 2023-2030* ($)
Figure 149: Company 6 Textile Composites Market Net Revenue Share, By Business segments, 2023 (%)
Figure 150: Company 6 Textile Composites Market Net Sales Share, By Geography, 2023 (%)
Figure 151: Company 7 Textile Composites Market Net Revenue, By Years, 2023-2030* ($)
Figure 152: Company 7 Textile Composites Market Net Revenue Share, By Business segments, 2023 (%)
Figure 153: Company 7 Textile Composites Market Net Sales Share, By Geography, 2023 (%)
Figure 154: Company 8 Textile Composites Market Net Revenue, By Years, 2023-2030* ($)
Figure 155: Company 8 Textile Composites Market Net Revenue Share, By Business segments, 2023 (%)
Figure 156: Company 8 Textile Composites Market Net Sales Share, By Geography, 2023 (%)
Figure 157: Company 9 Textile Composites Market Net Revenue, By Years, 2023-2030* ($)
Figure 158: Company 9 Textile Composites Market Net Revenue Share, By Business segments, 2023 (%)
Figure 159: Company 9 Textile Composites Market Net Sales Share, By Geography, 2023 (%)
Figure 160: Company 10 Textile Composites Market Net Revenue, By Years, 2023-2030* ($)
Figure 161: Company 10 Textile Composites Market Net Revenue Share, By Business segments, 2023 (%)
Figure 162: Company 10 Textile Composites Market Net Sales Share, By Geography, 2023 (%)
Figure 163: Company 11 Textile Composites Market Net Revenue, By Years, 2023-2030* ($)
Figure 164: Company 11 Textile Composites Market Net Revenue Share, By Business segments, 2023 (%)
Figure 165: Company 11 Textile Composites Market Net Sales Share, By Geography, 2023 (%)
Figure 166: Company 12 Textile Composites Market Net Revenue, By Years, 2023-2030* ($)
Figure 167: Company 12 Textile Composites Market Net Revenue Share, By Business segments, 2023 (%)
Figure 168: Company 12 Textile Composites Market Net Sales Share, By Geography, 2023 (%)
Figure 169: Company 13Textile Composites Market Net Revenue, By Years, 2023-2030* ($)
Figure 170: Company 13Textile Composites Market Net Revenue Share, By Business segments, 2023 (%)
Figure 171: Company 13Textile Composites Market Net Sales Share, By Geography, 2023 (%)
Figure 172: Company 14 Textile Composites Market Net Revenue, By Years, 2023-2030* ($)
Figure 173: Company 14 Textile Composites Market Net Revenue Share, By Business segments, 2023 (%)
Figure 174: Company 14 Textile Composites Market Net Sales Share, By Geography, 2023 (%)
Figure 175: Company 15 Textile Composites Market Net Revenue, By Years, 2023-2030* ($)
Figure 176: Company 15 Textile Composites Market Net Revenue Share, By Business segments, 2023 (%)
Figure 177: Company 15 Textile Composites Market Net Sales Share, By Geography, 2023 (%)