 Email
Email Print
Print


Aluminum Chloride Market Overview:
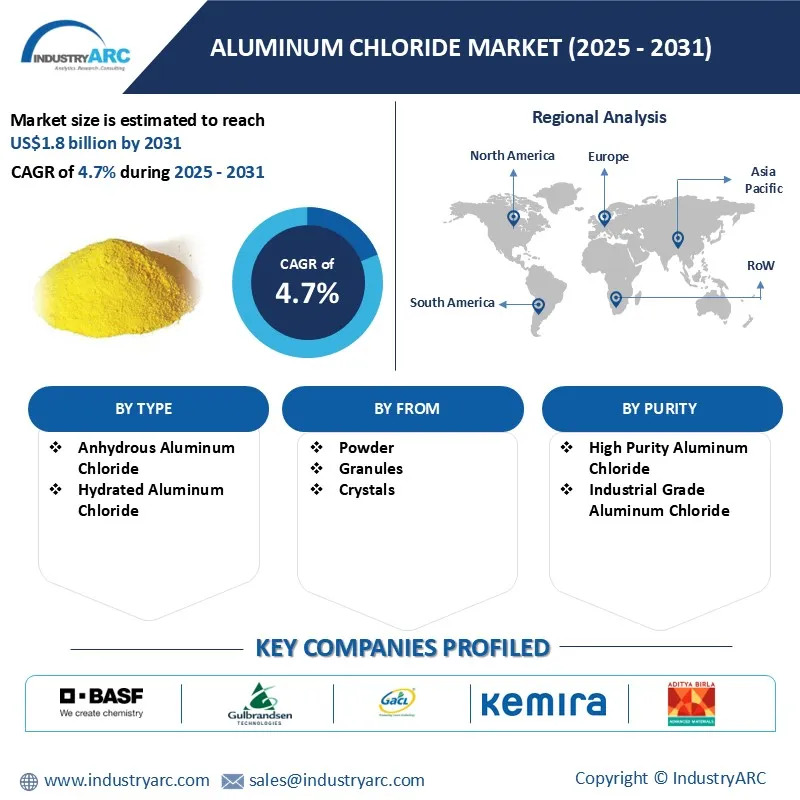
The Aluminum Chloride Market size is estimated to reach $1.8 Billion by 2031, growing at a CAGR of 4.7% during the forecast period 2025-2031. Growing demand in pharmaceutical and chemical industries for aluminum chloride is a major driver of the market. Aluminum chloride is a key compound in producing aluminum for the construction and automotive sectors. Other significant contributions come from its use as an intermediate in manufacturing acyl and alkyl compounds. Supportive government policies and investments in chemical manufacturing also improve production capability, while the consumer demand for personal care products such as antiperspirants also boosts aluminum chloride's production.
Key trends driving the aluminum chloride market are the development of high-purity grades and increasing adoption of aluminum chloride derivatives. For example, in January 2025 polyaluminum chloride (PAC), which is a derivative of aluminum salts was used as a coagulant by Iranian researchers to cleanse water and lower turbidity. PAC provides higher efficiency, lower chemical consumption, and lower sludge volumes than traditional coagulants such as aluminum sulfate. In addition, it works well over a range of pH levels, allowing it to be cost-effective and versatile. And, according to ChemX Materials Ltd., high-purity aluminum chloride (HPA) is needed for applications including lithium-ion batteries and synthetic sapphire production. HPA increases battery safety through improved thermal capacity, and its production of scratch-resistant components for electronics is critical to advancing technology and sustainability.
Market Snapshot:
Aluminum Chloride Market - Report Coverage:
The “Aluminum Chloride Market Report - Forecast (2024-2030)” by IndustryARC, covers an in-depth analysis of the following segments in the Aluminum Chloride Market.
| Attribute | Segment |
|---|---|
|
By Type |
|
|
By From |
|
|
By Purity |
|
|
By Production Method |
|
|
By Application |
|
|
By End Use Industry |
|
|
By Geography |
|
Key Takeaways:
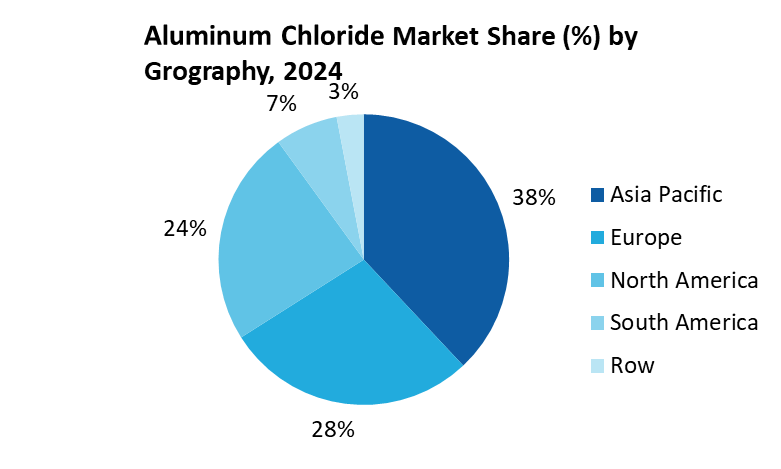
Asia-Pacific is the Largest Region
The largest region in the aluminum chloride market is Asia-Pacific. India is the world’s second largest aluminum producer, according to the Ministry of Mines, Government of India. Robust growth in the production of key minerals, including iron ore, limestone, and aluminum, underpins the region’s dominance in chemical synthesis and metallurgy applications. Ministry of Mines further states, India’s aluminum production increased by 1.2% year over year in FY 2024-25 (April–June), to 10.43 lakh tons, driven by strong demand from energy, infrastructure, and construction sectors. In addition, the region is served by large-scale manufacturing activities and exports that support market leadership in economies such as China. Sustained market growth in this region is ensured by the above factors combined.
Chemical Synthesis is the Largest Segment
Chemical synthesis is the largest segment in the aluminum chloride market by application due to its extensive use as a Lewis acid catalyst in industrial processes. Aluminum chloride is crucial in reactions including Friedel-Crafts and ClF exchange, which is a necessary route through which many chemicals are being produced. For instance, aluminum chloride is an important intermediate in dye and pigment productions. Moreover, the India Brand Equity Foundation (IBEF) estimates that the Indian textiles and apparel market will grow to US$350 billion by 2030, driven by the strong demand for key intermediates such as aluminium chloride in the synthesis of dyes and pigments which are vital to these sectors.
Anhydrous Aluminum Chloride (AAC) is the Largest Segment
Anhydrous Aluminum Chloride (AAC) is the largest segment of the aluminum chloride market by type since it is in great demand in various industries, and this is acknowledged by market-leading suppliers like Palvi FZE. AAC's greater catalytic properties are crucial in facilitating critical chemical reactions, such as Friedel-Crafts alkylation and acylation, important for the production of dyes, pharmaceuticals and hydrocarbons. AAC is also used in the manufacturing of synthetic rubber, fragrances, and specialty chemicals for paints and coatings. It is also used in agrochemical manufacturing, with the demand for crop protection solutions increasing. The India Brand Equity Foundation (IBEF) states that the Indian agrochemicals market is expected to reach US$14.5 billion by FY28, indicating a growing need for such intermediates.
Growing Demand in Pharmaceuticals and Chemical Industries
Due to aluminum chloride's application in various medical fields, growing demand from the pharmaceutical industries is significantly driving the aluminum chloride market. Pharmaceutical preparations frequently use aluminum chloride hexahydrate, particularly to treat hyperhidrosis, a condition of excessive sweating, according to ThermoFisher Scientific. Additionally, the Indian government data illustrates that the industry is of importance to the pharmaceutical sector for two reasons. First, the Indian pharmaceutical industry is growing fast and is anticipated that this value will reach $130 billion by 2030. As a pharmaceutical component, aluminum chloride is critical to the expansion of the industry and medical innovation, as India contributes to 20% of global generic drug exports.
Key Market Players:
Product/Service launches, approvals, patents and events, acquisitions, partnerships, and collaborations are key strategies adopted by players in the Aluminum Chloride Market. The top 10 companies in this industry are listed below:
1. Gulbrandsen Chemicals
2. BASF SE
3. Gujarat Alkalies and Chemicals Ltd. (GACL)
4. Kemira Oyj
5. Aditya Birla Chemicals
6. Nippon Light Metal Co., Ltd.
7. Kanto Denka Kogyo Co., Ltd.
8. Neel Chem
9. DCM Shriram
10. Base Metal Group
Scope of the Report:
| Report Metric | Details |
|---|---|
|
Base Year Considered |
2024 |
|
Forecast Period |
2025–2031 |
|
CAGR |
4.7% |
|
Market Size in 2031 |
$1.8 Billion |
|
Segments Covered |
By Type, By Form, By Purity, By Production Method, By Application, By End Use Industry and By Geography. |
|
Geographies Covered |
North America (U.S., Canada and Mexico), Europe (Germany, France, UK, Italy, Spain, Netherlands, Belgium and Rest of Europe), Asia-Pacific (China, Japan, South Korea, India, Australia & New Zealand, Malaysia and Rest of Asia-Pacific), South America (Brazil, Argentina, Chile, Colombia and Rest of South America), Rest of the World (Middle East and Africa). |
|
Key Market Players |
|
List of Tables
Table1 Aluminium Chloride Market Overview 2023-2030
Table2 Aluminium Chloride Market Leader Analysis 2023-2030 (US$)
Table3 Aluminium Chloride MarketProduct Analysis 2023-2030 (US$)
Table4 Aluminium Chloride MarketEnd User Analysis 2023-2030 (US$)
Table5 Aluminium Chloride MarketPatent Analysis 2013-2023* (US$)
Table6 Aluminium Chloride MarketFinancial Analysis 2023-2030 (US$)
Table7 Aluminium Chloride Market Driver Analysis 2023-2030 (US$)
Table8 Aluminium Chloride MarketChallenges Analysis 2023-2030 (US$)
Table9 Aluminium Chloride MarketConstraint Analysis 2023-2030 (US$)
Table10 Aluminium Chloride Market Supplier Bargaining Power Analysis 2023-2030 (US$)
Table11 Aluminium Chloride Market Buyer Bargaining Power Analysis 2023-2030 (US$)
Table12 Aluminium Chloride Market Threat of Substitutes Analysis 2023-2030 (US$)
Table13 Aluminium Chloride Market Threat of New Entrants Analysis 2023-2030 (US$)
Table14 Aluminium Chloride Market Degree of Competition Analysis 2023-2030 (US$)
Table15 Aluminium Chloride MarketValue Chain Analysis 2023-2030 (US$)
Table16 Aluminium Chloride MarketPricing Analysis 2023-2030 (US$)
Table17 Aluminium Chloride MarketOpportunities Analysis 2023-2030 (US$)
Table18 Aluminium Chloride MarketProduct Life Cycle Analysis 2023-2030 (US$)
Table19 Aluminium Chloride MarketSupplier Analysis 2023-2030 (US$)
Table20 Aluminium Chloride MarketDistributor Analysis 2023-2030 (US$)
Table21 Aluminium Chloride Market Trend Analysis 2023-2030 (US$)
Table22 Aluminium Chloride Market Size 2023 (US$)
Table23 Aluminium Chloride Market Forecast Analysis 2023-2030 (US$)
Table24 Aluminium Chloride Market Sales Forecast Analysis 2023-2030 (Units)
Table25 Aluminium Chloride Market, Revenue & Volume,By Application, 2023-2030 ($)
Table26 Aluminium Chloride MarketBy Application, Revenue & Volume,By Chemical Industry, 2023-2030 ($)
Table27 Aluminium Chloride MarketBy Application, Revenue & Volume,By Pigments and Dye Stuffs, 2023-2030 ($)
Table28 Aluminium Chloride MarketBy Application, Revenue & Volume,By Cosmetics, 2023-2030 ($)
Table29 Aluminium Chloride MarketBy Application, Revenue & Volume,By Pharmaceuticals, 2023-2030 ($)
Table30 North America Aluminium Chloride Market, Revenue & Volume,By Application, 2023-2030 ($)
Table31 South america Aluminium Chloride Market, Revenue & Volume,By Application, 2023-2030 ($)
Table32 Europe Aluminium Chloride Market, Revenue & Volume,By Application, 2023-2030 ($)
Table33 APAC Aluminium Chloride Market, Revenue & Volume,By Application, 2023-2030 ($)
Table34 Middle East & Africa Aluminium Chloride Market, Revenue & Volume,By Application, 2023-2030 ($)
Table35 Russia Aluminium Chloride Market, Revenue & Volume,By Application, 2023-2030 ($)
Table36 Israel Aluminium Chloride Market, Revenue & Volume,By Application, 2023-2030 ($)
Table37 Top Companies 2023 (US$)Aluminium Chloride Market, Revenue & Volume,,
Table38 Product Launch 2023-2030Aluminium Chloride Market, Revenue & Volume,,
Table39 Mergers & Acquistions 2023-2030Aluminium Chloride Market, Revenue & Volume,,
List of Figures
Figure 1 Overview of Aluminium Chloride Market 2023-2030
Figure 2 Market Share Analysis for Aluminium Chloride Market 2023 (US$)
Figure 3 Product Comparison in Aluminium Chloride Market 2023-2030 (US$)
Figure 4 End User Profile for Aluminium Chloride Market 2023-2030 (US$)
Figure 5 Patent Application and Grant in Aluminium Chloride Market 2013-2023* (US$)
Figure 6 Top 5 Companies Financial Analysis in Aluminium Chloride Market 2023-2030 (US$)
Figure 7 Market Entry Strategy in Aluminium Chloride Market 2023-2030
Figure 8 Ecosystem Analysis in Aluminium Chloride Market2023
Figure 9 Average Selling Price in Aluminium Chloride Market 2023-2030
Figure 10 Top Opportunites in Aluminium Chloride Market 2023-2030
Figure 11 Market Life Cycle Analysis in Aluminium Chloride Market
Figure 12 GlobalBy ApplicationAluminium Chloride Market Revenue, 2023-2030 ($)
Figure 13 Global Aluminium Chloride Market - By Geography
Figure 14 Global Aluminium Chloride Market Value & Volume, By Geography, 2023-2030 ($)
Figure 15 Global Aluminium Chloride Market CAGR, By Geography, 2023-2030 (%)
Figure 16 North America Aluminium Chloride Market Value & Volume, 2023-2030 ($)
Figure 17 US Aluminium Chloride Market Value & Volume, 2023-2030 ($)
Figure 18 US GDP and Population, 2023-2030 ($)
Figure 19 US GDP – Composition of 2023, By Sector of Origin
Figure 20 US Export and Import Value & Volume, 2023-2030 ($)
Figure 21 Canada Aluminium Chloride Market Value & Volume, 2023-2030 ($)
Figure 22 Canada GDP and Population, 2023-2030 ($)
Figure 23 Canada GDP – Composition of 2023, By Sector of Origin
Figure 24 Canada Export and Import Value & Volume, 2023-2030 ($)
Figure 25 Mexico Aluminium Chloride Market Value & Volume, 2023-2030 ($)
Figure 26 Mexico GDP and Population, 2023-2030 ($)
Figure 27 Mexico GDP – Composition of 2023, By Sector of Origin
Figure 28 Mexico Export and Import Value & Volume, 2023-2030 ($)
Figure 29 South America Aluminium Chloride MarketSouth America 3D Printing Market Value & Volume, 2023-2030 ($)
Figure 30 Brazil Aluminium Chloride Market Value & Volume, 2023-2030 ($)
Figure 31 Brazil GDP and Population, 2023-2030 ($)
Figure 32 Brazil GDP – Composition of 2023, By Sector of Origin
Figure 33 Brazil Export and Import Value & Volume, 2023-2030 ($)
Figure 34 Venezuela Aluminium Chloride Market Value & Volume, 2023-2030 ($)
Figure 35 Venezuela GDP and Population, 2023-2030 ($)
Figure 36 Venezuela GDP – Composition of 2023, By Sector of Origin
Figure 37 Venezuela Export and Import Value & Volume, 2023-2030 ($)
Figure 38 Argentina Aluminium Chloride Market Value & Volume, 2023-2030 ($)
Figure 39 Argentina GDP and Population, 2023-2030 ($)
Figure 40 Argentina GDP – Composition of 2023, By Sector of Origin
Figure 41 Argentina Export and Import Value & Volume, 2023-2030 ($)
Figure 42 Ecuador Aluminium Chloride Market Value & Volume, 2023-2030 ($)
Figure 43 Ecuador GDP and Population, 2023-2030 ($)
Figure 44 Ecuador GDP – Composition of 2023, By Sector of Origin
Figure 45 Ecuador Export and Import Value & Volume, 2023-2030 ($)
Figure 46 Peru Aluminium Chloride Market Value & Volume, 2023-2030 ($)
Figure 47 Peru GDP and Population, 2023-2030 ($)
Figure 48 Peru GDP – Composition of 2023, By Sector of Origin
Figure 49 Peru Export and Import Value & Volume, 2023-2030 ($)
Figure 50 Colombia Aluminium Chloride Market Value & Volume, 2023-2030 ($)
Figure 51 Colombia GDP and Population, 2023-2030 ($)
Figure 52 Colombia GDP – Composition of 2023, By Sector of Origin
Figure 53 Colombia Export and Import Value & Volume, 2023-2030 ($)
Figure 54 Costa Rica Aluminium Chloride MarketCosta Rica 3D Printing Market Value & Volume, 2023-2030 ($)
Figure 55 Costa Rica GDP and Population, 2023-2030 ($)
Figure 56 Costa Rica GDP – Composition of 2023, By Sector of Origin
Figure 57 Costa Rica Export and Import Value & Volume, 2023-2030 ($)
Figure 58 Europe Aluminium Chloride Market Value & Volume, 2023-2030 ($)
Figure 59 U.K Aluminium Chloride Market Value & Volume, 2023-2030 ($)
Figure 60 U.K GDP and Population, 2023-2030 ($)
Figure 61 U.K GDP – Composition of 2023, By Sector of Origin
Figure 62 U.K Export and Import Value & Volume, 2023-2030 ($)
Figure 63 Germany Aluminium Chloride Market Value & Volume, 2023-2030 ($)
Figure 64 Germany GDP and Population, 2023-2030 ($)
Figure 65 Germany GDP – Composition of 2023, By Sector of Origin
Figure 66 Germany Export and Import Value & Volume, 2023-2030 ($)
Figure 67 Italy Aluminium Chloride Market Value & Volume, 2023-2030 ($)
Figure 68 Italy GDP and Population, 2023-2030 ($)
Figure 69 Italy GDP – Composition of 2023, By Sector of Origin
Figure 70 Italy Export and Import Value & Volume, 2023-2030 ($)
Figure 71 France Aluminium Chloride Market Value & Volume, 2023-2030 ($)
Figure 72 France GDP and Population, 2023-2030 ($)
Figure 73 France GDP – Composition of 2023, By Sector of Origin
Figure 74 France Export and Import Value & Volume, 2023-2030 ($)
Figure 75 Netherlands Aluminium Chloride Market Value & Volume, 2023-2030 ($)
Figure 76 Netherlands GDP and Population, 2023-2030 ($)
Figure 77 Netherlands GDP – Composition of 2023, By Sector of Origin
Figure 78 Netherlands Export and Import Value & Volume, 2023-2030 ($)
Figure 79 Belgium Aluminium Chloride Market Value & Volume, 2023-2030 ($)
Figure 80 Belgium GDP and Population, 2023-2030 ($)
Figure 81 Belgium GDP – Composition of 2023, By Sector of Origin
Figure 82 Belgium Export and Import Value & Volume, 2023-2030 ($)
Figure 83 Spain Aluminium Chloride Market Value & Volume, 2023-2030 ($)
Figure 84 Spain GDP and Population, 2023-2030 ($)
Figure 85 Spain GDP – Composition of 2023, By Sector of Origin
Figure 86 Spain Export and Import Value & Volume, 2023-2030 ($)
Figure 87 Denmark Aluminium Chloride Market Value & Volume, 2023-2030 ($)
Figure 88 Denmark GDP and Population, 2023-2030 ($)
Figure 89 Denmark GDP – Composition of 2023, By Sector of Origin
Figure 90 Denmark Export and Import Value & Volume, 2023-2030 ($)
Figure 91 APAC Aluminium Chloride Market Value & Volume, 2023-2030 ($)
Figure 92 China Aluminium Chloride MarketValue & Volume, 2023-2030
Figure 93 China GDP and Population, 2023-2030 ($)
Figure 94 China GDP – Composition of 2023, By Sector of Origin
Figure 95 China Export and Import Value & Volume, 2023-2030 ($)Aluminium Chloride MarketChina Export and Import Value & Volume, 2023-2030 ($)
Figure 96 Australia Aluminium Chloride Market Value & Volume, 2023-2030 ($)
Figure 97 Australia GDP and Population, 2023-2030 ($)
Figure 98 Australia GDP – Composition of 2023, By Sector of Origin
Figure 99 Australia Export and Import Value & Volume, 2023-2030 ($)
Figure 100 South Korea Aluminium Chloride Market Value & Volume, 2023-2030 ($)
Figure 101 South Korea GDP and Population, 2023-2030 ($)
Figure 102 South Korea GDP – Composition of 2023, By Sector of Origin
Figure 103 South Korea Export and Import Value & Volume, 2023-2030 ($)
Figure 104 India Aluminium Chloride Market Value & Volume, 2023-2030 ($)
Figure 105 India GDP and Population, 2023-2030 ($)
Figure 106 India GDP – Composition of 2023, By Sector of Origin
Figure 107 India Export and Import Value & Volume, 2023-2030 ($)
Figure 108 Taiwan Aluminium Chloride MarketTaiwan 3D Printing Market Value & Volume, 2023-2030 ($)
Figure 109 Taiwan GDP and Population, 2023-2030 ($)
Figure 110 Taiwan GDP – Composition of 2023, By Sector of Origin
Figure 111 Taiwan Export and Import Value & Volume, 2023-2030 ($)
Figure 112 Malaysia Aluminium Chloride MarketMalaysia 3D Printing Market Value & Volume, 2023-2030 ($)
Figure 113 Malaysia GDP and Population, 2023-2030 ($)
Figure 114 Malaysia GDP – Composition of 2023, By Sector of Origin
Figure 115 Malaysia Export and Import Value & Volume, 2023-2030 ($)
Figure 116 Hong Kong Aluminium Chloride MarketHong Kong 3D Printing Market Value & Volume, 2023-2030 ($)
Figure 117 Hong Kong GDP and Population, 2023-2030 ($)
Figure 118 Hong Kong GDP – Composition of 2023, By Sector of Origin
Figure 119 Hong Kong Export and Import Value & Volume, 2023-2030 ($)
Figure 120 Middle East & Africa Aluminium Chloride MarketMiddle East & Africa 3D Printing Market Value & Volume, 2023-2030 ($)
Figure 121 Russia Aluminium Chloride MarketRussia 3D Printing Market Value & Volume, 2023-2030 ($)
Figure 122 Russia GDP and Population, 2023-2030 ($)
Figure 123 Russia GDP – Composition of 2023, By Sector of Origin
Figure 124 Russia Export and Import Value & Volume, 2023-2030 ($)
Figure 125 Israel Aluminium Chloride Market Value & Volume, 2023-2030 ($)
Figure 126 Israel GDP and Population, 2023-2030 ($)
Figure 127 Israel GDP – Composition of 2023, By Sector of Origin
Figure 128 Israel Export and Import Value & Volume, 2023-2030 ($)
Figure 129 Entropy Share, By Strategies, 2023-2030* (%)Aluminium Chloride Market
Figure 130 Developments, 2023-2030*Aluminium Chloride Market
Figure 131 Company 1 Aluminium Chloride Market Net Revenue, By Years, 2023-2030* ($)
Figure 132 Company 1 Aluminium Chloride Market Net Revenue Share, By Business segments, 2023 (%)
Figure 133 Company 1 Aluminium Chloride Market Net Sales Share, By Geography, 2023 (%)
Figure 134 Company 2 Aluminium Chloride Market Net Revenue, By Years, 2023-2030* ($)
Figure 135 Company 2 Aluminium Chloride Market Net Revenue Share, By Business segments, 2023 (%)
Figure 136 Company 2 Aluminium Chloride Market Net Sales Share, By Geography, 2023 (%)
Figure 137 Company 3Aluminium Chloride Market Net Revenue, By Years, 2023-2030* ($)
Figure 138 Company 3Aluminium Chloride Market Net Revenue Share, By Business segments, 2023 (%)
Figure 139 Company 3Aluminium Chloride Market Net Sales Share, By Geography, 2023 (%)
Figure 140 Company 4 Aluminium Chloride Market Net Revenue, By Years, 2023-2030* ($)
Figure 141 Company 4 Aluminium Chloride Market Net Revenue Share, By Business segments, 2023 (%)
Figure 142 Company 4 Aluminium Chloride Market Net Sales Share, By Geography, 2023 (%)
Figure 143 Company 5 Aluminium Chloride Market Net Revenue, By Years, 2023-2030* ($)
Figure 144 Company 5 Aluminium Chloride Market Net Revenue Share, By Business segments, 2023 (%)
Figure 145 Company 5 Aluminium Chloride Market Net Sales Share, By Geography, 2023 (%)
Figure 146 Company 6 Aluminium Chloride Market Net Revenue, By Years, 2023-2030* ($)
Figure 147 Company 6 Aluminium Chloride Market Net Revenue Share, By Business segments, 2023 (%)
Figure 148 Company 6 Aluminium Chloride Market Net Sales Share, By Geography, 2023 (%)
Figure 149 Company 7 Aluminium Chloride Market Net Revenue, By Years, 2023-2030* ($)
Figure 150 Company 7 Aluminium Chloride Market Net Revenue Share, By Business segments, 2023 (%)
Figure 151 Company 7 Aluminium Chloride Market Net Sales Share, By Geography, 2023 (%)
Figure 152 Company 8 Aluminium Chloride Market Net Revenue, By Years, 2023-2030* ($)
Figure 153 Company 8 Aluminium Chloride Market Net Revenue Share, By Business segments, 2023 (%)
Figure 154 Company 8 Aluminium Chloride Market Net Sales Share, By Geography, 2023 (%)
Figure 155 Company 9 Aluminium Chloride Market Net Revenue, By Years, 2023-2030* ($)
Figure 156 Company 9 Aluminium Chloride Market Net Revenue Share, By Business segments, 2023 (%)
Figure 157 Company 9 Aluminium Chloride Market Net Sales Share, By Geography, 2023 (%)
Figure 158 Company 10 Aluminium Chloride Market Net Revenue, By Years, 2023-2030* ($)
Figure 159 Company 10 Aluminium Chloride Market Net Revenue Share, By Business segments, 2023 (%)
Figure 160 Company 10 Aluminium Chloride Market Net Sales Share, By Geography, 2023 (%)
Figure 161 Company 11 Aluminium Chloride Market Net Revenue, By Years, 2023-2030* ($)
Figure 162 Company 11 Aluminium Chloride Market Net Revenue Share, By Business segments, 2023 (%)
Figure 163 Company 11 Aluminium Chloride Market Net Sales Share, By Geography, 2023 (%)
Figure 164 Company 12 Aluminium Chloride Market Net Revenue, By Years, 2023-2030* ($)
Figure 165 Company 12 Aluminium Chloride Market Net Revenue Share, By Business segments, 2023 (%)
Figure 166 Company 12 Aluminium Chloride Market Net Sales Share, By Geography, 2023 (%)
Figure 167 Company 13Aluminium Chloride Market Net Revenue, By Years, 2023-2030* ($)
Figure 168 Company 13Aluminium Chloride Market Net Revenue Share, By Business segments, 2023 (%)
Figure 169 Company 13Aluminium Chloride Market Net Sales Share, By Geography, 2023 (%)
Figure 170 Company 14 Aluminium Chloride Market Net Revenue, By Years, 2023-2030* ($)
Figure 171 Company 14 Aluminium Chloride Market Net Revenue Share, By Business segments, 2023 (%)
Figure 172 Company 14 Aluminium Chloride Market Net Sales Share, By Geography, 2023 (%)
Figure 173 Company 15 Aluminium Chloride Market Net Revenue, By Years, 2023-2030* ($)
Figure 174 Company 15 Aluminium Chloride Market Net Revenue Share, By Business segments, 2023 (%)
Figure 175 Company 15 Aluminium Chloride Market Net Sales Share, By Geography, 2023 (%)
The Aluminum Chloride Market is projected to grow at 4.7% CAGR during the forecast period 2025-2031.
The Aluminum Chloride Market size is projected to reach $1.8 billion by 2031 from $1.4 billion in 2024.
Q3. Which are the leading players in the Aluminum Chloride Market?\\\\r\\\\nThe leading players in the Aluminum Chloride Market are Gulbrandsen Chemicals, BASF SE, Gujarat Alkalies and Chemicals Ltd. (GACL), Kemira Oyj, Aditya Birla Chemicals and Others.\\\\r\\\\n