 Email
Email Print
Print


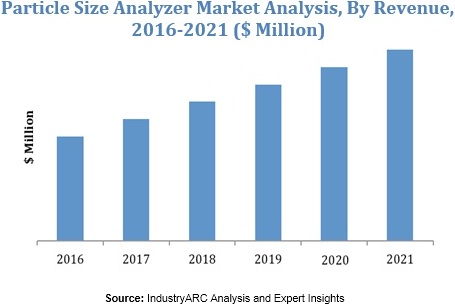
Particle Size Analyzer Market - Forecast(2025 - 2031)
A particle size analyser is used for determining the size of minute particles. The particle maybe in a liquid or in a powder format. A particle size analyser is used in to determine particle sizes which are can then be used for manufacturing products across a number of industries. Particle size analysis comes under the larger bracket of test and measurement which in itself is a growing and necessary market across all industry verticals. Increasing investment in nanotechnology is further driving the market for particle analysers as well as a requirement for more powerful analysers.
The particle size analyser market has been divided into six key segments based on technology. The laser diffraction had the highest contribution to the particle size analyser market in 2015. Its high contribution is due to the analyser ability to work across a wide spectrum which makes it suitable across all application segments.
Increasing government spending across the globe on pharmaceutical R&D, stringent quality tests and increasing number of research clinics especially in the APAC region are key drivers for the particle size analyser market. In spite of the various advantages associated with particle analysers, these devices are expensive and in case the same have to be imported, the duties applied on them are extremely high thereby preventing many nations from importing the number of analysers that they would have originally hoped for.
In terms of regional distribution, North America accounted for the largest share of around 35% in the particle analyser market. The APAC market however is expected to have the highest CAGR during the forecast period and this can be understood from the fact that a number of research facilities are being developed in the region which is serving as a global base for R&D for a number of organizations around the world.
In terms of technology, the market has been divided into the following Laser Diffraction, DLS, Dynamic imaging, Static imaging, Coulter Principle and Nanoparticle tracking analysis. The Particle Size Analyzer market has also been segmented by the following industries Healthcare, Chemicals & Petroleum and Food & Beverage. The Particle Size Analyzer market has also been segmented by the following dispersion types Wet particle size, Dry particle size and Spray particle size. The Particle Size Analyzer market has also been segmented by the following geographies Americas, APAC, Europe and ROW.
Following are just a few of the companies that are operating in the Particle size analyzer market:
- Agilent Technologies, Inc. (Particle Sizing Systems)
- Beckman Coulter, Inc. (Danaher Corporation)
- Cilas (Compagnie Industrielle Des Lasers)
- Horiba, Ltd.
- IZON Science Limited
List of Tables
Table 1 Particle Size Analyzer Market Overview 2023-2030
Table 2 Particle Size Analyzer Market Leader Analysis 2023-2030 (US$)
Table 3 Particle Size Analyzer MarketProduct Analysis 2023-2030 (US$)
Table 4 Particle Size Analyzer MarketEnd User Analysis 2023-2030 (US$)
Table 5 Particle Size Analyzer MarketPatent Analysis 2013-2023* (US$)
Table 6 Particle Size Analyzer MarketFinancial Analysis 2023-2030 (US$)
Table 7 Particle Size Analyzer Market Driver Analysis 2023-2030 (US$)
Table 8 Particle Size Analyzer MarketChallenges Analysis 2023-2030 (US$)
Table 9 Particle Size Analyzer MarketConstraint Analysis 2023-2030 (US$)
Table 10 Particle Size Analyzer Market Supplier Bargaining Power Analysis 2023-2030 (US$)
Table 11 Particle Size Analyzer Market Buyer Bargaining Power Analysis 2023-2030 (US$)
Table 12 Particle Size Analyzer Market Threat of Substitutes Analysis 2023-2030 (US$)
Table 13 Particle Size Analyzer Market Threat of New Entrants Analysis 2023-2030 (US$)
Table 14 Particle Size Analyzer Market Degree of Competition Analysis 2023-2030 (US$)
Table 15 Particle Size Analyzer MarketValue Chain Analysis 2023-2030 (US$)
Table 16 Particle Size Analyzer MarketPricing Analysis 2023-2030 (US$)
Table 17 Particle Size Analyzer MarketOpportunities Analysis 2023-2030 (US$)
Table 18 Particle Size Analyzer MarketProduct Life Cycle Analysis 2023-2030 (US$)
Table 19 Particle Size Analyzer MarketSupplier Analysis 2023-2030 (US$)
Table 20 Particle Size Analyzer MarketDistributor Analysis 2023-2030 (US$)
Table 21 Particle Size Analyzer Market Trend Analysis 2023-2030 (US$)
Table 22 Particle Size Analyzer Market Size 2023 (US$)
Table 23 Particle Size Analyzer Market Forecast Analysis 2023-2030 (US$)
Table 24 Particle Size Analyzer Market Sales Forecast Analysis 2023-2030 (Units)
Table 25 Particle Size Analyzer Market, Revenue & Volume,By Type, 2023-2030 ($)
Table 26 Particle Size Analyzer MarketBy Type, Revenue & Volume,By Wet particle analysis, 2023-2030 ($)
Table 27 Particle Size Analyzer MarketBy Type, Revenue & Volume,By Dry particle analysis, 2023-2030 ($)
Table 28 Particle Size Analyzer MarketBy Type, Revenue & Volume,By Spray particle analysis, 2023-2030 ($)
Table 29 North America Particle Size Analyzer Market, Revenue & Volume,By Type, 2023-2030 ($)
Table 30 South america Particle Size Analyzer Market, Revenue & Volume,By Type, 2023-2030 ($)
Table 31 Europe Particle Size Analyzer Market, Revenue & Volume,By Type, 2023-2030 ($)
Table 32 APAC Particle Size Analyzer Market, Revenue & Volume,By Type, 2023-2030 ($)
Table 33 Middle East & Africa Particle Size Analyzer Market, Revenue & Volume,By Type, 2023-2030 ($)
Table 34 Russia Particle Size Analyzer Market, Revenue & Volume,By Type, 2023-2030 ($)
Table 35 Israel Particle Size Analyzer Market, Revenue & Volume,By Type, 2023-2030 ($)
Table 36 Top Companies 2023 (US$)Particle Size Analyzer Market, Revenue & Volume,,
Table 37 Product Launch 2023-2030Particle Size Analyzer Market, Revenue & Volume,,
Table 38 Mergers & Acquistions 2023-2030Particle Size Analyzer Market, Revenue & Volume,,
List of Figures
Figure 1 Overview of Particle Size Analyzer Market 2023-2030
Figure 2 Market Share Analysis for Particle Size Analyzer Market 2023 (US$)
Figure 3 Product Comparison in Particle Size Analyzer Market 2023-2030 (US$)
Figure 4 End User Profile for Particle Size Analyzer Market 2023-2030 (US$)
Figure 5 Patent Application and Grant in Particle Size Analyzer Market 2013-2023* (US$)
Figure 6 Top 5 Companies Financial Analysis in Particle Size Analyzer Market 2023-2030 (US$)
Figure 7 Market Entry Strategy in Particle Size Analyzer Market 2023-2030
Figure 8 Ecosystem Analysis in Particle Size Analyzer Market2023
Figure 9 Average Selling Price in Particle Size Analyzer Market 2023-2030
Figure 10 Top Opportunites in Particle Size Analyzer Market 2023-2030
Figure 11 Market Life Cycle Analysis in Particle Size Analyzer Market
Figure 12 GlobalBy TypeParticle Size Analyzer Market Revenue, 2023-2030 ($)
Figure 13 GlobalBy TechnologyParticle Size Analyzer Market Revenue, 2023-2030 ($)
Figure 14 Global Particle Size Analyzer Market - By Geography
Figure 15 Global Particle Size Analyzer Market Value & Volume, By Geography, 2023-2030 ($)
Figure 16 Global Particle Size Analyzer Market CAGR, By Geography, 2023-2030 (%)
Figure 17 North America Particle Size Analyzer Market Value & Volume, 2023-2030 ($)
Figure 18 US Particle Size Analyzer Market Value & Volume, 2023-2030 ($)
Figure 19 US GDP and Population, 2023-2030 ($)
Figure 20 US GDP – Composition of 2023, By Sector of Origin
Figure 21 US Export and Import Value & Volume, 2023-2030 ($)
Figure 22 Canada Particle Size Analyzer Market Value & Volume, 2023-2030 ($)
Figure 23 Canada GDP and Population, 2023-2030 ($)
Figure 24 Canada GDP – Composition of 2023, By Sector of Origin
Figure 25 Canada Export and Import Value & Volume, 2023-2030 ($)
Figure 26 Mexico Particle Size Analyzer Market Value & Volume, 2023-2030 ($)
Figure 27 Mexico GDP and Population, 2023-2030 ($)
Figure 28 Mexico GDP – Composition of 2023, By Sector of Origin
Figure 29 Mexico Export and Import Value & Volume, 2023-2030 ($)
Figure 30 South America Particle Size Analyzer MarketSouth America 3D Printing Market Value & Volume, 2023-2030 ($)
Figure 31 Brazil Particle Size Analyzer Market Value & Volume, 2023-2030 ($)
Figure 32 Brazil GDP and Population, 2023-2030 ($)
Figure 33 Brazil GDP – Composition of 2023, By Sector of Origin
Figure 34 Brazil Export and Import Value & Volume, 2023-2030 ($)
Figure 35 Venezuela Particle Size Analyzer Market Value & Volume, 2023-2030 ($)
Figure 36 Venezuela GDP and Population, 2023-2030 ($)
Figure 37 Venezuela GDP – Composition of 2023, By Sector of Origin
Figure 38 Venezuela Export and Import Value & Volume, 2023-2030 ($)
Figure 39 Argentina Particle Size Analyzer Market Value & Volume, 2023-2030 ($)
Figure 40 Argentina GDP and Population, 2023-2030 ($)
Figure 41 Argentina GDP – Composition of 2023, By Sector of Origin
Figure 42 Argentina Export and Import Value & Volume, 2023-2030 ($)
Figure 43 Ecuador Particle Size Analyzer Market Value & Volume, 2023-2030 ($)
Figure 44 Ecuador GDP and Population, 2023-2030 ($)
Figure 45 Ecuador GDP – Composition of 2023, By Sector of Origin
Figure 46 Ecuador Export and Import Value & Volume, 2023-2030 ($)
Figure 47 Peru Particle Size Analyzer Market Value & Volume, 2023-2030 ($)
Figure 48 Peru GDP and Population, 2023-2030 ($)
Figure 49 Peru GDP – Composition of 2023, By Sector of Origin
Figure 50 Peru Export and Import Value & Volume, 2023-2030 ($)
Figure 51 Colombia Particle Size Analyzer Market Value & Volume, 2023-2030 ($)
Figure 52 Colombia GDP and Population, 2023-2030 ($)
Figure 53 Colombia GDP – Composition of 2023, By Sector of Origin
Figure 54 Colombia Export and Import Value & Volume, 2023-2030 ($)
Figure 55 Costa Rica Particle Size Analyzer MarketCosta Rica 3D Printing Market Value & Volume, 2023-2030 ($)
Figure 56 Costa Rica GDP and Population, 2023-2030 ($)
Figure 57 Costa Rica GDP – Composition of 2023, By Sector of Origin
Figure 58 Costa Rica Export and Import Value & Volume, 2023-2030 ($)
Figure 59 Europe Particle Size Analyzer Market Value & Volume, 2023-2030 ($)
Figure 60 U.K Particle Size Analyzer Market Value & Volume, 2023-2030 ($)
Figure 61 U.K GDP and Population, 2023-2030 ($)
Figure 62 U.K GDP – Composition of 2023, By Sector of Origin
Figure 63 U.K Export and Import Value & Volume, 2023-2030 ($)
Figure 64 Germany Particle Size Analyzer Market Value & Volume, 2023-2030 ($)
Figure 65 Germany GDP and Population, 2023-2030 ($)
Figure 66 Germany GDP – Composition of 2023, By Sector of Origin
Figure 67 Germany Export and Import Value & Volume, 2023-2030 ($)
Figure 68 Italy Particle Size Analyzer Market Value & Volume, 2023-2030 ($)
Figure 69 Italy GDP and Population, 2023-2030 ($)
Figure 70 Italy GDP – Composition of 2023, By Sector of Origin
Figure 71 Italy Export and Import Value & Volume, 2023-2030 ($)
Figure 72 France Particle Size Analyzer Market Value & Volume, 2023-2030 ($)
Figure 73 France GDP and Population, 2023-2030 ($)
Figure 74 France GDP – Composition of 2023, By Sector of Origin
Figure 75 France Export and Import Value & Volume, 2023-2030 ($)
Figure 76 Netherlands Particle Size Analyzer Market Value & Volume, 2023-2030 ($)
Figure 77 Netherlands GDP and Population, 2023-2030 ($)
Figure 78 Netherlands GDP – Composition of 2023, By Sector of Origin
Figure 79 Netherlands Export and Import Value & Volume, 2023-2030 ($)
Figure 80 Belgium Particle Size Analyzer Market Value & Volume, 2023-2030 ($)
Figure 81 Belgium GDP and Population, 2023-2030 ($)
Figure 82 Belgium GDP – Composition of 2023, By Sector of Origin
Figure 83 Belgium Export and Import Value & Volume, 2023-2030 ($)
Figure 84 Spain Particle Size Analyzer Market Value & Volume, 2023-2030 ($)
Figure 85 Spain GDP and Population, 2023-2030 ($)
Figure 86 Spain GDP – Composition of 2023, By Sector of Origin
Figure 87 Spain Export and Import Value & Volume, 2023-2030 ($)
Figure 88 Denmark Particle Size Analyzer Market Value & Volume, 2023-2030 ($)
Figure 89 Denmark GDP and Population, 2023-2030 ($)
Figure 90 Denmark GDP – Composition of 2023, By Sector of Origin
Figure 91 Denmark Export and Import Value & Volume, 2023-2030 ($)
Figure 92 APAC Particle Size Analyzer Market Value & Volume, 2023-2030 ($)
Figure 93 China Particle Size Analyzer MarketValue & Volume, 2023-2030
Figure 94 China GDP and Population, 2023-2030 ($)
Figure 95 China GDP – Composition of 2023, By Sector of Origin
Figure 96 China Export and Import Value & Volume, 2023-2030 ($)Particle Size Analyzer MarketChina Export and Import Value & Volume, 2023-2030 ($)
Figure 97 Australia Particle Size Analyzer Market Value & Volume, 2023-2030 ($)
Figure 98 Australia GDP and Population, 2023-2030 ($)
Figure 99 Australia GDP – Composition of 2023, By Sector of Origin
Figure 100 Australia Export and Import Value & Volume, 2023-2030 ($)
Figure 101 South Korea Particle Size Analyzer Market Value & Volume, 2023-2030 ($)
Figure 102 South Korea GDP and Population, 2023-2030 ($)
Figure 103 South Korea GDP – Composition of 2023, By Sector of Origin
Figure 104 South Korea Export and Import Value & Volume, 2023-2030 ($)
Figure 105 India Particle Size Analyzer Market Value & Volume, 2023-2030 ($)
Figure 106 India GDP and Population, 2023-2030 ($)
Figure 107 India GDP – Composition of 2023, By Sector of Origin
Figure 108 India Export and Import Value & Volume, 2023-2030 ($)
Figure 109 Taiwan Particle Size Analyzer MarketTaiwan 3D Printing Market Value & Volume, 2023-2030 ($)
Figure 110 Taiwan GDP and Population, 2023-2030 ($)
Figure 111 Taiwan GDP – Composition of 2023, By Sector of Origin
Figure 112 Taiwan Export and Import Value & Volume, 2023-2030 ($)
Figure 113 Malaysia Particle Size Analyzer MarketMalaysia 3D Printing Market Value & Volume, 2023-2030 ($)
Figure 114 Malaysia GDP and Population, 2023-2030 ($)
Figure 115 Malaysia GDP – Composition of 2023, By Sector of Origin
Figure 116 Malaysia Export and Import Value & Volume, 2023-2030 ($)
Figure 117 Hong Kong Particle Size Analyzer MarketHong Kong 3D Printing Market Value & Volume, 2023-2030 ($)
Figure 118 Hong Kong GDP and Population, 2023-2030 ($)
Figure 119 Hong Kong GDP – Composition of 2023, By Sector of Origin
Figure 120 Hong Kong Export and Import Value & Volume, 2023-2030 ($)
Figure 121 Middle East & Africa Particle Size Analyzer MarketMiddle East & Africa 3D Printing Market Value & Volume, 2023-2030 ($)
Figure 122 Russia Particle Size Analyzer MarketRussia 3D Printing Market Value & Volume, 2023-2030 ($)
Figure 123 Russia GDP and Population, 2023-2030 ($)
Figure 124 Russia GDP – Composition of 2023, By Sector of Origin
Figure 125 Russia Export and Import Value & Volume, 2023-2030 ($)
Figure 126 Israel Particle Size Analyzer Market Value & Volume, 2023-2030 ($)
Figure 127 Israel GDP and Population, 2023-2030 ($)
Figure 128 Israel GDP – Composition of 2023, By Sector of Origin
Figure 129 Israel Export and Import Value & Volume, 2023-2030 ($)
Figure 130 Entropy Share, By Strategies, 2023-2030* (%)Particle Size Analyzer Market
Figure 131 Developments, 2023-2030*Particle Size Analyzer Market
Figure 132 Company 1 Particle Size Analyzer Market Net Revenue, By Years, 2023-2030* ($)
Figure 133 Company 1 Particle Size Analyzer Market Net Revenue Share, By Business segments, 2023 (%)
Figure 134 Company 1 Particle Size Analyzer Market Net Sales Share, By Geography, 2023 (%)
Figure 135 Company 2 Particle Size Analyzer Market Net Revenue, By Years, 2023-2030* ($)
Figure 136 Company 2 Particle Size Analyzer Market Net Revenue Share, By Business segments, 2023 (%)
Figure 137 Company 2 Particle Size Analyzer Market Net Sales Share, By Geography, 2023 (%)
Figure 138 Company 3Particle Size Analyzer Market Net Revenue, By Years, 2023-2030* ($)
Figure 139 Company 3Particle Size Analyzer Market Net Revenue Share, By Business segments, 2023 (%)
Figure 140 Company 3Particle Size Analyzer Market Net Sales Share, By Geography, 2023 (%)
Figure 141 Company 4 Particle Size Analyzer Market Net Revenue, By Years, 2023-2030* ($)
Figure 142 Company 4 Particle Size Analyzer Market Net Revenue Share, By Business segments, 2023 (%)
Figure 143 Company 4 Particle Size Analyzer Market Net Sales Share, By Geography, 2023 (%)
Figure 144 Company 5 Particle Size Analyzer Market Net Revenue, By Years, 2023-2030* ($)
Figure 145 Company 5 Particle Size Analyzer Market Net Revenue Share, By Business segments, 2023 (%)
Figure 146 Company 5 Particle Size Analyzer Market Net Sales Share, By Geography, 2023 (%)
Figure 147 Company 6 Particle Size Analyzer Market Net Revenue, By Years, 2023-2030* ($)
Figure 148 Company 6 Particle Size Analyzer Market Net Revenue Share, By Business segments, 2023 (%)
Figure 149 Company 6 Particle Size Analyzer Market Net Sales Share, By Geography, 2023 (%)
Figure 150 Company 7 Particle Size Analyzer Market Net Revenue, By Years, 2023-2030* ($)
Figure 151 Company 7 Particle Size Analyzer Market Net Revenue Share, By Business segments, 2023 (%)
Figure 152 Company 7 Particle Size Analyzer Market Net Sales Share, By Geography, 2023 (%)
Figure 153 Company 8 Particle Size Analyzer Market Net Revenue, By Years, 2023-2030* ($)
Figure 154 Company 8 Particle Size Analyzer Market Net Revenue Share, By Business segments, 2023 (%)
Figure 155 Company 8 Particle Size Analyzer Market Net Sales Share, By Geography, 2023 (%)
Figure 156 Company 9 Particle Size Analyzer Market Net Revenue, By Years, 2023-2030* ($)
Figure 157 Company 9 Particle Size Analyzer Market Net Revenue Share, By Business segments, 2023 (%)
Figure 158 Company 9 Particle Size Analyzer Market Net Sales Share, By Geography, 2023 (%)
Figure 159 Company 10 Particle Size Analyzer Market Net Revenue, By Years, 2023-2030* ($)
Figure 160 Company 10 Particle Size Analyzer Market Net Revenue Share, By Business segments, 2023 (%)
Figure 161 Company 10 Particle Size Analyzer Market Net Sales Share, By Geography, 2023 (%)
Figure 162 Company 11 Particle Size Analyzer Market Net Revenue, By Years, 2023-2030* ($)
Figure 163 Company 11 Particle Size Analyzer Market Net Revenue Share, By Business segments, 2023 (%)
Figure 164 Company 11 Particle Size Analyzer Market Net Sales Share, By Geography, 2023 (%)
Figure 165 Company 12 Particle Size Analyzer Market Net Revenue, By Years, 2023-2030* ($)
Figure 166 Company 12 Particle Size Analyzer Market Net Revenue Share, By Business segments, 2023 (%)
Figure 167 Company 12 Particle Size Analyzer Market Net Sales Share, By Geography, 2023 (%)
Figure 168 Company 13Particle Size Analyzer Market Net Revenue, By Years, 2023-2030* ($)
Figure 169 Company 13Particle Size Analyzer Market Net Revenue Share, By Business segments, 2023 (%)
Figure 170 Company 13Particle Size Analyzer Market Net Sales Share, By Geography, 2023 (%)
Figure 171 Company 14 Particle Size Analyzer Market Net Revenue, By Years, 2023-2030* ($)
Figure 172 Company 14 Particle Size Analyzer Market Net Revenue Share, By Business segments, 2023 (%)
Figure 173 Company 14 Particle Size Analyzer Market Net Sales Share, By Geography, 2023 (%)
Figure 174 Company 15 Particle Size Analyzer Market Net Revenue, By Years, 2023-2030* ($)
Figure 175 Company 15 Particle Size Analyzer Market Net Revenue Share, By Business segments, 2023 (%)
Figure 176 Company 15 Particle Size Analyzer Market Net Sales Share, By Geography, 2023 (%)